
Select a trading day to view all Scanner results, chart evidence, and market explanations.
11 Scanners Available
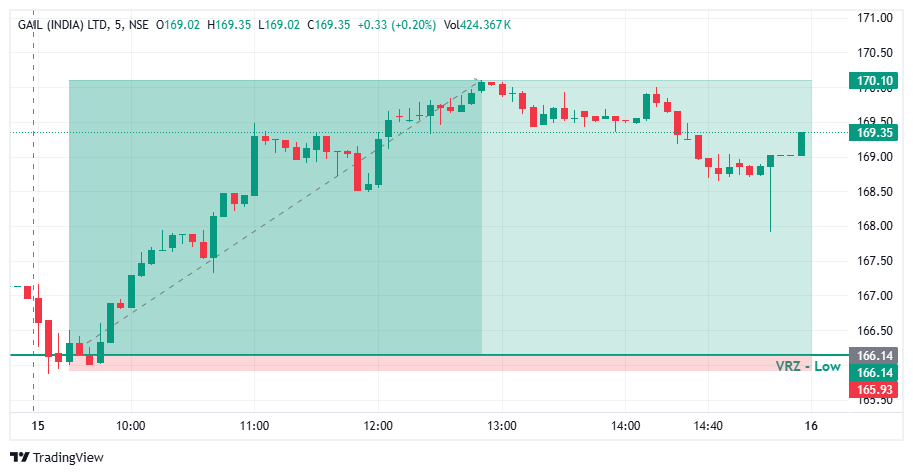

🔎 GAIL opened with a quick dip and moved straight into the support area in the first candles.
⚠️ Price tested the ₹166.14 VRZ Low, where a breakdown looked likely.
🎯 The VRZ Low became the key technical reference for spotting a potential bullish Breakout Failure.
🔻 Price dipped below the ₹166.14 VRZ Low and tagged the ₹165.93 area, showing a clear attempt by sellers to extend the downside.
🚫 The move below support was shallow and could not hold.
🔄 Buyers stepped in right at the lows, forming the first base for a bullish reversal.
🎯 Price closed back above the ₹166.14 VRZ Low, confirming a Bullish Breakout Failure structure.
⚡ The failed breakdown showed that sellers had lost control below support.
📈 Once the level was reclaimed, short-term momentum shifted decisively toward the buyers.
📈 After the VRZ Low rejection, GAIL climbed steadily with higher lows and strong green candles.
⚡ Trapped sellers covered and buyers pushed price out of the breakdown zone into a sharp bullish recovery.
💥 The rally extended to around ₹170.10, a 2.38% price expansion that confirmed the successful BOF outcome.
🔍 The chart shows an early dip, a brief break of the ₹166.14 VRZ Low, and a strong recovery from the support area.
🟢 The reclaim of the zone was the key confirmation for the bullish BOF structure.
📈 Price then travelled up to the ₹170.10 area and held well above the VRZ Low for the rest of the session.
🎯 The shift from breakdown pressure to bullish expansion was the defining technical event of this setup.
🔎 The main signal was the failed breakdown below the ₹166.14 VRZ Low.
⚡ Sellers pushed price under support, but the move lacked sustained follow-through.
🟢 The reclaim of the VRZ Low signalled a change in short-term price structure.
📈 Buyers then drove the recovery to higher levels, producing the reported 2.38% move.
🟢 VRZ Low: ₹166.14 served as the primary support reference.
🪤 Bear Trap: Sellers could not hold price below the support zone.
🛡️ Buyer Defense: Buyers responded strongly near the ₹165.93 low.
🔄 Bullish Reclaim: Price recovered back above the key level.
📊 Momentum Shift: Short-term momentum turned bullish after the failed breakdown.
🚀 Upside Expansion: Price advanced toward the ₹170.10 area.
🏆 Trade Outcome: 2.38% upside with 1:19 RR.
🎯 The ₹166.14 VRZ Low, with the ₹165.93 swing low just below it, gave a very tight and clearly defined risk reference for the bullish BOF setup.
⚖️ A very small, defined risk against a much larger upside move produced the 1:19 Risk-to-Reward outcome.
🧠 Structured position sizing, predefined invalidation levels, and disciplined execution matter when trading Breakout Failure setups.
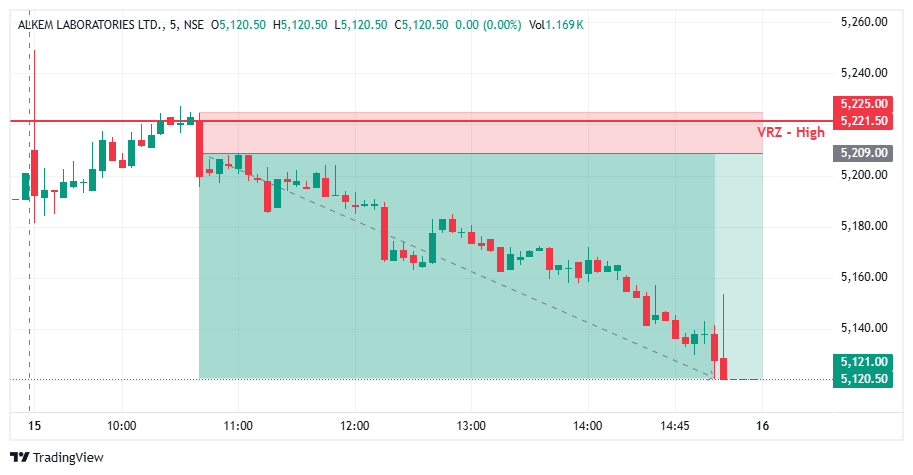

🔎 ALKEM opened firm and climbed steadily through the morning with higher lows.
⚠️ Price moved into the ₹5,221.50 VRZ High, where a breakout looked possible.
🎯 The VRZ High became the key technical reference for spotting a potential bearish Breakout Failure.
📈 Price pushed above the ₹5,221.50 VRZ High and reached the ₹5,225.00 area, showing a clear attempt by buyers to extend the upside.
🪤 The move above resistance was small and could not hold.
🔄 Sellers stepped in right at the highs, forming the first base for a bearish reversal.
🎯 Price closed back below the ₹5,221.50 VRZ High, confirming a Bearish Breakout Failure structure.
⚡ The failed breakout showed that buyers had lost control above resistance.
📉 Once the level was lost, short-term momentum shifted decisively toward the sellers.
📉 After the VRZ High rejection, ALKEM slid steadily with lower highs and consistent red candles.
⚡ Price stayed below the rejected zone and worked its way lower through the whole session.
💥 The decline reached near ₹5,120.50, a 1.69% price expansion that confirmed the successful BOF outcome.
🔍 The chart shows a steady morning climb, a brief break of the ₹5,221.50 VRZ High, and a long, orderly decline from the resistance area.
🔴 The loss of the zone was the key confirmation for the bearish BOF structure.
📉 Price never reclaimed the VRZ High, and sellers kept control all the way to the ₹5,120.50 area.
🎯 The shift from breakout pressure to sustained bearish expansion was the defining technical event of this setup.
🔎 The main signal was the failed breakout above the ₹5,221.50 VRZ High.
⚡ Buyers pushed price above resistance, but the move lacked sustained follow-through.
🔴 The loss of the VRZ High signalled a change in short-term price structure.
📉 Sellers then drove the decline to much lower levels, producing the reported 1.69% move.
🔴 VRZ High: ₹5,221.50 served as the primary resistance reference.
⚠️ Breakout Failure: Buyers could not hold price above the resistance zone.
🛡️ Seller Defense: Sellers responded strongly near the ₹5,225.00 high.
🔄 Bearish Rejection: Price fell back below the key level.
📊 Momentum Shift: Short-term momentum turned bearish after the failed breakout.
🔻 Downside Expansion: Price declined toward the ₹5,120.50 area.
🏆 Trade Outcome: 1.69% downside with 1:5 RR.
🎯 The ₹5,221.50 VRZ High, with the ₹5,225.00 swing high just above it, gave a tight and clearly defined risk reference for the bearish BOF setup.
⚖️ A small, defined risk above resistance against a larger downside move produced the 1:5 Risk-to-Reward outcome.
🧠 Structured position sizing, predefined invalidation levels, and disciplined execution matter when trading Breakout Failure setups.
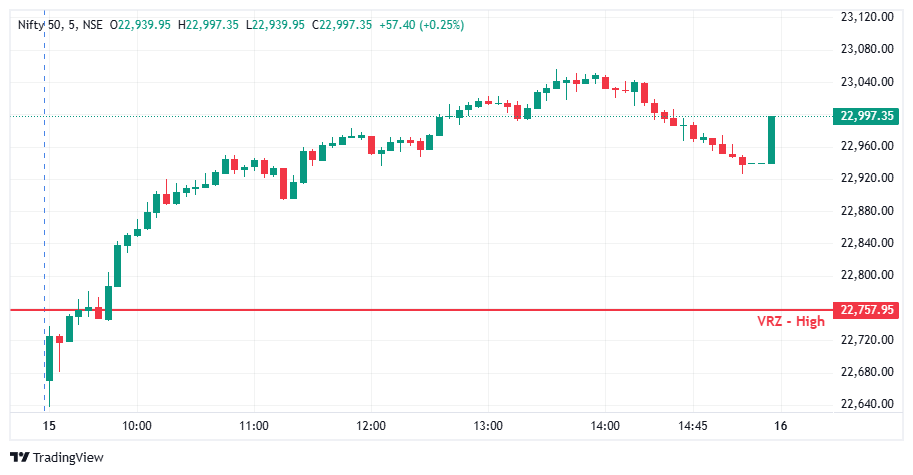

NIFTY 50 established a strong upward intraday structure shortly after the 9:45 AM trigger at 22,757.95. Buyers maintained control as price continued moving higher, creating successive upward levels instead of following the expected bearish path toward the VRZ High. The sustained bullish movement contradicted the original trade thesis and clearly indicated that the anticipated BOF setup was failing.📈
Strong bullish candles appeared during the morning advance, reflecting firm buying momentum and continued upward pressure. Price maintained its bullish structure through much of the session, while the late-session pullback remained limited compared with the overall rally. NIFTY 50 reached approximately 22,997.35, staying significantly above the trigger level and confirming that the expected bearish move did not develop. 🟢
Define the Stop Loss and invalidation conditions before entering any BOF trade. After the trigger, monitor whether price follows the expected direction instead of assuming that the target will eventually be reached. When strong price action contradicts the original setup, follow predefined risk-management rules and avoid holding a trade based on hope. Capital protection and disciplined execution must remain the priority, even when the market later presents a different opportunity. 🔐
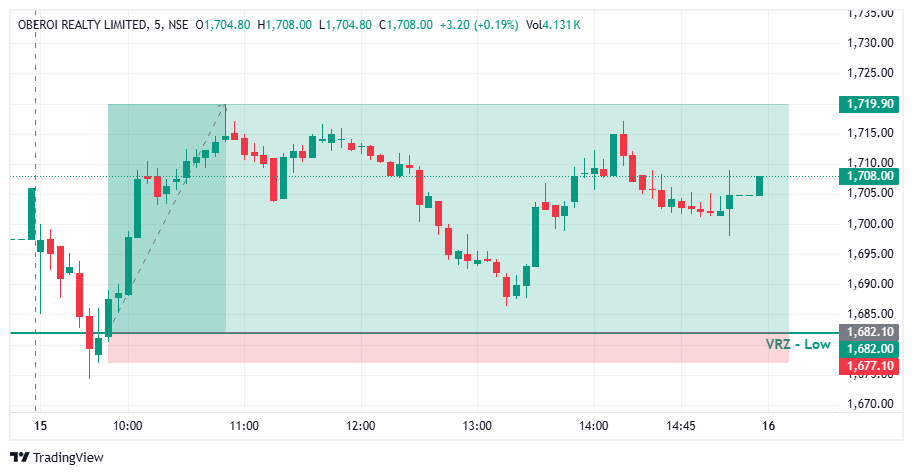

🔎 OBEROI REALTY experienced selling pressure during the early session, with price declining toward the ₹1,682.00 VRZ Low.
⚠️ The downward move brought price into a critical support region, creating the possibility of a breakdown below the marked level.
🎯 The VRZ Low became the key technical reference for monitoring a potential bullish reversal.
📉 Price moved below the VRZ Low area before recovering from the lower region.
🪤 The breakdown failed to develop into sustained downside continuation, suggesting that sellers were losing control near support.
🟢 Buyers responded around the zone, helping price recover above the marked VRZ Low.
🎯 The recovery from the VRZ Low formed the basis of a Bullish Breakout Failure setup.
⚡ The move back above the support area indicated a potential shift in short-term momentum.
📈 Buyers pushed price higher, establishing a strong recovery from the session's lower levels.
📈 Following the VRZ Low rejection, OBEROI REALTY advanced toward higher price levels.
⚡ The initial recovery developed into a broader intraday rebound, with price moving toward the ₹1,719.90 area.
💥 The reported trade outcome was a 2.25% price move with 1:7 RR, highlighting the performance attributed to the setup.
🔍 The chart illustrates an early decline followed by a strong recovery from the VRZ Low.
🛡️ Support Reaction: Price responded around the ₹1,682.00 region.
🔄 Structure Shift: The recovery indicated improving short-term bullish momentum.
📈 Upward Expansion: Price advanced toward the upper marked area.
🎯 Technical Reference: The VRZ Low provided the key level for evaluating the bullish BOF structure.
🔎 The central feature of this setup was the failed breakdown around the ₹1,682.00 VRZ Low.
⚠️ Sellers attempted to push price below support but failed to sustain the decline.
🟢 The subsequent recovery above the zone suggested that buying pressure was returning.
📈 The bullish rebound that followed aligned with the BOF setup and contributed to the reported 2.25% move.
🟢 VRZ Low: ₹1,682.00 served as the primary support reference.
📉 Breakdown Attempt: Price moved below the support area before recovering.
🛡️ Support Rejection: Buyers responded near the lower zone.
🔄 Bullish Reclaim: Price recovered above the VRZ Low.
⚡ Momentum Shift: The recovery supported a bullish intraday structure.
🚀 Price Expansion: Price advanced toward ₹1,719.90.
🏆 Reported Outcome: 2.25% move with 1:7 RR.
🎯 The VRZ Low provided a defined technical reference for assessing the bullish setup.
⚖️ A 1:7 risk-to-reward ratio represents a potential reward of seven units for every unit of defined risk.
🧠 Stop-loss placement, position sizing, and disciplined execution remain important when trading Breakout Failure patterns.

🎯 Detect VRZ High & VRZ Low Breakout Failure setups as they form.
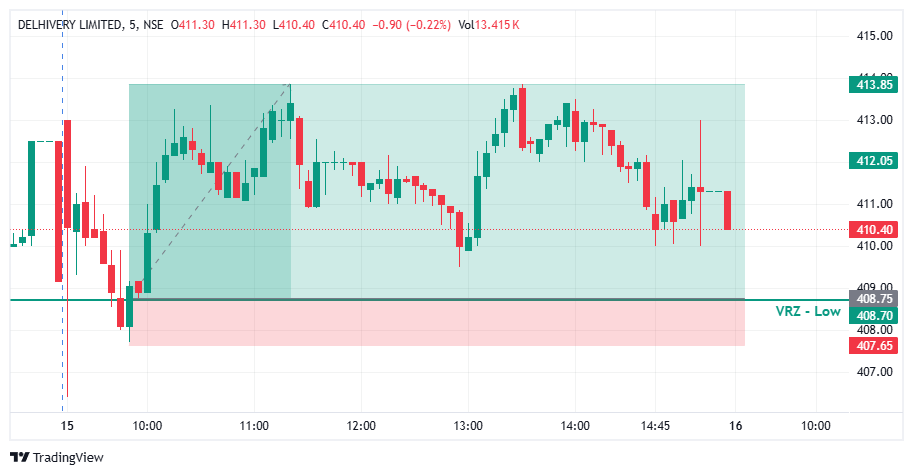

🔎 DELHIVERY opened with volatile swings and slid steadily toward the support area in the first candles.
⚠️ Price moved into the ₹408.70 VRZ Low, where a breakdown looked likely.
🎯 The VRZ Low became the key technical reference for spotting a potential bullish Breakout Failure.
🔻 Price dipped below the ₹408.70 VRZ Low and tagged the ₹407.65 area, showing a clear attempt by sellers to extend the downside.
🚫 The move below support was shallow and could not hold.
🔄 Buyers stepped in right at the lows, forming the first base for a bullish reversal.
🎯 Price closed back above the ₹408.70 VRZ Low, confirming a Bullish Breakout Failure structure.
⚡ The failed breakdown showed that sellers had lost control below support.
📈 Once the level was reclaimed, short-term momentum shifted decisively toward the buyers.
📈 After the VRZ Low rejection, DELHIVERY climbed steadily with higher lows and strong green candles.
⚡ Trapped sellers covered and buyers pushed price out of the breakdown zone into a bullish recovery.
💥 The rally extended to around ₹413.85, a 1.25% price expansion that confirmed the successful BOF outcome.
🔍 The chart shows an early dip, a brief break of the ₹408.70 VRZ Low, and a clean recovery from the support area.
🟢 The reclaim of the zone was the key confirmation for the bullish BOF structure.
📈 Price then travelled up to the ₹413.85 area and held above the VRZ Low for the rest of the session.
🎯 The shift from breakdown pressure to bullish expansion was the defining technical event of this setup.
🔎 The main signal was the failed breakdown below the ₹408.70 VRZ Low.
⚡ Sellers pushed price under support, but the move lacked sustained follow-through.
🟢 The reclaim of the VRZ Low signalled a change in short-term price structure.
📈 Buyers then drove the recovery to higher levels, producing the reported 1.25% move.
🟢 VRZ Low: ₹408.70 served as the primary support reference.
🪤 Bear Trap: Sellers could not hold price below the support zone.
🛡️ Buyer Defense: Buyers responded strongly near the ₹407.65 low.
🔄 Bullish Reclaim: Price recovered back above the key level.
📊 Momentum Shift: Short-term momentum turned bullish after the failed breakdown.
🚀 Upside Expansion: Price advanced toward the ₹413.85 area.
🏆 Trade Outcome: 1.25% upside with 1:4 RR.
🎯 The ₹408.70 VRZ Low, with the ₹407.65 swing low just below it, gave a tight and clearly defined risk reference for the bullish BOF setup.
⚖️ A small, defined risk against a larger upside move produced the 1:4 Risk-to-Reward outcome.
🧠 Structured position sizing, predefined invalidation levels, and disciplined execution matter when trading Breakout Failure setups.
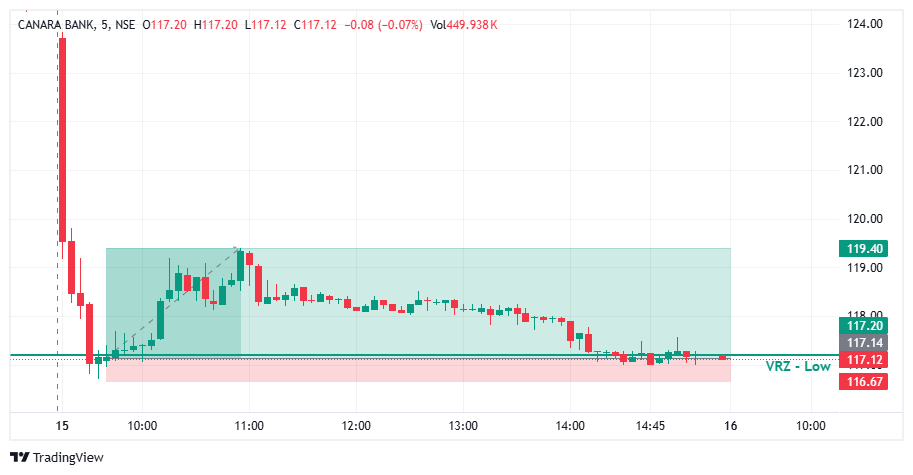

Canara Bank opened with heavy selling pressure and dropped sharply into the VRZ Low (₹117.14), a key demand zone marked on the 30-minute chart.
Price briefly slipped below the support level, but sellers were unable to keep control. Buyers stepped in quickly and pushed price back above the zone, creating a classic Breakdown Failure.
The Logical Trading System (LTS) generated a valid BOF Buy setup, anticipating a bullish reversal from the demand area.
The morning sell-off had pushed the stock into oversold territory just as it reached the VRZ Low.
The failed breakdown showed that sellers were exhausted at this level. Aggressive buying followed, and price began forming higher highs and higher lows.
This shift in structure signaled genuine accumulation rather than a weak bounce.
The BOF Buy trade was activated once price reclaimed the VRZ Low after the false breakdown.
The setup respected every rule of the trading strategy, with a clearly defined stop loss placed below the failure low.
After entry, buying momentum expanded steadily. Price moved higher without meaningful pullbacks and reached the target near ₹119.40.
The trade closed with a gain of 1.93%, delivering a 1:5 risk-reward ratio.
The trade succeeded because buyers defended the VRZ Low decisively and generated strong follow-through immediately after the reclaim.
✅ Sharp rejection from below the VRZ Low.
✅ Quick reclaim of the support zone.
✅ Strong bullish candles after entry.
✅ Higher highs and higher lows formed.
✅ Sellers failed to push price back into the zone.
These signals significantly increased the probability of a successful BOF reversal.
This chart demonstrates a successful Breakdown Failure (BOF) reversal with strong follow-through.
🔴 Price swept below the VRZ Low and trapped sellers.
🟢 Buyers reclaimed the zone with conviction.
🚀 Momentum expanded toward the ₹119.40 target.
🎯 Target achieved with a 1:5 risk-reward.
This type of price action often occurs when a false breakdown traps sellers and forces them to cover, adding fuel to the reversal.
📊 Failed breakdowns at key demand zones can produce high-quality reversals.
🛡️ A tight, defined stop loss allows for outsized reward relative to risk.
⚡ Strong follow-through after the reclaim confirms buyer strength.
🎯 A 1:5 risk-reward means one winner can offset multiple small losses.
📈 Consistency comes from following the process, not from predicting every move.
This was a clean BOF execution according to the Logical Trading System (LTS).
Experienced traders recognize that:
✅ Waiting for the setup to complete matters more than anticipating it.
✅ Risk is defined before reward is considered.
✅ Winning trades come from disciplined execution, not luck.
✅ Patience at key zones pays off over time.
Professional trading is built on preserving capital while capturing quality opportunities.
✔️ Entry followed predefined BOF rules.
✔️ Stop loss was defined before execution.
✔️ Risk was small relative to the potential reward.
✔️ Target was achieved without deviating from the plan.
Good risk management turns a 1.93% move into a 1:5 outcome.
📈 Long-term trading success comes from repeatedly executing high-quality setups with favorable risk-reward, letting winners compound over time.
🛡️ Professional traders judge their performance by disciplined execution over hundreds of trades, not by a single outcome.
🏆 This Canara Bank BOF success shows how a failed breakdown at a well-marked demand zone, combined with strong follow-through, can deliver a high-probability reversal with excellent risk-reward.
🌍 Markets reward discipline, patience, and effective risk management.
💪 Follow your trading plan, protect your capital, and let consistency guide every decision.

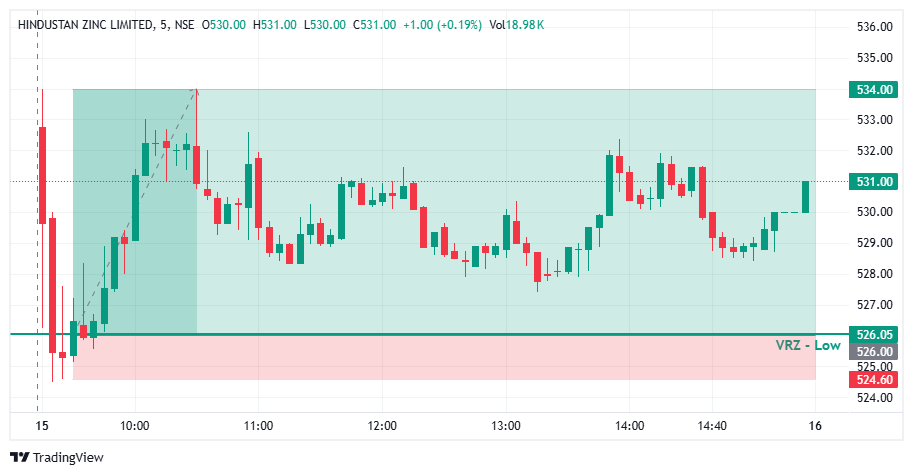

🔻 HINDZINC tested the VRZ Low, where sellers attempted to push price below the support zone.
🚨 The breakdown failed to sustain as price rejected the lower levels around ₹526.05.
🟢 This rejection confirmed the Breakdown Failure (BOF) structure and created a potential bullish intraday setup.
🟢 Buyers stepped in after the failed breakdown and reclaimed the VRZ Low area.
📊 The recovery from ₹526.05 showed improving buying participation and weakening selling pressure.
🚀 The setup ultimately delivered a 1.52% bullish move with a strong 1:5.7 Risk-Reward.
🔴 Sellers: Attempted to sustain the breakdown below the VRZ Low.
🟡 Breakdown Traders: Came under pressure as price quickly rejected the lower zone.
🟢 Buyers: Regained control and drove the bullish recovery.
🎭 The initial move below the VRZ Low created bearish expectations.
⚠️ However, sellers failed to maintain downside control.
📈 The sharp rejection shifted momentum toward buyers and supported the bullish reversal.
🎯 The key confirmation came when HINDZINC rejected the ₹526.05 VRZ Low and moved back above the support area.
🔄 The failed breakdown indicated that bearish momentum was losing strength.
⚡ Continued upside price action validated the bullish BOF structure.
🔸 🚫 Failed Breakdowns Can Trap Sellers
When price fails to sustain below support, bearish positions can come under pressure.
🔹 🎯 VRZ Low Rejection Signals Buyer Strength
The rejection around ₹526.05 highlighted renewed demand at the key zone.
🛡️ Defined Risk Improves Trade Discipline
The VRZ Low provided a clear technical reference for managing risk.
⚡ 📈 Follow-Through Strengthens the Reversal
Continued upside movement confirmed stronger bullish participation.
📈 Following the VRZ Low rejection, HINDZINC developed a stronger bullish intraday structure.
🟢 Buyers maintained control as price moved away from the support zone.
🚀 The improving structure supported continued upside momentum.
🔥 Buying pressure strengthened after the failed breakdown.
📈 HINDZINC extended the move higher from the VRZ Low and delivered a 1.52% bullish move.
🏆 The setup achieved an impressive 1:5.7 Risk-Reward outcome.
🔸 The setup became actionable after HINDZINC failed to sustain below the ₹526.05 VRZ Low.
📈 Buyers reclaimed the support area and maintained bullish control.
⚖️ The confirmed BOF structure provided a disciplined intraday setup with defined risk and a 1:5.7 RR opportunity.
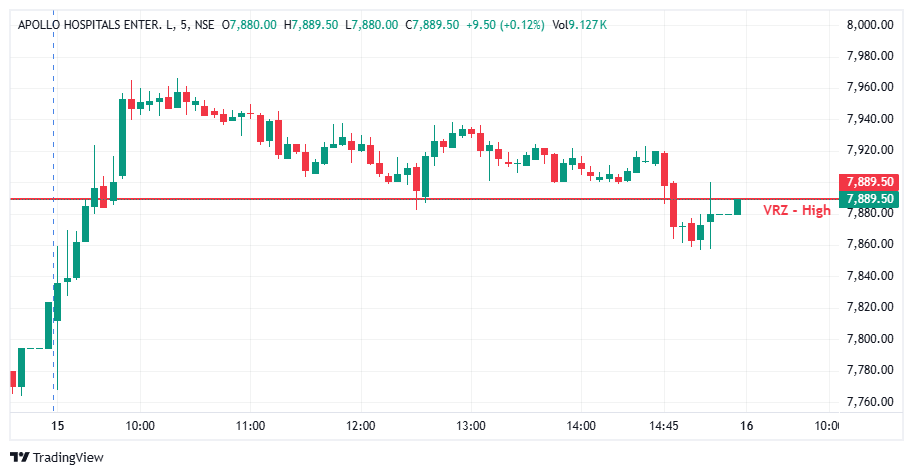

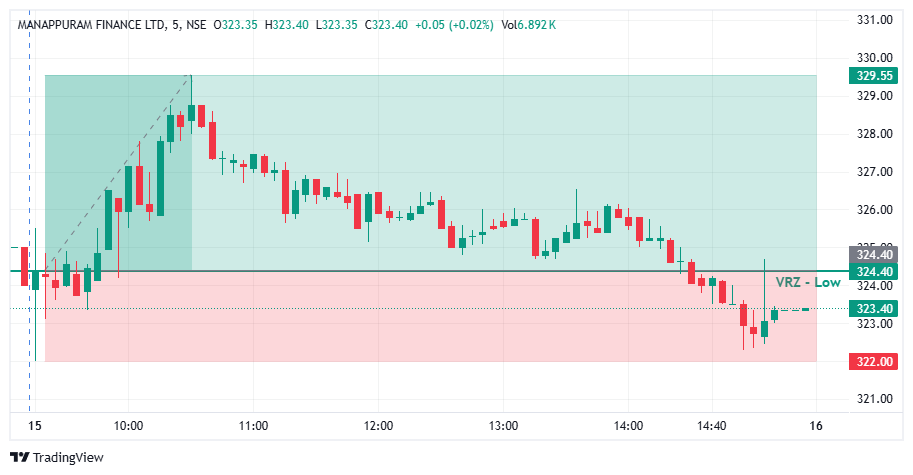

🔎 MANAPPURAM FINANCE initially moved higher before gradually losing momentum throughout the session.
⚠️ The price decline brought the stock back toward the ₹324.40 VRZ Low, an important technical support reference.
🎯 This zone became crucial for monitoring whether sellers could sustain a breakdown or buyers would defend the support area.
📉 Selling pressure increased as price approached and moved below the ₹324.40 VRZ Low.
🪤 However, the bearish move did not immediately develop into a sustained breakdown, creating the possibility of a failed breakdown pattern.
🔍 The key technical signal was whether price could recover above the marked zone and establish a bullish reversal.
🎯 A Bullish Breakout Failure setup develops when price breaks below support but fails to sustain the breakdown and reclaims the key level.
🟢 In this chart, price approached the VRZ Low and showed a recovery from the lower region.
⚡ This recovery is consistent with a potential bullish BOF structure, although confirmation depends on the reclaim and follow-through in price action.
🔍 The chart shows a strong early advance followed by a prolonged intraday decline.
📉 Selling pressure eventually brought price toward the ₹324.40 VRZ Low.
🛡️ The lower zone became the key area for evaluating a potential reversal.
🔄 The recovery from the session's lower region suggested a possible short-term shift in momentum.
🎯 The marked ₹322.00 level identifies the lower boundary of the displayed trade zone.
🔎 The primary focus of this setup is the interaction between price and the ₹324.40 VRZ Low.
⚠️ A temporary move below support does not independently confirm a bullish BOF.
🟢 A sustained reclaim, followed by bullish follow-through, provides stronger evidence that sellers have failed to maintain downside control.
📊 Combining the VRZ level with candle structure and momentum can help traders assess the quality of a potential reversal.
🧭 VRZ Low: ₹324.40 served as the primary support reference.
📉 Selling Pressure: Price declined toward the lower zone after the early advance.
🔍 Breakdown Test: The support area became critical for assessing bearish continuation versus reversal.
🛡️ Support Reaction: Price showed a recovery from the lower region.
🔄 Bullish Confirmation: A sustained reclaim of the VRZ Low would strengthen the bullish BOF interpretation.
⚖️ Risk Control: The lower boundary provides a reference for evaluating setup invalidation.
🏆 Reported Outcome: 1.59% move with 1:2 RR.
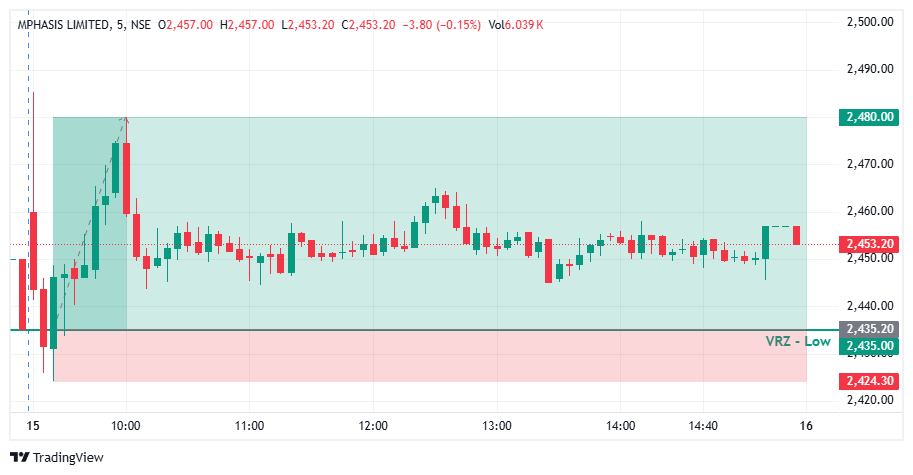

🔎 MPHASIS opened with a sharp spike, then reversed and saw heavy selling in the first few candles.
⚠️ Price slid straight into the ₹2,435.00 VRZ Low, where a breakdown looked likely.
🎯 The VRZ Low became the key technical reference for spotting a potential bullish Breakout Failure.
📉 Price dipped below the ₹2,435.00 VRZ Low and touched the ₹2,424.30 area, showing a clear attempt by sellers to extend the downside.
🪤 The move below support was shallow and could not hold.
🔄 Buyers stepped in right at the lows, forming the first base for a bullish reversal.
🎯 Price closed back above the ₹2,435.00 VRZ Low, confirming a Bullish Breakout Failure structure.
⚡ The failed breakdown showed that sellers had lost control below support.
📈 Once the level was reclaimed, short-term momentum shifted decisively toward the buyers.
📈 After the VRZ Low rejection, MPHASIS climbed quickly with a strong run of green candles.
⚡ Buyers pushed price out of the breakdown zone and into a sharp bullish expansion.
💥 The rally peaked near ₹2,480.00, a 1.84% price expansion that confirmed the successful BOF outcome.
🔍 The chart shows an early dip below the ₹2,435.00 VRZ Low, a sharp recovery from the support area, and a fast move toward the highs.
🟢 After the peak, price settled into a tight range well above the VRZ Low for the rest of the session.
📈 The reclaimed zone was never retested, keeping the bullish structure intact.
🎯 The shift from breakdown pressure to bullish expansion was the defining technical event of this setup.
🔎 The main signal was the failed breakdown below the ₹2,435.00 VRZ Low.
⚡ Sellers pushed price under support, but the move lacked sustained follow-through.
🟢 The reclaim of the VRZ Low signalled a change in short-term price structure.
📈 Buyers then drove the recovery to higher levels, producing the reported 1.84% move.
🟢 VRZ Low: ₹2,435.00 served as the primary support reference.
⚠️ Breakdown Failure: Sellers could not hold price below the support zone.
🛡️ Buyer Defense: Buyers responded strongly near the ₹2,424.30 low.
🔄 Bullish Reclaim: Price recovered back above the key level.
📊 Momentum Shift: Short-term momentum turned bullish after the failed breakdown.
🚀 Upside Expansion: Price advanced toward the ₹2,480.00 area.
🏆 Trade Outcome: 1.84% upside with 1:4 RR.
🎯 The ₹2,435.00 VRZ Low, with the ₹2,424.30 swing low just below it, gave a tight and clearly defined risk reference for the bullish BOF setup.
⚖️ A small, defined risk against a larger upside move produced the 1:4 Risk-to-Reward outcome.
🧠 Structured position sizing, predefined invalidation levels, and disciplined execution matter when trading Breakout Failure setups.
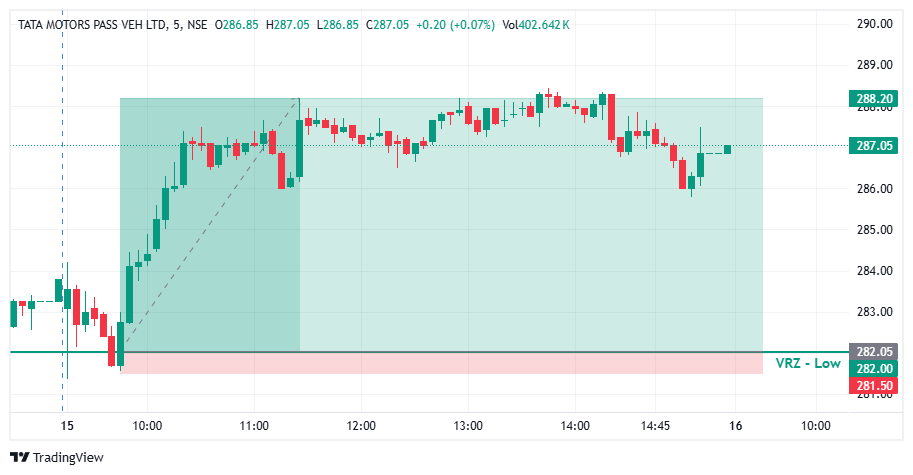

🔎 TMPV opened with a quick dip and moved straight into the support area in the first candles.
⚠️ Price tested the ₹282.00 VRZ Low, where a breakdown looked likely.
🎯 The VRZ Low became the key technical reference for spotting a potential bullish Breakout Failure.
🔻 Price dipped below the ₹282.00 VRZ Low and tagged the ₹281.50 area, showing a clear attempt by sellers to extend the downside.
🚫 The move below support was shallow and could not hold.
🔄 Buyers stepped in right at the lows, forming the first base for a bullish reversal.
🎯 Price closed back above the ₹282.00 VRZ Low, confirming a Bullish Breakout Failure structure.
⚡ The failed breakdown showed that sellers had lost control below support.
📈 Once the level was reclaimed, short-term momentum shifted decisively toward the buyers.
📈 After the VRZ Low rejection, TMPV climbed steadily with higher lows and strong green candles.
⚡ Trapped sellers covered and buyers pushed price out of the breakdown zone into a sharp bullish recovery.
💥 The rally extended to around ₹288.20, a 2.18% price expansion that confirmed the successful BOF outcome.
🔍 The chart shows an early dip, a brief break of the ₹282.00 VRZ Low, and a strong recovery from the support area.
🟢 The reclaim of the zone was the key confirmation for the bullish BOF structure.
📈 Price then travelled up to the ₹288.20 area and held well above the VRZ Low for the rest of the session.
🎯 The shift from breakdown pressure to bullish expansion was the defining technical event of this setup.
🔎 The main signal was the failed breakdown below the ₹282.00 VRZ Low.
⚡ Sellers pushed price under support, but the move lacked sustained follow-through.
🟢 The reclaim of the VRZ Low signalled a change in short-term price structure.
📈 Buyers then drove the recovery to higher levels, producing the reported 2.18% move.
🟢 VRZ Low: ₹282.00 served as the primary support reference.
🪤 Bear Trap: Sellers could not hold price below the support zone.
🛡️ Buyer Defense: Buyers responded strongly near the ₹281.50 low.
🔄 Bullish Reclaim: Price recovered back above the key level.
📊 Momentum Shift: Short-term momentum turned bullish after the failed breakdown.
🚀 Upside Expansion: Price advanced toward the ₹288.20 area.
🏆 Trade Outcome: 2.18% upside with 1:11 RR.
🎯 The ₹282.00 VRZ Low, with the ₹281.50 swing low just below it, gave a very tight and clearly defined risk reference for the bullish BOF setup.
⚖️ A small, defined risk against a much larger upside move produced the 1:11 Risk-to-Reward outcome.
🧠 Structured position sizing, predefined invalidation levels, and disciplined execution matter when trading Breakout Failure setups.