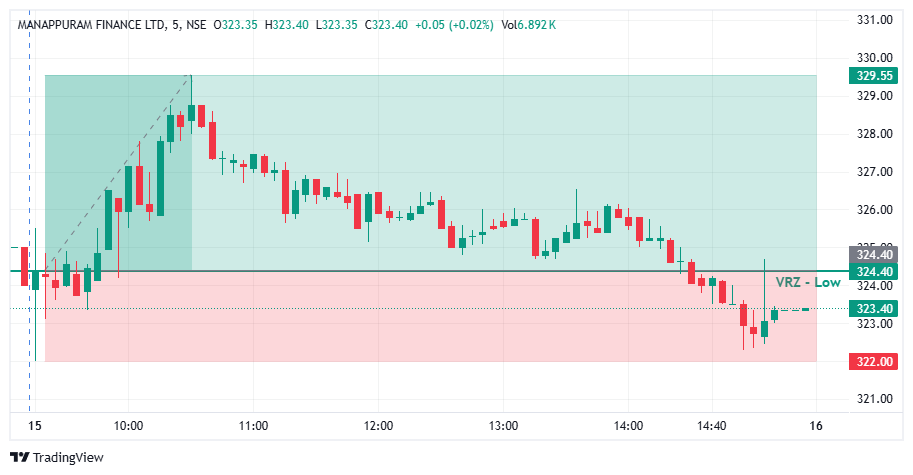

🔎 MANAPPURAM FINANCE initially moved higher before gradually losing momentum throughout the session.
⚠️ The price decline brought the stock back toward the ₹324.40 VRZ Low, an important technical support reference.
🎯 This zone became crucial for monitoring whether sellers could sustain a breakdown or buyers would defend the support area.
📉 Selling pressure increased as price approached and moved below the ₹324.40 VRZ Low.
🪤 However, the bearish move did not immediately develop into a sustained breakdown, creating the possibility of a failed breakdown pattern.
🔍 The key technical signal was whether price could recover above the marked zone and establish a bullish reversal.
🎯 A Bullish Breakout Failure setup develops when price breaks below support but fails to sustain the breakdown and reclaims the key level.
🟢 In this chart, price approached the VRZ Low and showed a recovery from the lower region.
⚡ This recovery is consistent with a potential bullish BOF structure, although confirmation depends on the reclaim and follow-through in price action.
🔍 The chart shows a strong early advance followed by a prolonged intraday decline.
📉 Selling pressure eventually brought price toward the ₹324.40 VRZ Low.
🛡️ The lower zone became the key area for evaluating a potential reversal.
🔄 The recovery from the session's lower region suggested a possible short-term shift in momentum.
🎯 The marked ₹322.00 level identifies the lower boundary of the displayed trade zone.
🔎 The primary focus of this setup is the interaction between price and the ₹324.40 VRZ Low.
⚠️ A temporary move below support does not independently confirm a bullish BOF.
🟢 A sustained reclaim, followed by bullish follow-through, provides stronger evidence that sellers have failed to maintain downside control.
📊 Combining the VRZ level with candle structure and momentum can help traders assess the quality of a potential reversal.
🧭 VRZ Low: ₹324.40 served as the primary support reference.
📉 Selling Pressure: Price declined toward the lower zone after the early advance.
🔍 Breakdown Test: The support area became critical for assessing bearish continuation versus reversal.
🛡️ Support Reaction: Price showed a recovery from the lower region.
🔄 Bullish Confirmation: A sustained reclaim of the VRZ Low would strengthen the bullish BOF interpretation.
⚖️ Risk Control: The lower boundary provides a reference for evaluating setup invalidation.
🏆 Reported Outcome: 1.59% move with 1:2 RR.