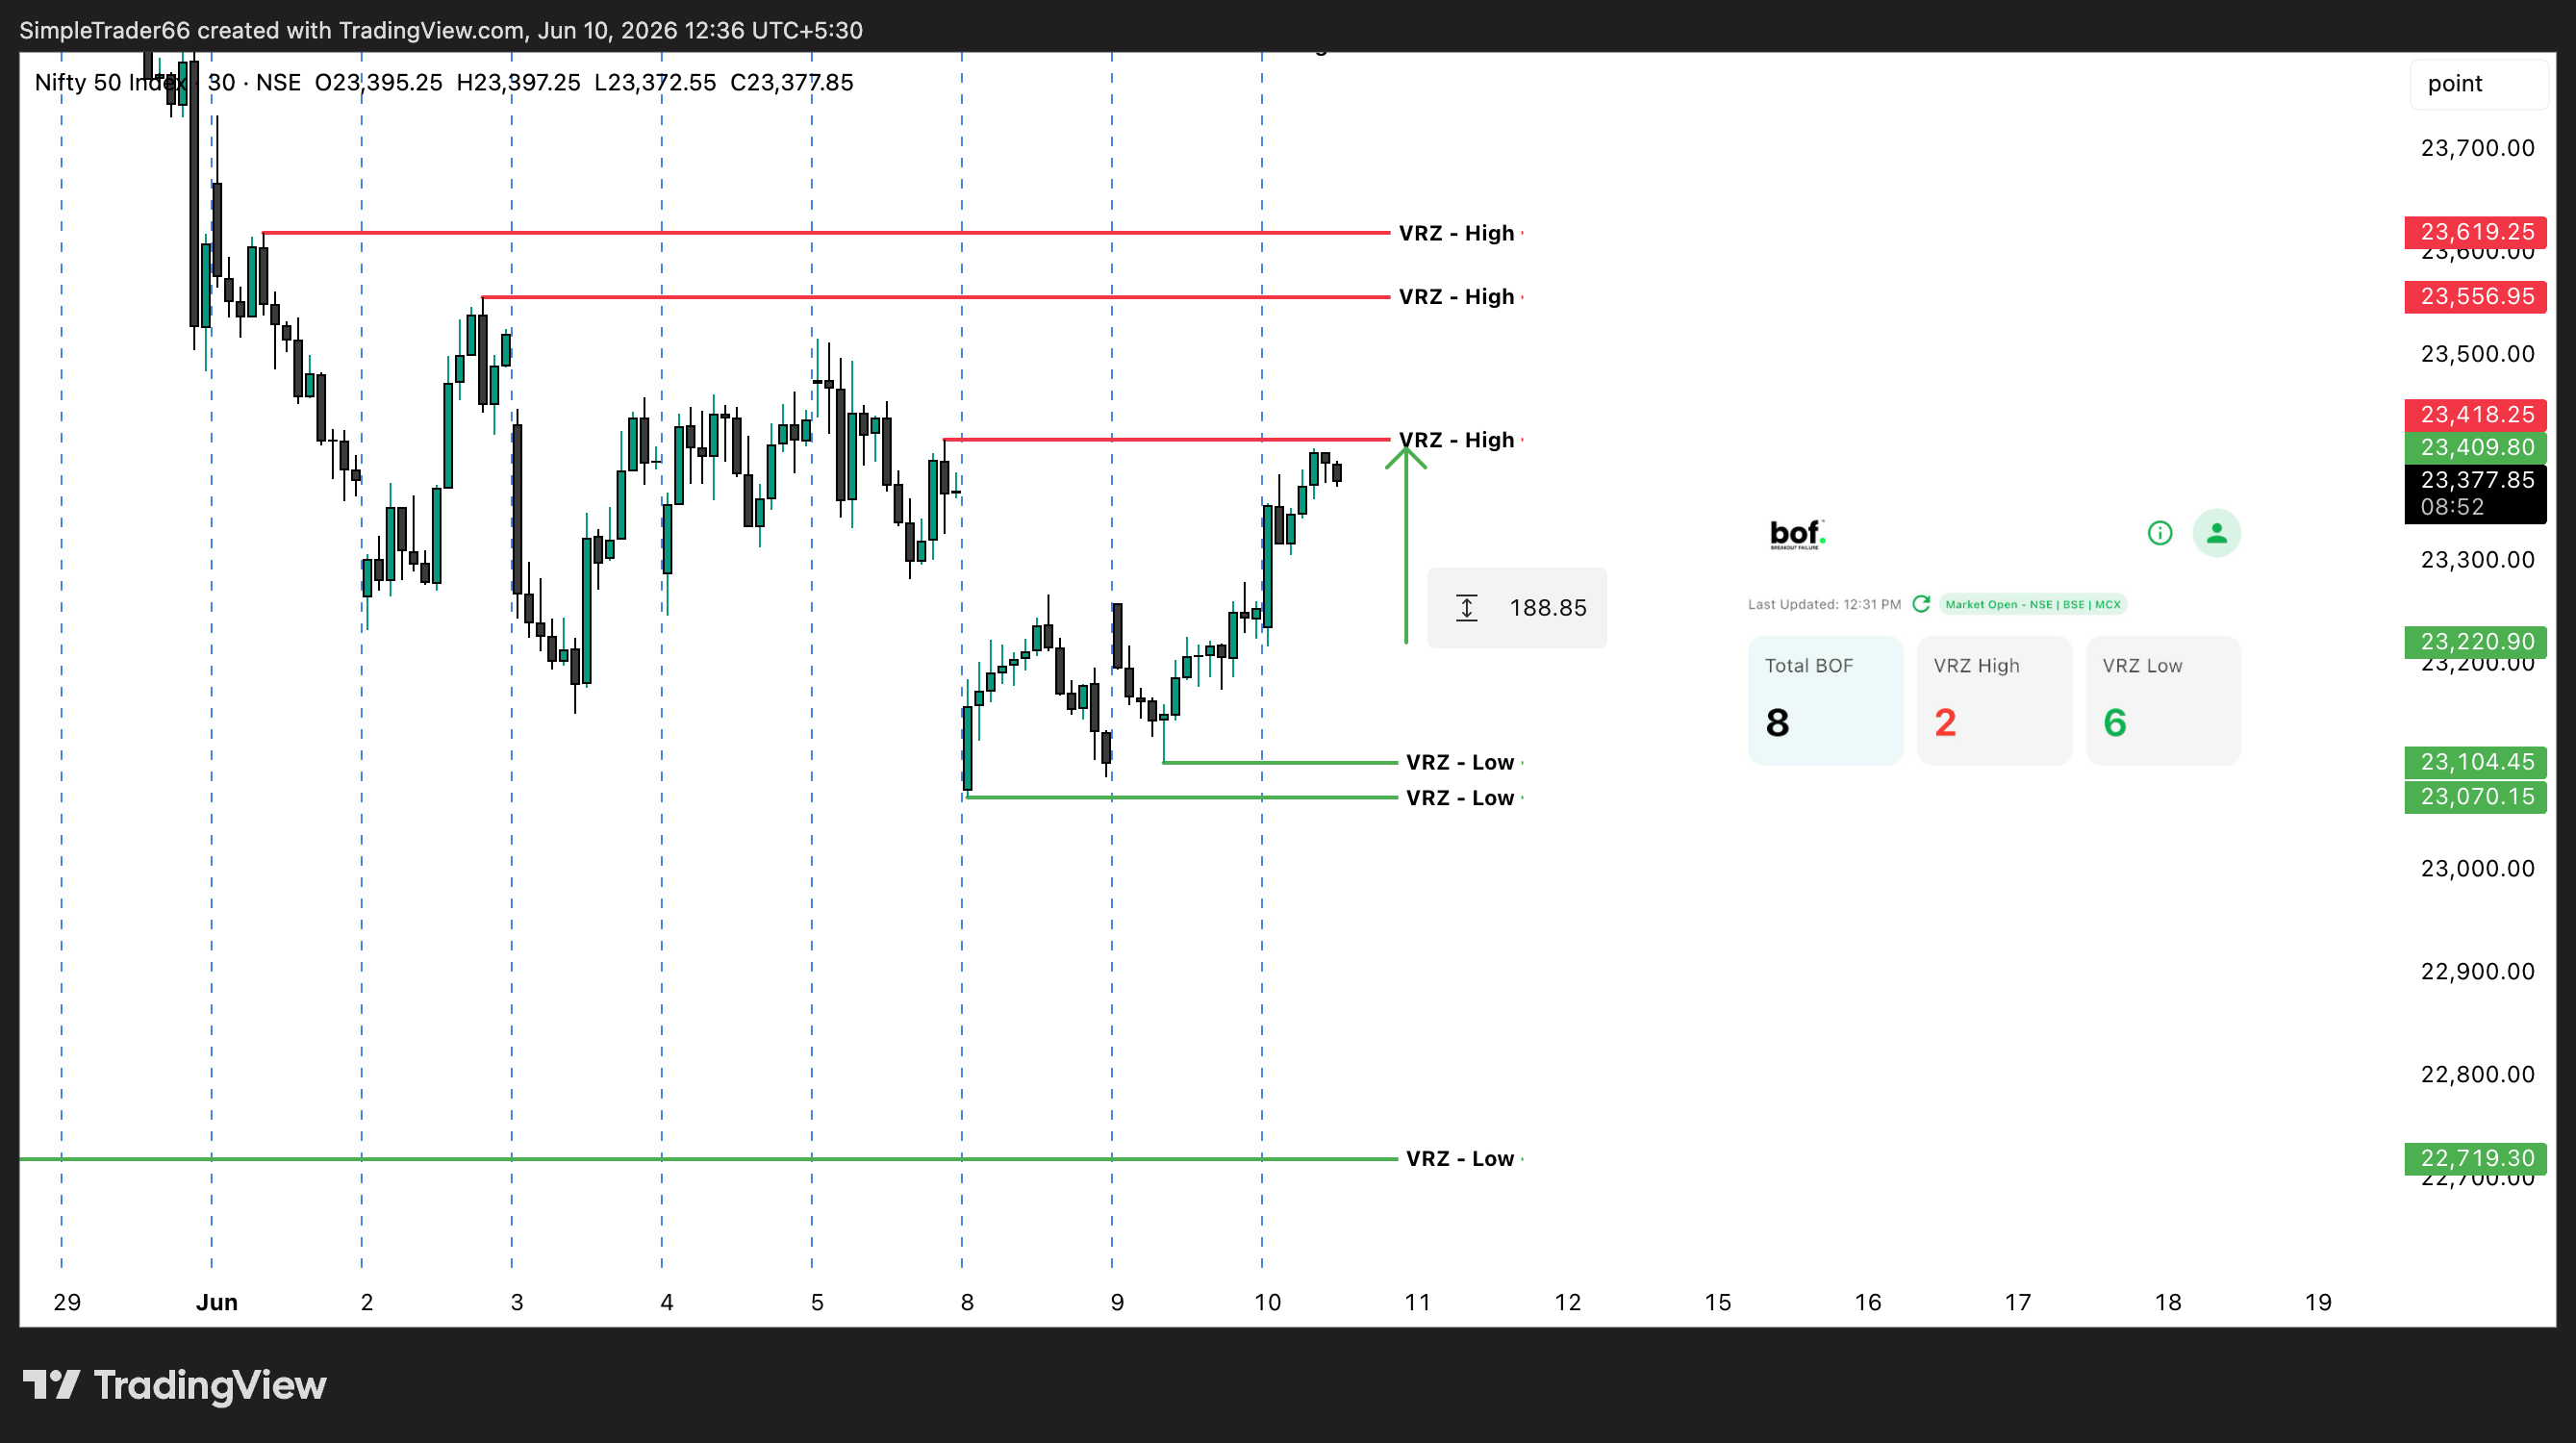
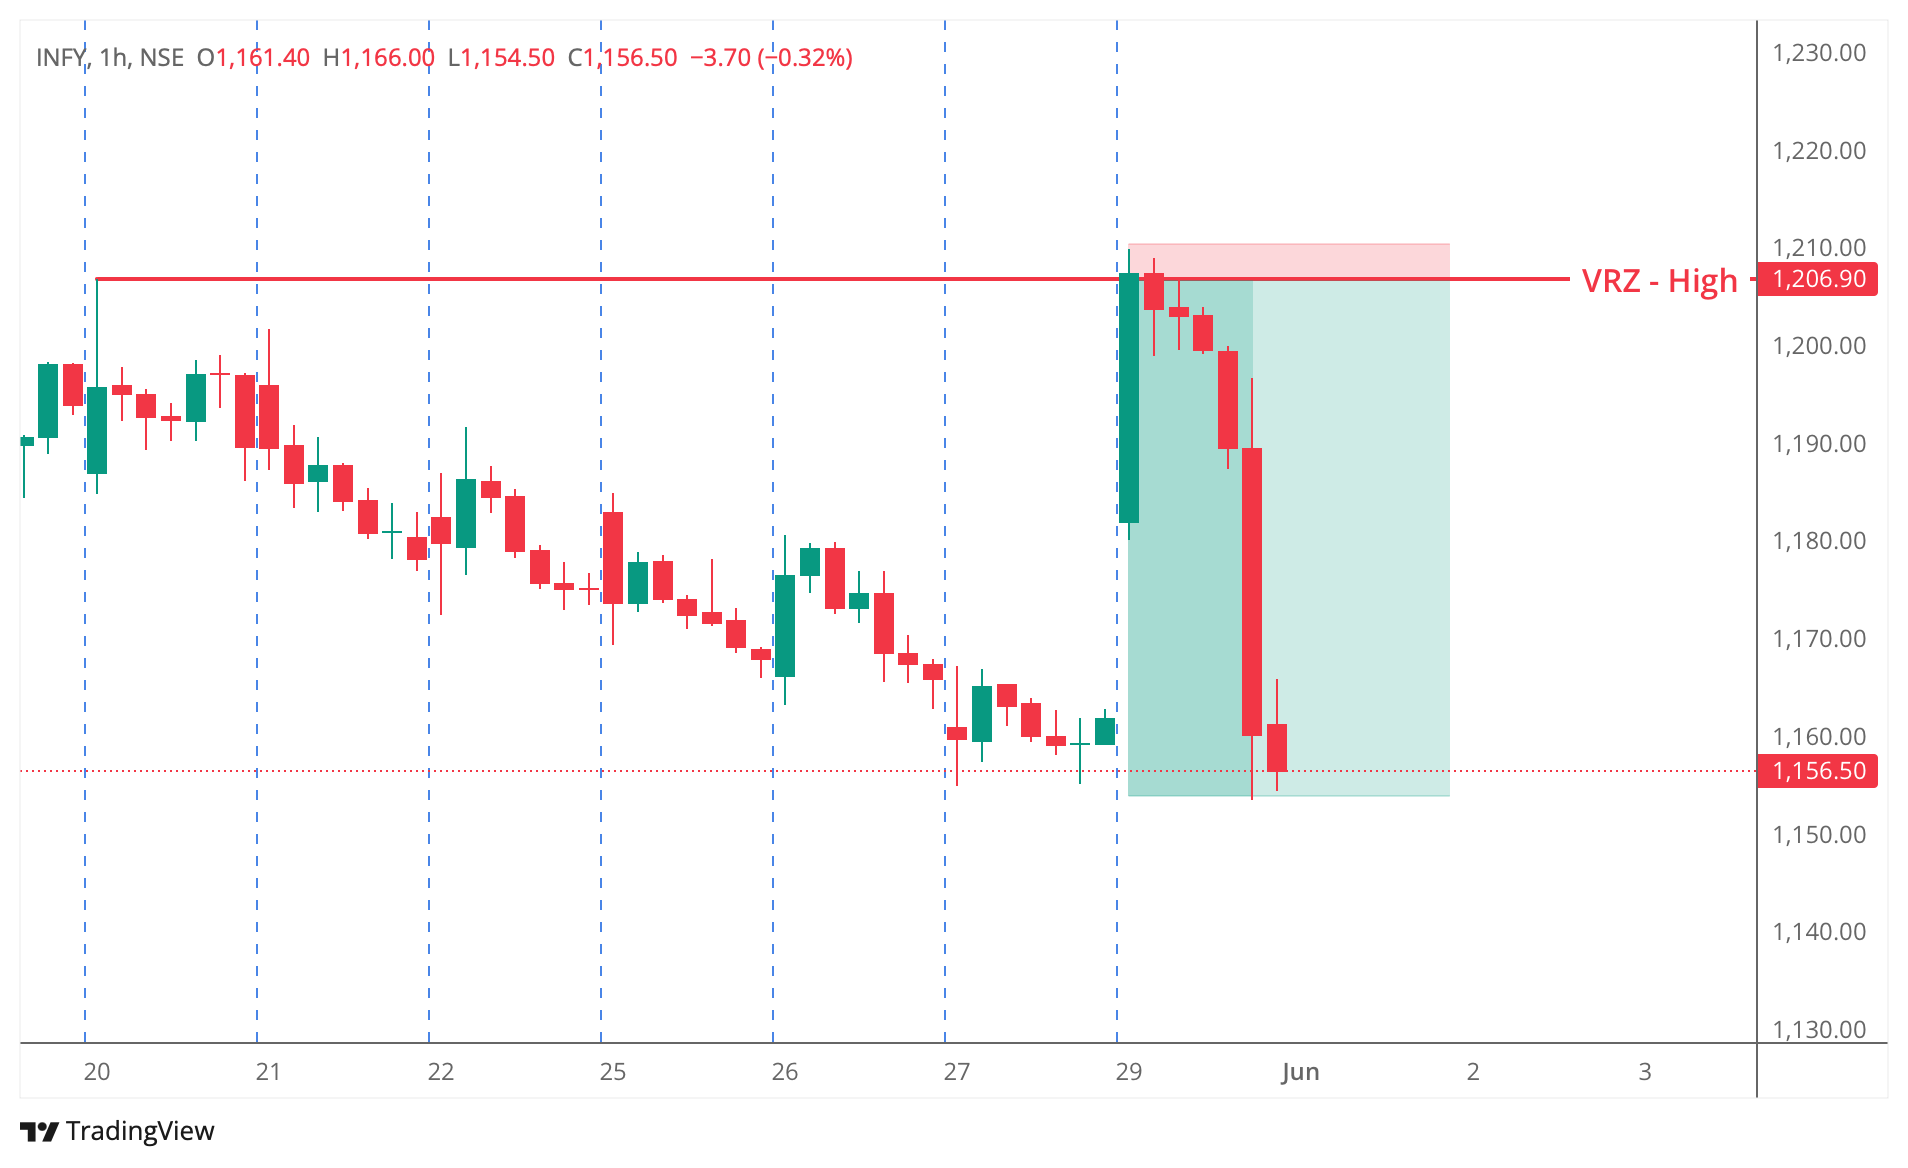
Explore daily BOF Scanner setups with breakout reactions, VRZ High & VRZ Low behavior, and real trade examples from live market conditions. Study intraday and swing trading setups through structured chart analysis, price action behavior, key support and resistance zones, and breakout failure patterns updated daily.