
Select a trading day to view all Scanner results, chart evidence, and market explanations.
3 Scanners Available
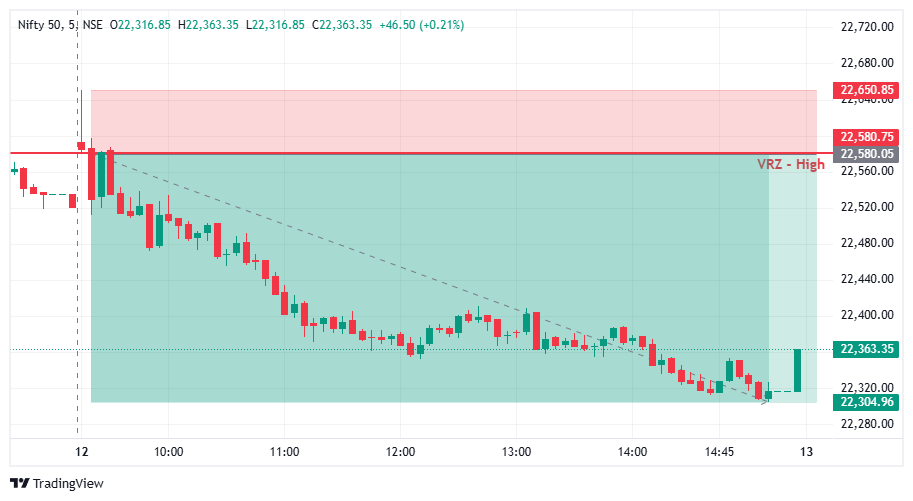

🔎 Nifty 50 opened with a quick push higher and moved straight into the resistance area in the first candles.
⚠️ Price tested the ₹22,580.05 VRZ High, where a breakout looked likely.
🎯 The VRZ High became the key technical reference for spotting a potential bearish Breakout Failure.
📈 Price spiked above the ₹22,580.05 VRZ High and tagged the ₹22,650.85 area, showing a clear attempt by buyers to extend the upside.
🚫 The move above resistance was brief and could not hold.
🔄 Sellers stepped in right at the highs, forming the first base for a bearish reversal.
🎯 Price closed back below the ₹22,580.05 VRZ High, confirming a Bearish Breakout Failure structure.
⚡ The failed breakout showed that buyers had lost control above resistance.
📉 Once the level was lost, short-term momentum shifted decisively toward the sellers.
📉 After the VRZ High rejection, Nifty 50 slid steadily with lower highs and strong red candles.
⚡ Trapped buyers exited and sellers pushed price out of the breakout zone into a broader bearish decline.
💥 The fall extended to around ₹22,304.96, a 1.22% price contraction that confirmed the successful BOF outcome.
🔍 The chart shows an early spike, a brief break above the ₹22,580.05 VRZ High, and a sharp rejection from the resistance area.
🔴 The loss of the zone was the key confirmation for the bearish BOF structure.
📉 Price then travelled down to the ₹22,304.96 area and stayed below the VRZ High for the rest of the session.
🎯 The shift from breakout excitement to bearish expansion was the defining technical event of this setup.
🔎 The main signal was the failed breakout above the ₹22,580.05 VRZ High.
⚡ Buyers pushed price over resistance, but the move lacked sustained follow-through.
🔴 The rejection back below the VRZ High signalled a change in short-term price structure.
📉 Sellers then drove the decline to lower levels, producing the reported 1.22% move.
🔴 VRZ High: ₹22,580.05 served as the primary resistance reference.
🪤 Bull Trap: Buyers could not hold price above the resistance zone.
🛡️ Seller Defense: Sellers responded strongly near the ₹22,650.85 high.
🔄 Bearish Rejection: Price fell back below the key level.
📊 Momentum Shift: Short-term momentum turned bearish after the failed breakout.
🔻 Downside Expansion: Price declined toward the ₹22,304.96 area.
🏆 Trade Outcome: 1.22% downside with 1:4 RR.
🎯 The ₹22,580.05 VRZ High, with the ₹22,650.85 swing high just above it, gave a clearly defined risk reference for the bearish BOF setup.
⚖️ A small, defined risk against a larger downside move produced the 1:4 Risk-to-Reward outcome.
🧠 Structured position sizing, predefined invalidation levels, and disciplined execution matter when trading Breakout Failure setups.

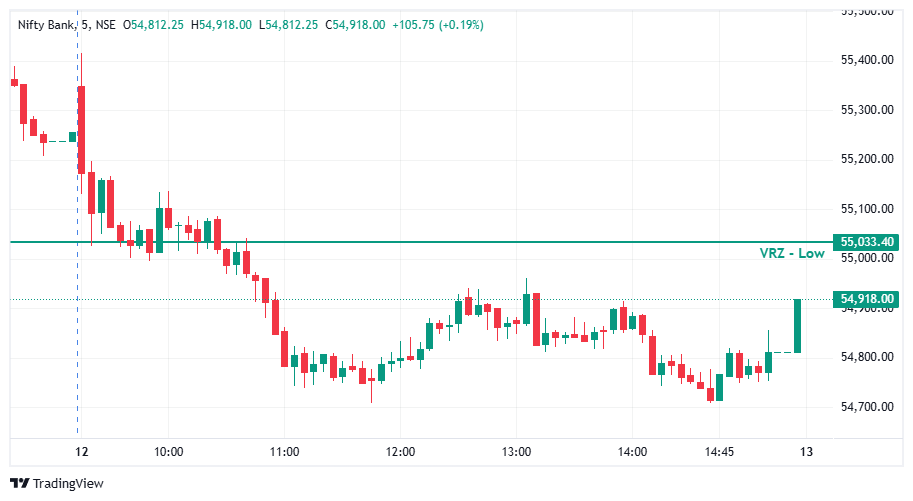

📉 Nifty Bank experienced strong selling pressure during the early session and moved below the 55,033.40 VRZ Low. ⚠️ The breakdown created the possibility of a bullish BOF reversal if buyers could reclaim the key zone. 🔎 However, price remained below the VRZ Low throughout the session, indicating that the expected bullish recovery was not confirmed.
🔻 Following the breakdown, Nifty Bank continued to form lower price levels and maintained a bearish intraday structure. 🧱 Several recovery attempts developed during the afternoon, but buyers struggled to regain the broken VRZ Low. 📉 The inability to reclaim 55,033.40 kept the bullish reversal thesis weak.
🎯 The bullish BOF setup required price to reclaim 55,033.40 and sustain acceptance above the level. 🚫 Instead, the recovery remained below the reference zone. 🔴 Buyers could not convert the broken VRZ Low back into support, preventing a confirmed bullish reversal from developing.
🟥 Bearish candles dominated the major downside moves during the session. 🔄 Although some green candles appeared during the afternoon recovery, they failed to produce a sustained move above the VRZ Low. ⚠️ The final bullish candle pushed price toward 54,918, but the index remained below 55,033.40, leaving the reversal unconfirmed.
🎯 A valid bullish BOF required a clear reclaim and sustained acceptance above 55,033.40. 🚫 Since this confirmation did not occur, the setup lacked the necessary evidence for a reliable bullish entry. 🧭 Waiting for stronger price confirmation would have helped avoid entering against the prevailing bearish structure.
🔐 A breakdown alone does not guarantee a successful bullish reversal. ⚠️ When price repeatedly fails to reclaim the VRZ Low, traders should reassess the original setup rather than assume a recovery will occur. 🛑 Following predefined entry and invalidation rules helps control risk when the expected BOF fails.
👀 The afternoon bounce may have encouraged traders to anticipate a bullish reversal. ⚠️ However, a recovery toward the VRZ Low is not the same as a confirmed reclaim. 🧠 This setup highlights the importance of waiting for buyers to demonstrate sustained strength instead of entering based on anticipation alone.
📍 55,033.40 remained the critical decision level for this Nifty Bank setup. 🔻 Price failed to reclaim the VRZ Low despite several recovery attempts. 🎯 The key lesson is to wait for reclaim + sustained acceptance + bullish follow-through before treating a bullish BOF setup as confirmed.
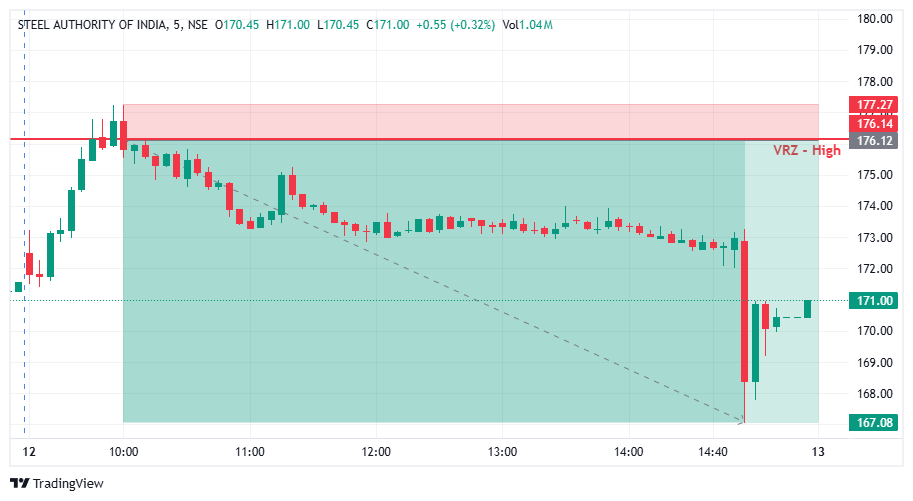

🔎 SAIL moved upward toward the ₹176.14 VRZ High, bringing price into a critical resistance zone.
⚠️ The initial upward movement created the possibility of a bullish breakout, but sustaining price above resistance became difficult.
🎯 The VRZ High served as the key technical reference for identifying a potential bearish Breakout Failure setup.
🚨 Price tested the VRZ High area but failed to maintain bullish momentum above the marked resistance.
🪤 The inability to sustain higher prices indicated weakening buying pressure near the zone.
🔄 Sellers gained control as price moved away from resistance, developing a bearish BOF structure.
🎯 The rejection near the ₹176.14 VRZ High established the basis for a Bearish Breakout Failure setup.
⚡ As price moved lower, bearish momentum strengthened and the intraday price structure shifted toward sellers.
🔻 The developing downside trend reinforced the significance of the resistance rejection.
📉 Following the VRZ High rejection, SAIL continued moving lower throughout much of the session.
🔻 Selling pressure pushed price through lower levels, with a sharp decline visible toward the end of the chart.
📍 Price reached the ₹167.08 area, marking the lower price level shown in the setup.
🏆 The reported trade outcome was a 5.13% downside move with 1:8 RR.
🔍 The chart illustrates a move toward resistance followed by a sustained bearish price structure.
🔴 Resistance Rejection: Price failed to sustain momentum near the VRZ High.
📉 Lower Price Levels: Selling pressure developed after the rejection.
⚡ Bearish Momentum: The decline accelerated during the later part of the session.
🎯 Technical Reference: The ₹176.14 VRZ High provided the key resistance level for evaluating the setup.
🔎 The central feature of this setup was the failure to sustain bullish momentum around the VRZ High.
⚠️ When price could not maintain strength near resistance, selling pressure increased and the market moved lower.
📉 The subsequent bearish price action aligned with the failed breakout structure and extended the downside move.
💡 This setup highlights the importance of observing price acceptance or rejection around predefined resistance zones rather than relying on a breakout attempt alone.
🧭 VRZ High: ₹176.14 acted as the primary resistance reference.
🚨 Failed Breakout: Buyers could not sustain the upward move near resistance.
🔻 Rejection: Selling pressure emerged around the VRZ High.
📉 Bearish Structure: Price moved toward lower levels after the rejection.
⚡ Momentum Expansion: The decline accelerated during the later session.
💰 Risk-to-Reward: The reported trade achieved 1:8 RR.
🏆 Trade Outcome: 5.13% downside move with 1:8 RR.
🎯 The VRZ High provided a clear technical reference for assessing the bearish setup.
⚖️ A 1:8 risk-to-reward ratio represents a potential reward of four units for every unit of defined risk.
🧠 Predefined stop-loss levels, appropriate position sizing, and disciplined trade execution remain essential when trading Breakout Failure patterns.
