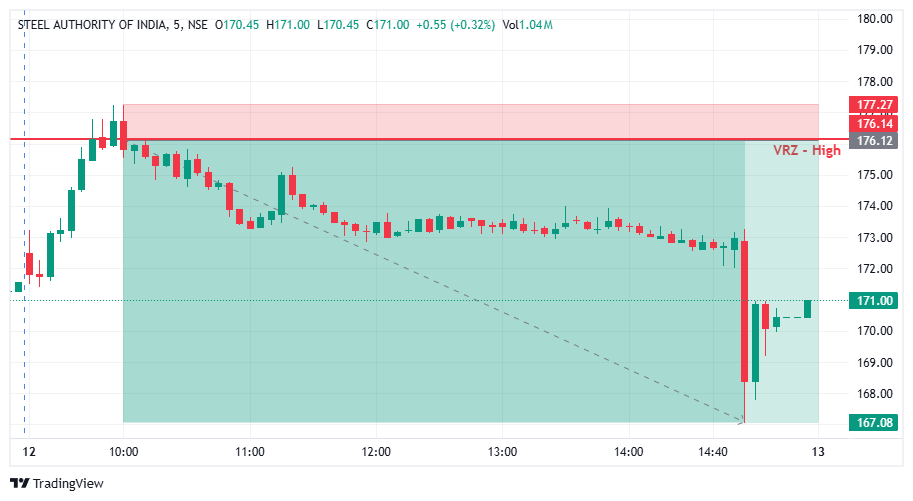

🔎 SAIL moved upward toward the ₹176.14 VRZ High, bringing price into a critical resistance zone.
⚠️ The initial upward movement created the possibility of a bullish breakout, but sustaining price above resistance became difficult.
🎯 The VRZ High served as the key technical reference for identifying a potential bearish Breakout Failure setup.
🚨 Price tested the VRZ High area but failed to maintain bullish momentum above the marked resistance.
🪤 The inability to sustain higher prices indicated weakening buying pressure near the zone.
🔄 Sellers gained control as price moved away from resistance, developing a bearish BOF structure.
🎯 The rejection near the ₹176.14 VRZ High established the basis for a Bearish Breakout Failure setup.
⚡ As price moved lower, bearish momentum strengthened and the intraday price structure shifted toward sellers.
🔻 The developing downside trend reinforced the significance of the resistance rejection.
📉 Following the VRZ High rejection, SAIL continued moving lower throughout much of the session.
🔻 Selling pressure pushed price through lower levels, with a sharp decline visible toward the end of the chart.
📍 Price reached the ₹167.08 area, marking the lower price level shown in the setup.
🏆 The reported trade outcome was a 5.13% downside move with 1:8 RR.
🔍 The chart illustrates a move toward resistance followed by a sustained bearish price structure.
🔴 Resistance Rejection: Price failed to sustain momentum near the VRZ High.
📉 Lower Price Levels: Selling pressure developed after the rejection.
⚡ Bearish Momentum: The decline accelerated during the later part of the session.
🎯 Technical Reference: The ₹176.14 VRZ High provided the key resistance level for evaluating the setup.
🔎 The central feature of this setup was the failure to sustain bullish momentum around the VRZ High.
⚠️ When price could not maintain strength near resistance, selling pressure increased and the market moved lower.
📉 The subsequent bearish price action aligned with the failed breakout structure and extended the downside move.
💡 This setup highlights the importance of observing price acceptance or rejection around predefined resistance zones rather than relying on a breakout attempt alone.
🧭 VRZ High: ₹176.14 acted as the primary resistance reference.
🚨 Failed Breakout: Buyers could not sustain the upward move near resistance.
🔻 Rejection: Selling pressure emerged around the VRZ High.
📉 Bearish Structure: Price moved toward lower levels after the rejection.
⚡ Momentum Expansion: The decline accelerated during the later session.
💰 Risk-to-Reward: The reported trade achieved 1:8 RR.
🏆 Trade Outcome: 5.13% downside move with 1:8 RR.
🎯 The VRZ High provided a clear technical reference for assessing the bearish setup.
⚖️ A 1:8 risk-to-reward ratio represents a potential reward of four units for every unit of defined risk.
🧠 Predefined stop-loss levels, appropriate position sizing, and disciplined trade execution remain essential when trading Breakout Failure patterns.