
Select a trading day to view all Scanner results, chart evidence, and market explanations.
6 Scanners Available
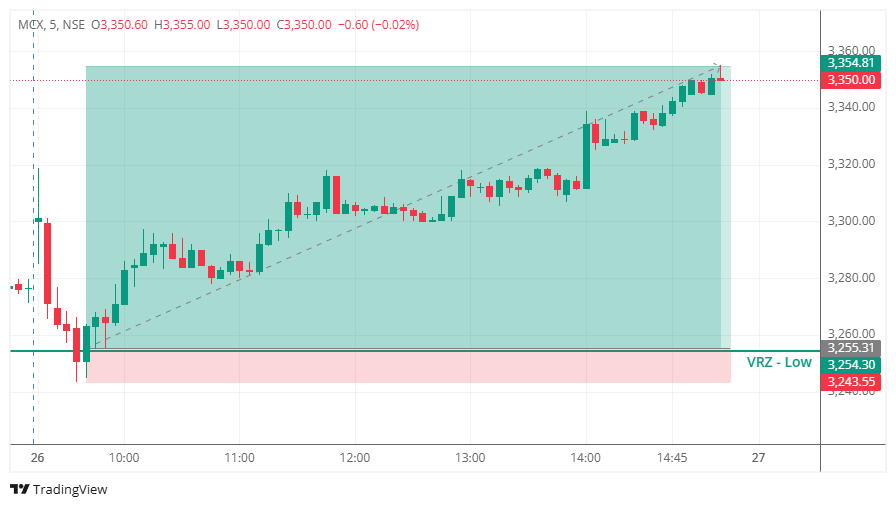

🟢 MCX initially moved lower and tested the ₹3,255.31 VRZ Low.
⚠️ Price briefly broke below the VRZ Low, creating a potential bearish breakdown.
🔄 The breakdown failed as buyers quickly reclaimed the key zone.
📈 Strong bullish momentum followed, with price forming higher highs and higher lows.
🎯 The successful BOF setup eventually carried MCX toward the ₹3,354.81 area.
🚀 The trade delivered a 3.06% upside outcome with an exceptional 1:8 RR.
🔎 Price approached the VRZ Low after an initial period of selling pressure.
🔴 Sellers pushed price below ₹3,255.31, attempting to establish bearish control.
⚠️ The breakdown failed to attract sustained selling.
🟢 Buyers stepped in aggressively and reclaimed the VRZ Low.
🔄 This failed breakdown created the foundation for a bullish BOF setup.
📈 Price then developed a strong upward structure with continued buying pressure.
🎯 Momentum remained positive as MCX advanced toward the projected upside objective.
Initially, traders could have expected:
🔴 A confirmed breakdown below the VRZ Low.
📉 Further downside continuation.
🐻 Sellers to maintain control.
But the market quickly changed the narrative.
⚠️ The breakdown failed.
😰 Breakdown sellers became trapped below the VRZ Low.
🟢 Buyers reclaimed the key zone.
🔄 Trapped sellers were forced to exit as price moved higher.
📈 Fresh buyers joined the reversal, accelerating bullish momentum.
🚀 The shift in market sentiment transformed the failed breakdown into a strong bullish move.
🔴 Sellers attempted to push MCX below the ₹3,255.31 VRZ Low.
🟢 Buyers defended the zone and absorbed the selling pressure.
⚖️ The battle intensified around the key support area.
⚠️ Failure to sustain below the VRZ Low weakened the bearish setup.
🔄 Price reclaimed the zone and confirmed the breakout failure.
📈 Buyers gradually took control and built a sustained bullish structure.
🚀 The combination of trapped sellers and fresh buying pressure powered the upside move.
🎯 VRZ Low Rejection
The ₹3,255.31 VRZ Low acted as a strong demand area where buyers stepped in.
⚡ Breakdown Lost Momentum
Price moved below support but failed to sustain the bearish breakdown.
🚨 Failed Breakdown Confirmed
The quick recovery above the VRZ Low signaled that sellers had lost control.
📈 Buyers Took Command
Higher highs and higher lows confirmed strengthening bullish momentum.
🔒 Defined Risk
The failed breakdown provided a clear invalidation area below the VRZ Low.
💰 Exceptional Reward-to-Risk
The successful bullish BOF delivered a 3.06% upside outcome with a remarkable 1:8 RR.
🔴 Before Rejection: Sellers controlled the initial decline toward the VRZ Low.
⚠️ At the Zone: Price briefly broke below ₹3,255.31, but the breakdown failed.
🟢 After Rejection: Buyers reclaimed the VRZ Low and reversed the bearish momentum.
📈 Confirmation: Higher highs and higher lows established a bullish price structure.
🚀 Final Move: MCX continued higher toward the ₹3,354.81 objective.

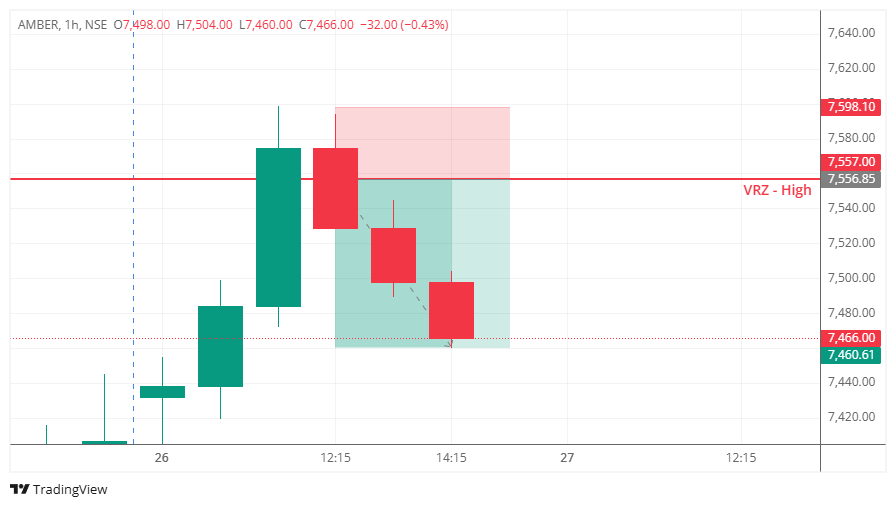

🔺 AMBER moved higher and approached the ₹7,556.85 VRZ High, creating the possibility of a bullish breakout.
⚠️ Price pushed above the VRZ High, but buyers failed to sustain the breakout at higher levels.
🔴 Strong selling pressure emerged near the resistance zone, forcing price back below ₹7,556.85.
📉 The next bearish candles confirmed that the breakout lacked follow-through and sellers were gaining control.
🔄 The failed breakout trapped late buyers and triggered a clear bearish reversal.
🎯 Selling pressure continued toward the downside objective near ₹7,460.61.
🚀 The setup successfully delivered a 1.27% bearish move with a solid 1:2 RR.
🔎 AMBER approached the ₹7,556.85 VRZ High following a strong bullish price move.
🟢 Buyers pushed price into and above the key resistance area.
⚠️ The breakout failed to sustain above the VRZ High.
🔴 Sellers immediately responded with strong bearish candles.
📉 Price moved back below the resistance, confirming the Breakout Failure (BOF).
🔄 Momentum shifted from buyers to sellers as the failed breakout became evident.
🎯 Continued downside pressure carried AMBER toward the projected ₹7,460.61 target zone.
Initially, traders could have expected:
🟢 A confirmed breakout above ₹7,556.85.
📈 Further upside continuation.
🐂 Buyers to maintain control.
But the market quickly changed the narrative.
⚠️ The breakout failed to hold above resistance.
😰 Breakout buyers became trapped at higher levels.
🔴 Sellers entered as price slipped back below the VRZ High.
🔄 Trapped buyers started exiting their positions.
📉 Fresh selling pressure accelerated the bearish move toward the downside objective.
🟢 Buyers attempted to push AMBER beyond ₹7,556.85.
🔴 Sellers defended the VRZ High and rejected higher prices.
⚖️ The battle intensified around the key resistance level.
⚠️ Failure to sustain above the zone weakened bullish momentum.
🔄 The move back below the VRZ High confirmed the breakout failure.
📉 Bearish follow-through gave sellers stronger control over the next candles.
🚀 The combination of trapped buyers and fresh selling pressure drove the downside move.
🎯 VRZ High Rejected
The ₹7,556.85 VRZ High acted as a key resistance area where sellers stepped in.
⚡ Breakout Lost Momentum
Price moved above the resistance but failed to sustain higher levels.
🚨 Sharp Rejection Confirmed
The bearish reversal back below the VRZ High showed that buyers could not maintain control.
📉 Sellers Took Command
Strong bearish candles confirmed the momentum shift from buyers to sellers.
🔒 Defined Invalidation
The ₹7,598.10 area provided a clear invalidation level for the bearish setup.
🎯 Downside Objective Reached
Price moved toward the ₹7,460.61 target zone.
💰 Reward Outpaced Risk
The successful BOF setup delivered a 1.27% downside move with a 1:2 RR.
📈 Before Rejection: Buyers controlled the upward move toward the VRZ High.
⚠️ At the Zone: Price broke above ₹7,556.85, but the breakout failed to sustain.
🔴 After Rejection: Sellers pushed price back below the key resistance.
📉 Confirmation: Consecutive bearish candles strengthened the reversal.
🎯 Final Move: Price continued lower toward the ₹7,460.61 downside objective.
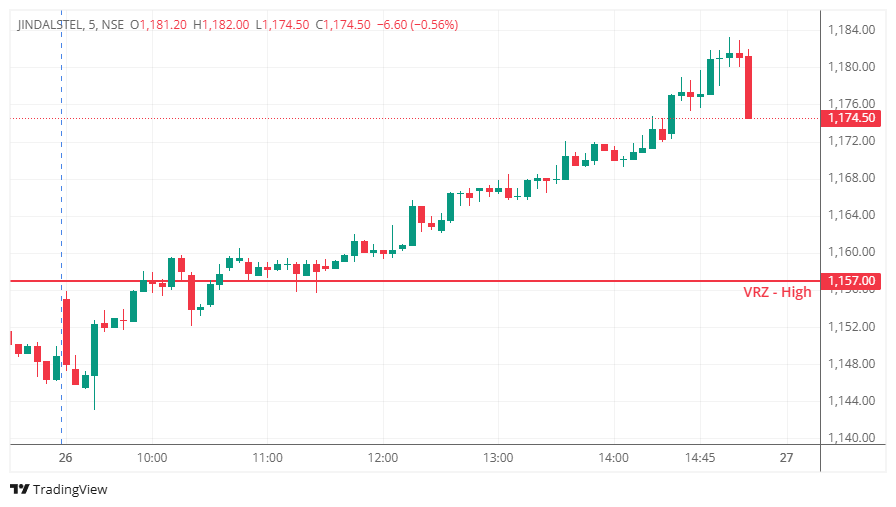

JINDALSTEL approached the ₹1,157 VRZ High during the session and initially showed signs of hesitation around the resistance zone.
The price action created the possibility of a bearish BOF setup, where a breakout above the VRZ High could fail and lead to a downside reversal.
However, the expected rejection did not develop.
Instead, buyers maintained control and pushed price above the ₹1,157 VRZ High, followed by continued bullish movement.
The intraday structure showed increasing bullish strength as price moved through the reversal zone.
📈 Price approached and crossed the ₹1,157 VRZ High.
🟢 Buyers maintained control above the resistance area.
⚠️ The expected rejection below the VRZ did not occur.
🚀 Price continued higher after breaking above the zone.
📍 The market established acceptance above the ₹1,157 VRZ High.
The inability to reject the zone kept the bearish BOF thesis invalid.
The potential bearish BOF setup developed as JINDALSTEL tested and moved above the VRZ High at ₹1,157.
Although the price action initially created the possibility of a breakout failure, sellers failed to push price back below the reversal zone.
Instead, buyers sustained the breakout and extended the move toward higher levels.
As the required BOF confirmation never appeared, the bearish setup was invalidated before entry.
The BOF setup failed because sellers could not establish control below the ₹1,157 VRZ High.
❌ No confirmed rejection from the VRZ High.
❌ Price sustained above ₹1,157.
❌ Buyers continued defending higher levels.
❌ Selling pressure failed to create downside follow-through.
❌ Bullish momentum strengthened after the breakout.
❌ Price moved away from the reversal zone instead of failing back below it.
These signals reduced the probability of a successful bearish BOF reversal.
The chart demonstrates a potential bearish BOF attempt that failed to produce a confirmed rejection from the VRZ High.
🟢 Buyers pushed price through the resistance zone.
📈 Price established acceptance above ₹1,157.
⚡ Bullish momentum continued after the breakout.
⚠️ Sellers failed to bring price back below the reversal zone.
🚀 The move extended toward the ₹1,180+ area.
This highlights why a resistance test alone is not sufficient confirmation for a bearish BOF trade.
⚠️ A resistance breakout does not automatically become a BOF.
📉 For a bearish BOF, price needs to reject the VRZ High and establish acceptance back below the zone.
🔎 Sustained trading above the reversal level indicates stronger buyer participation.
🛡️ Avoiding an unconfirmed setup helps protect trading capital.
🎯 Confirmed price action is more reliable than entering based on anticipation.
This JINDALSTEL setup highlights the importance of remaining disciplined when price action does not confirm the expected reversal.
✅ Every potential BOF setup has a probability of failure.
✅ A resistance test does not guarantee a reversal.
✅ Strong acceptance above the VRZ can invalidate the bearish thesis.
✅ Traders should follow the predefined process instead of forcing an entry.
Professional traders focus on confirmation, risk control, and consistency across multiple trades.
Effective risk management remains essential when trading BOF setups.
✔️ The setup was monitored around the predefined ₹1,157 VRZ High.
✔️ The bearish scenario required rejection and confirmation.
✔️ No premature short entry was triggered.
✔️ The invalidated setup prevented unnecessary risk exposure.
✔️ Capital remained available for future high-probability opportunities.
Avoiding low-confidence trades is also a form of disciplined risk management.
🌍 Markets constantly test patience, discipline, and risk management.
⚠️ This JINDALSTEL BOF Failure demonstrates that a resistance test is not enough to confirm a bearish reversal. Sellers needed to push price back below the ₹1,157 VRZ High to establish stronger BOF confirmation.
📈 Instead, price sustained above the zone and continued higher, showing that buyers remained in control.
🛡️ Professional traders focus on protecting capital, respecting predefined rules, and relying on price confirmation—not anticipation—to guide every trading decision.
💪 Trust your process, manage risk wisely, and recognize when the market invalidates the setup.
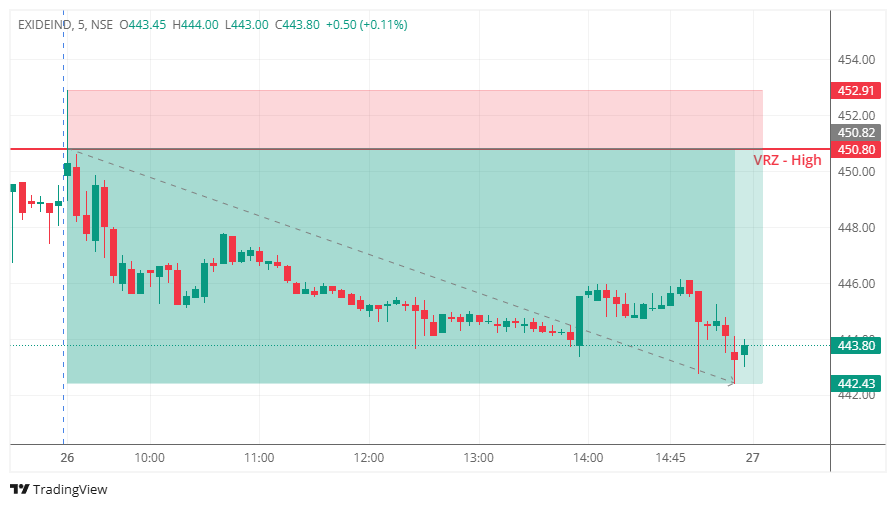

🚀 EXIDEIND tested the VRZ High around ₹450.80 as buyers attempted to push above resistance.
📈 The initial move toward the zone suggested a possible bullish breakout.
❌ However, price failed to sustain above the resistance.
🔴 Sellers stepped in and pushed price lower from the VRZ High.
📉 The stock then developed a sustained bearish structure as selling pressure increased.
✅ This confirmed a classic Breakout Failure (BOF) setup.
💥 The failed breakout eventually delivered a 1.86% downside move with a strong 1:4 RR.
🔍 Price initially moved upward toward the ₹450.80 resistance.
📈 Buyers attempted to maintain control near the VRZ High.
⚠️ The breakout lacked sufficient follow-through.
🔻 Price rejected the resistance and started moving lower.
📉 A series of lower highs and lower lows reflected increasing seller dominance.
🎯 The bearish momentum continued and completed the planned BOF move.
Initially, traders could have expected:
🚀 A breakout above ₹450.80.
📈 Further upside continuation.
🐂 Buyers to maintain control.
But the market shifted:
⚠️ The breakout failed.
😮 Breakout buyers became trapped near the VRZ High.
🔴 Sellers regained control.
📉 Long positions came under pressure as price moved lower.
💥 The change in sentiment helped accelerate the bearish move.
🟢 Buyers attempted to push EXIDEIND through the VRZ High.
🔴 Sellers strongly defended the ₹450.80 resistance.
⚖️ Failure to sustain above the zone weakened buyer conviction.
🔄 Trapped breakout buyers began exiting their positions.
📉 Fresh selling pressure strengthened the downside momentum.
🏆 The buyer-to-seller shift resulted in a successful bearish BOF trade.
🛡️ VRZ High Resistance Held Strong
The ₹450.80 VRZ High created strong selling pressure and rejected the breakout attempt.
⚠️ Breakout Failed to Sustain
Price moved above resistance but failed to hold, trapping breakout buyers.
🔴 Clear Bearish Rejection
Strong rejection from the VRZ High shifted momentum in favor of sellers.
📉 Bearish Structure Developed
Lower highs and lower lows confirmed continued downside pressure.
🏆 Successful Trade Execution
The setup delivered a 1.86% downside move with a 1:4 RR.
🎯 Confirm the Breakout
A temporary move above resistance does not guarantee continuation.
👀 Study Resistance Reactions
Sharp rejection around the VRZ High can reveal strong seller participation.
🚫 Avoid Chasing Breakouts
Waiting for confirmation helps identify failed breakout opportunities.
📉 Follow the Price Structure
Lower highs and lower lows can strengthen bearish BOF confirmation.
⚡ Trapped Buyers Add Selling Pressure
Failed breakouts can force buyers to exit, supporting further downside.
⚖️ Keep Risk Clearly Defined
A predefined invalidation level helps maintain disciplined trade execution.
📍 Identify and mark the VRZ High before price reaches the zone.
👀 Observe price action closely as it approaches the resistance area.
⚠️ Never assume a breakout will automatically continue higher.
🚨 Wait for strong rejection followed by clear bearish confirmation.
📉 Confirm the shift with lower highs and lower lows.
🔒 Define the invalidation level before taking the trade.
⚖️ Maintain strict risk management and disciplined execution throughout.

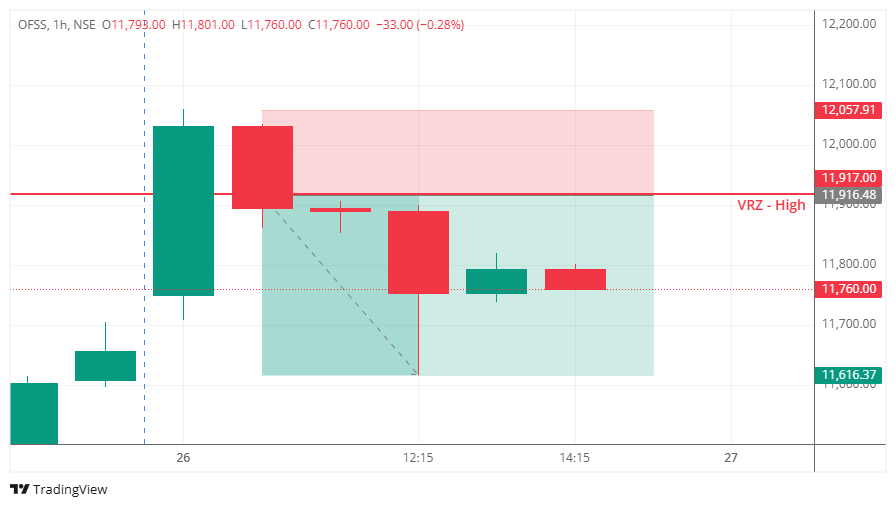

📈 OFSS moved sharply higher and approached the ₹11,917.00 VRZ High.
🟢 Buyers attempted to sustain the move above the resistance zone.
⚠️ However, the breakout failed to attract continued buying interest.
🔴 Sellers emerged aggressively around the VRZ High and pushed price back below resistance.
📉 Subsequent 1-hour candles confirmed growing bearish pressure.
🔄 The failed breakout trapped buyers near the highs and shifted short-term momentum toward the downside.
🎯 Price continued lower toward the projected target, producing a 2.52% downside move with a 1:2 RR.
🔎 Price approached the VRZ High following a strong bullish move.
📈 Buyers initially maintained control and pushed price toward the resistance.
🚨 The move above ₹11,917.00 failed to receive sustained follow-through.
🔴 Selling pressure appeared near the breakout zone.
📉 Price reversed below the VRZ High as bearish candles developed.
⚡ Momentum gradually shifted from buyers to sellers.
🎯 Continued downside pressure completed the successful BOF move.
Initially, traders could have expected:
🟢 A sustained breakout above ₹11,917.00.
📈 Further upside continuation.
🐂 Buyers to remain dominant.
But the market narrative quickly changed.
⚠️ The breakout could not hold.
😰 Late breakout buyers became trapped near the resistance.
🔴 Sellers used the failed breakout to regain control.
🔄 Price slipped back below the VRZ High.
📉 As bullish confidence weakened, bearish momentum accelerated.
🟢 Buyers pushed aggressively toward the VRZ High.
🔴 Sellers defended the ₹11,917.00 resistance zone.
⚖️ The failed breakout weakened buyer conviction.
🚪 Trapped buyers began exiting as price moved back below resistance.
📉 Fresh sellers entered once bearish confirmation appeared.
🚀 The combination of trapped buyers and fresh selling pressure strengthened the downside move.
🔹 Major Resistance Reaction
₹11,917.00 acted as a clear decision zone where selling pressure emerged.
🔹 Unsustained Breakout
Price moved around/above the VRZ High but failed to maintain the breakout.
🔹 Bearish Reversal Confirmation
The return below resistance provided confirmation that buyers were losing control.
🔹 Strong Seller Participation
Follow-through selling pushed price progressively lower after the rejection.
🔹 Clear Risk Structure
The failed breakout created a logical invalidation area above the resistance.
🔹 Attractive Trade Potential
The setup ultimately generated a 2.52% downside move with a 1:2 RR.
📈 Bullish Phase: Price advanced strongly toward the VRZ High.
⚠️ Decision Phase: Buyers attempted to push through ₹11,917.00.
🚨 Failure Phase: The breakout could not sustain above resistance.
🔴 Bearish Phase: Sellers reclaimed control and pushed price lower.
🎯 Target Phase: Downside momentum carried OFSS toward the projected objective.
🎯 Respect Established VRZ Levels
Predefined resistance zones can become important areas for identifying failed breakouts.
🔍 Look Beyond the Initial Breakout
A temporary move above resistance does not guarantee continuation.
⚠️ Wait for Rejection
Clear rejection and a move back below the zone can provide stronger BOF confirmation.
📉 Track Momentum After Failure
Increasing selling pressure following a failed breakout can strengthen the bearish setup.
🛡️ Keep Risk Defined
A clear invalidation level helps maintain disciplined trade execution.
💰 Let Risk-Reward Guide the Trade
A controlled-risk setup can offer a favorable opportunity when price confirms the expected reversal.
✅ Mark the VRZ High before the setup develops.
✅ Observe price behavior closely around the resistance zone.
✅ Do not assume every breakout will continue.
✅ Wait for rejection and bearish confirmation.
✅ Watch for trapped breakout buyers.
✅ Define the invalidation level before entering.
✅ Maintain disciplined risk management throughout the trade.
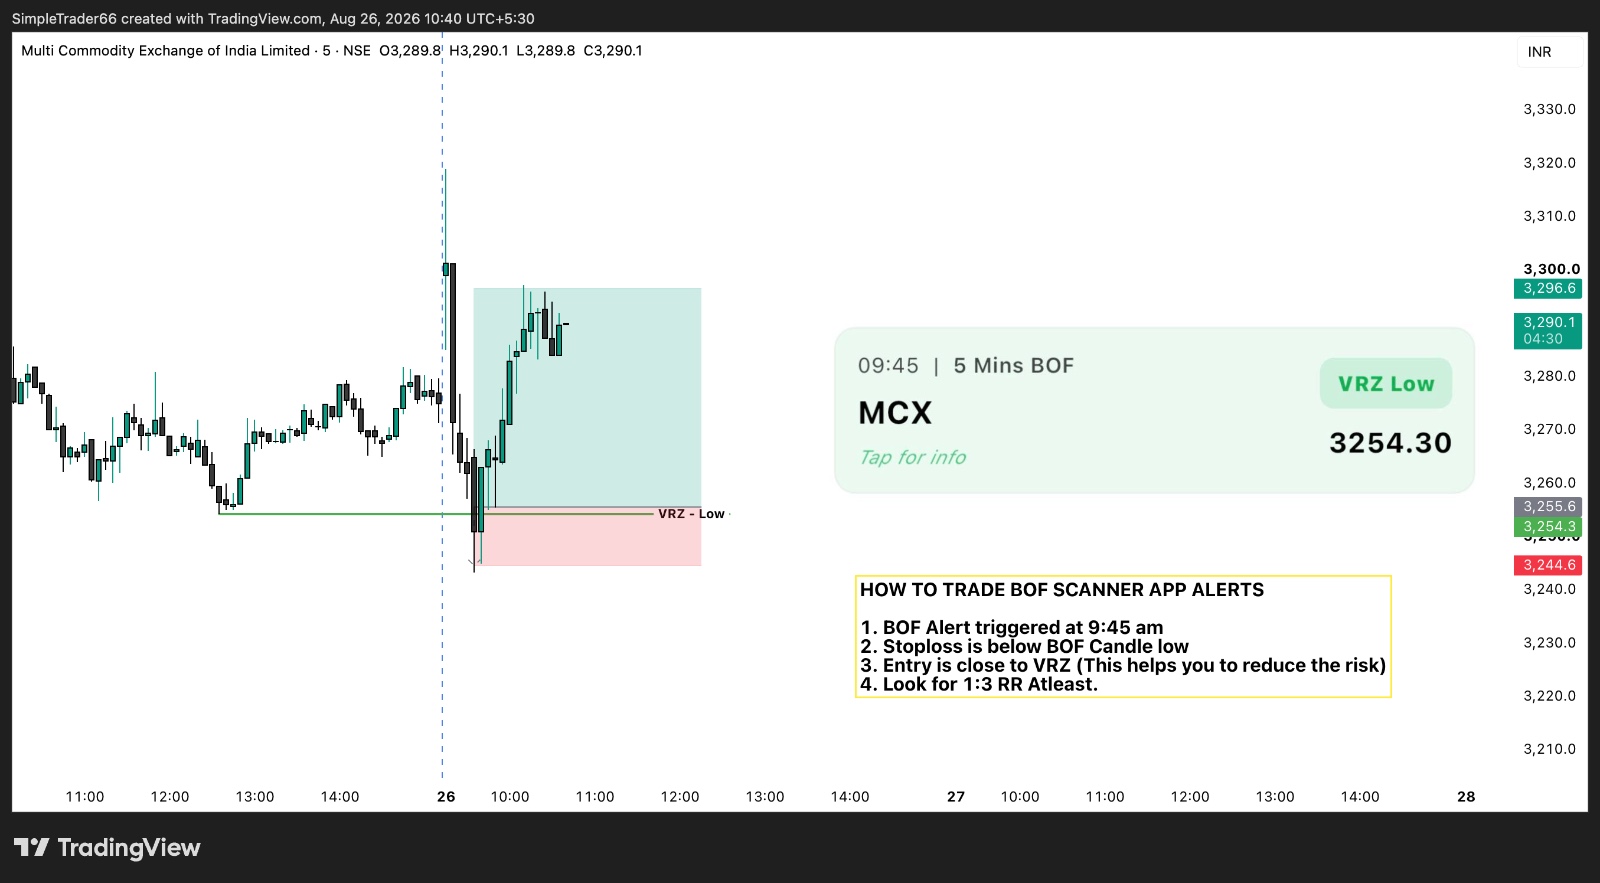
The BOF Scanner helps identify potential Breakout Failure (BOF) setups by highlighting important price levels and reversal opportunities. In this example, the setup begins with a 09:45 AM BOF Scanner alert on the MCX 5-minute chart and progresses into an options trade that reaches a 1:3+ Risk-to-Reward level.
Here’s the complete chart-by-chart breakdown 👇

The first chart shows the MCX 5-minute price chart with a 09:45 AM BOF Scanner alert.
The key reference level on the chart is the VRZ Low at ₹3,254.30.
Price moves down toward and below the VRZ Low. Instead of continuing lower, price quickly reverses and moves back above the level.
This creates the Breakout Failure (BOF) setup. 🔄📈
The scanner generates the alert at:
⏰ 09:45 AM | 5 Mins BOF
The chart identifies:
📍 VRZ Low: ₹3,254.30
This is the key level around which the setup develops.
After the BOF formation, price begins a strong recovery and moves toward the ₹3,290–₹3,300 zone. 🚀
The first chart establishes the trade idea: the BOF Scanner identifies a failed breakdown around the VRZ Low, creating a structured setup with a defined entry area and stop-loss.

Once the underlying MCX setup develops, the second chart shows the corresponding MCX 29 Sep 2026 3250 CE on a 5-minute chart.
The option initially experiences a sharp decline before producing a strong reversal.
Following the BOF-based move, the option price climbs from the lower zone toward the ₹150 area and above. 📈
The chart shows:
Risk = ₹6 per unit
For 225 quantity:
225 × ₹6 = ₹1,350
The chart shows:
Reward so far = ₹22 per unit
For 225 quantity:
225 × ₹22 = ₹4,950
This means the reward shown on the chart is substantially higher than the calculated initial risk. 💰
The second chart demonstrates how the BOF setup translated into an options trade. The chart records ₹6 of risk per unit against ₹22 of reward per unit, producing a strong Risk-to-Reward outcome.

The third chart returns to the MCX 29 Sep 2026 5-minute chart and shows the underlying price movement following the BOF setup.
The chart shows price moving upward from the trade area toward ₹3,308.40, with the upper level marked around ₹3,315.50. 🚀
The chart calculates:
Risk points/lot = 13
With one lot containing 225 Qty:
13 × 225 = ₹2,925
The chart shows:
Reward points so far/lot = 40
For 225 quantity:
40 × 225 = ₹9,000
The third chart clearly states:
The calculation is:
40 ÷ 13 ≈ 3.08
So, based on the figures displayed on the chart, the trade has crossed the 1:3 Risk-to-Reward milestone. 🎯
🔴 Risk: ₹2,925
🟢 Reward: ₹9,000
📊 Risk-to-Reward: Approximately 1:3.08
This means the reward shown so far is more than three times the defined risk.
Here’s the complete setup in simple steps:
The BOF Scanner detects a setup at 09:45 AM on the 5-minute MCX chart.
📍 VRZ Low = ₹3,254.30
Price fails to sustain the breakdown and reverses back above the VRZ Low.
The setup uses the VRZ area as the entry reference.
🛑 The stop-loss is positioned below the BOF candle low, keeping the risk clearly defined.
📈 The trading plan aims for at least 1:3 Risk-to-Reward.
The setup is reflected in the MCX 29 Sep 2026 3250 CE.
📦 1 Lot = 225 Qty
The chart records:
🔴 Risk = ₹6/unit
🟢 Reward so far = ₹22/unit
💰 Total Risk = ₹1,350
💰 Total Reward = ₹4,950
The MCX chart shows the underlying price moving higher.
🔴 Risk = 13 points
🟢 Reward achieved = 40 points
📦 Quantity = 225
🔴 Risk = ₹2,925
🟢 Reward = ₹9,000
The reward reaches approximately 3.08 times the defined risk.
🎯 1:3 RR Achieved Already
This trade example demonstrates how a BOF Scanner alert can be followed through a structured trading process.
The setup begins with a 09:45 AM BOF alert on the MCX 5-minute chart, where price fails to sustain a breakdown around the VRZ Low of ₹3,254.30. The reversal provides the basis for the trade, with the entry positioned close to the VRZ level and the stop-loss placed below the BOF candle low.
The setup is then reflected in the MCX 29 Sep 2026 3250 CE. With 225 quantity per lot, the chart records a risk of ₹6 per unit and a reward of ₹22 per unit.
This results in:
🔴 Total Risk = ₹1,350
🟢 Total Reward = ₹4,950
The third chart shows the underlying MCX move in greater detail. The setup carries 13 points of risk and reaches 40 points of reward.
For 225 quantity:
🔴 Risk = ₹2,925
🟢 Reward = ₹9,000
That puts the trade at approximately 1:3.08 Risk-to-Reward, meaning the 1:3 RR milestone has already been achieved based on the figures displayed in the chart. 🎯🔥