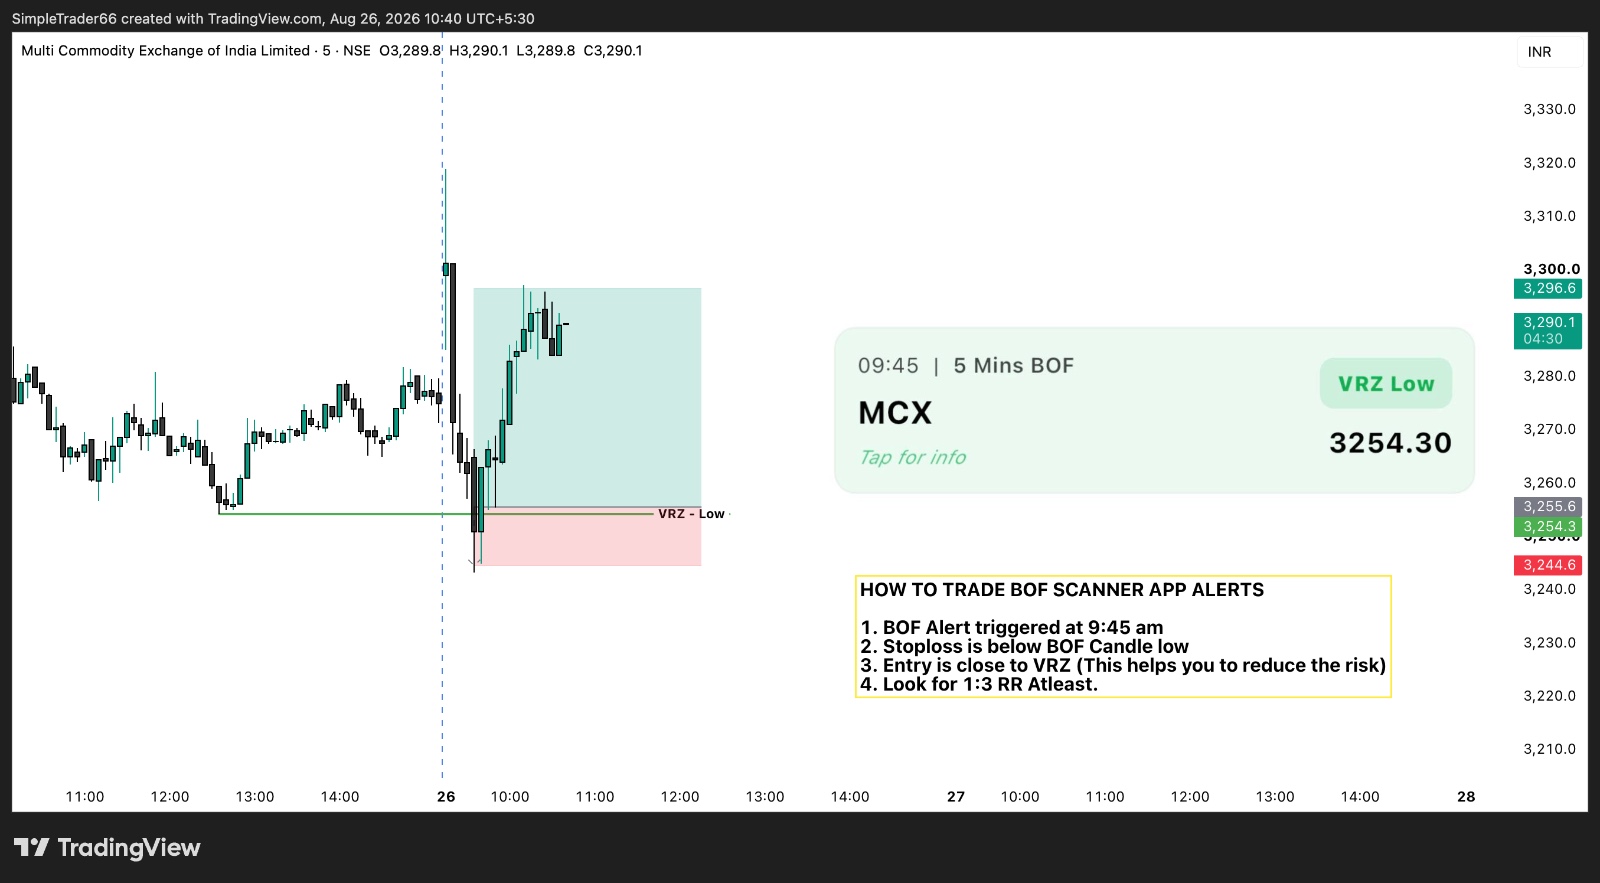
The BOF Scanner helps identify potential Breakout Failure (BOF) setups by highlighting important price levels and reversal opportunities. In this example, the setup begins with a 09:45 AM BOF Scanner alert on the MCX 5-minute chart and progresses into an options trade that reaches a 1:3+ Risk-to-Reward level.
Here’s the complete chart-by-chart breakdown 👇

The first chart shows the MCX 5-minute price chart with a 09:45 AM BOF Scanner alert.
The key reference level on the chart is the VRZ Low at ₹3,254.30.
Price moves down toward and below the VRZ Low. Instead of continuing lower, price quickly reverses and moves back above the level.
This creates the Breakout Failure (BOF) setup. 🔄📈
The scanner generates the alert at:
⏰ 09:45 AM | 5 Mins BOF
The chart identifies:
📍 VRZ Low: ₹3,254.30
This is the key level around which the setup develops.
After the BOF formation, price begins a strong recovery and moves toward the ₹3,290–₹3,300 zone. 🚀
The first chart establishes the trade idea: the BOF Scanner identifies a failed breakdown around the VRZ Low, creating a structured setup with a defined entry area and stop-loss.

Once the underlying MCX setup develops, the second chart shows the corresponding MCX 29 Sep 2026 3250 CE on a 5-minute chart.
The option initially experiences a sharp decline before producing a strong reversal.
Following the BOF-based move, the option price climbs from the lower zone toward the ₹150 area and above. 📈
The chart shows:
Risk = ₹6 per unit
For 225 quantity:
225 × ₹6 = ₹1,350
The chart shows:
Reward so far = ₹22 per unit
For 225 quantity:
225 × ₹22 = ₹4,950
This means the reward shown on the chart is substantially higher than the calculated initial risk. 💰
The second chart demonstrates how the BOF setup translated into an options trade. The chart records ₹6 of risk per unit against ₹22 of reward per unit, producing a strong Risk-to-Reward outcome.

The third chart returns to the MCX 29 Sep 2026 5-minute chart and shows the underlying price movement following the BOF setup.
The chart shows price moving upward from the trade area toward ₹3,308.40, with the upper level marked around ₹3,315.50. 🚀
The chart calculates:
Risk points/lot = 13
With one lot containing 225 Qty:
13 × 225 = ₹2,925
The chart shows:
Reward points so far/lot = 40
For 225 quantity:
40 × 225 = ₹9,000
The third chart clearly states:
The calculation is:
40 ÷ 13 ≈ 3.08
So, based on the figures displayed on the chart, the trade has crossed the 1:3 Risk-to-Reward milestone. 🎯
🔴 Risk: ₹2,925
🟢 Reward: ₹9,000
📊 Risk-to-Reward: Approximately 1:3.08
This means the reward shown so far is more than three times the defined risk.
Here’s the complete setup in simple steps:
The BOF Scanner detects a setup at 09:45 AM on the 5-minute MCX chart.
📍 VRZ Low = ₹3,254.30
Price fails to sustain the breakdown and reverses back above the VRZ Low.
The setup uses the VRZ area as the entry reference.
🛑 The stop-loss is positioned below the BOF candle low, keeping the risk clearly defined.
📈 The trading plan aims for at least 1:3 Risk-to-Reward.
The setup is reflected in the MCX 29 Sep 2026 3250 CE.
📦 1 Lot = 225 Qty
The chart records:
🔴 Risk = ₹6/unit
🟢 Reward so far = ₹22/unit
💰 Total Risk = ₹1,350
💰 Total Reward = ₹4,950
The MCX chart shows the underlying price moving higher.
🔴 Risk = 13 points
🟢 Reward achieved = 40 points
📦 Quantity = 225
🔴 Risk = ₹2,925
🟢 Reward = ₹9,000
The reward reaches approximately 3.08 times the defined risk.
🎯 1:3 RR Achieved Already
This trade example demonstrates how a BOF Scanner alert can be followed through a structured trading process.
The setup begins with a 09:45 AM BOF alert on the MCX 5-minute chart, where price fails to sustain a breakdown around the VRZ Low of ₹3,254.30. The reversal provides the basis for the trade, with the entry positioned close to the VRZ level and the stop-loss placed below the BOF candle low.
The setup is then reflected in the MCX 29 Sep 2026 3250 CE. With 225 quantity per lot, the chart records a risk of ₹6 per unit and a reward of ₹22 per unit.
This results in:
🔴 Total Risk = ₹1,350
🟢 Total Reward = ₹4,950
The third chart shows the underlying MCX move in greater detail. The setup carries 13 points of risk and reaches 40 points of reward.
For 225 quantity:
🔴 Risk = ₹2,925
🟢 Reward = ₹9,000
That puts the trade at approximately 1:3.08 Risk-to-Reward, meaning the 1:3 RR milestone has already been achieved based on the figures displayed in the chart. 🎯🔥