
Select a trading day to view all Scanner results, chart evidence, and market explanations.
4 Scanners Available
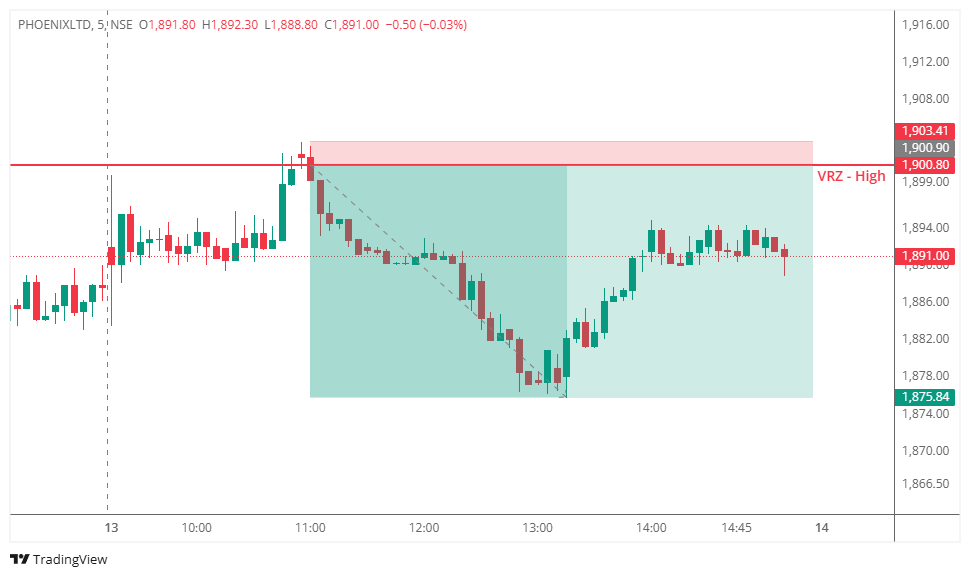

🔹 PHOENIXLTD tested the VRZ High, with buyers attempting to sustain a breakout above the resistance zone.
⚠️ The breakout failed to hold as price moved back below ₹1,900.80.
🔻 This rejection confirmed the bearish Breakout Failure (BOF) setup.
🔻 Sellers gained control immediately after the failed breakout.
📊 Price gradually moved lower while remaining below the VRZ High.
🎯 The setup delivered a 1.32% bearish move with an exceptional 1:10 Risk-Reward.
🟢 Buyers: Attempted to sustain the breakout above resistance.
🟡 Breakout Traders: Became trapped when price fell back below the VRZ High.
🔴 Sellers: Used the failed breakout to take control and push price lower.
🎭 The breakout initially created bullish expectations.
🚨 Once the breakout failed, bullish confidence weakened and trapped buyers came under pressure.
📉 Fresh selling pressure accelerated the bearish reversal.
🎯 The key confirmation came when price failed to sustain above ₹1,900.80 and returned below the VRZ High.
🔻 Continued trading below the zone strengthened the bearish bias.
⚡ The developing downside momentum provided confirmation for the BOF trade.
🚫 Failed Breakouts Can Trigger Reversals
A breakout without follow-through can quickly turn bearish.
🎯 Zone Rejection Builds Confirmation
The rejection from the VRZ High highlighted weakening buyer control.
🛡️ Defined Risk Improves Discipline
The VRZ High provided a clear invalidation reference.
⚡ Momentum Can Expand the Move
Once sellers took control, the downside move extended strongly.
📉 Following the rejection, PHOENIXLTD formed a bearish sequence of lower highs and lower lows.
🔻 Price remained below the VRZ High as sellers maintained control.
🐻 The bearish structure supported continued downside momentum.
🚨 Selling pressure increased as price moved away from the VRZ High.
📉 The failed breakout developed into a sustained bearish move.
🏆 Strong follow-through produced a 1.32% downside move with an impressive 1:10 RR.
🔸 The trade became actionable after PHOENIXLTD failed to sustain the breakout above ₹1,900.80.
📉 Sellers maintained control as price continued lower.
⚖️ The confirmed BOF structure offered a disciplined setup with clearly defined risk.

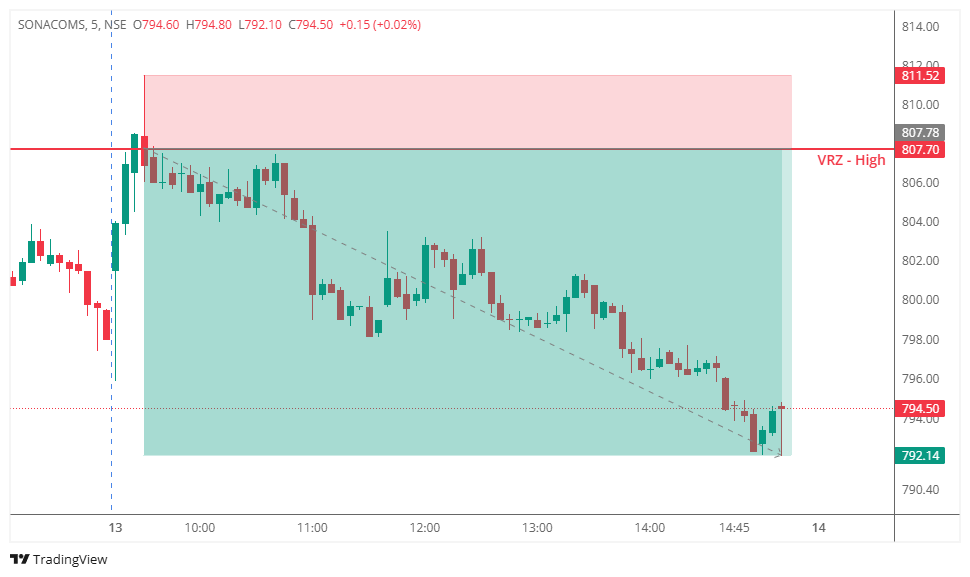

🔹 SONACOMS tested the VRZ High – ₹807.70, where buyers attempted to push price above the resistance zone.
⚠️ The breakout failed to sustain, and price quickly moved back below the VRZ High.
🔻 This rejection confirmed the Breakout Failure (BOF) and shifted the intraday bias toward sellers.
🔻 After the rejection, sellers gradually strengthened their control.
📊 Price remained below the VRZ High and continued to form weaker price levels.
🎯 The bearish momentum eventually delivered a 1.94% downside move with a strong 1:4 RR.
🟢 Buyers: Attempted to sustain the breakout above the VRZ High.
🟡 Breakout Traders: Became trapped as price slipped back below resistance.
🔴 Sellers: Used the failed breakout to gain control and maintain downside pressure.
🎭 The initial breakout created bullish expectations among market participants.
🚨 Once the breakout failed, buyer confidence weakened and trapped positions came under pressure.
📉 Fresh selling activity then supported the bearish reversal and pushed price lower.
🎯 The key confirmation came when price failed to hold above ₹807.70 and returned below the VRZ High.
🔻 This provided a clear indication that the breakout lacked sufficient buying strength.
⚡ Continued bearish price action strengthened the validity of the BOF setup.
🚫 Failed Breakouts Can Reverse Quickly
A breakout without strong follow-through can turn into a sharp reversal.
🎯 Resistance Rejection Is Important
The rejection from the VRZ High highlighted weakening buyer control.
🛡️ Defined Risk Supports Discipline
The VRZ High provided a clear level for setup invalidation.
⚡ Follow Confirmed Momentum
Once sellers gained control, the bearish move expanded steadily.
📉 Following the rejection, SONACOMS developed a bearish structure with lower highs and lower lows.
🔻 Price continued to trade below the VRZ High, keeping sellers in control.
🐻 The sustained structure supported the continuation of the bearish intraday move.
🚨 Selling pressure increased as price moved further away from the VRZ High.
📉 The failed breakout gradually developed into a sustained bearish trend.
🏆 Strong follow-through resulted in a 1.94% bearish move and 1:4 Risk-Reward outcome.
🔸 The trade became actionable after SONACOMS failed to sustain the breakout above ₹807.70.
📉 Sellers maintained control as price continued below the resistance zone.
⚖️ The confirmed BOF structure provided a disciplined setup with defined risk and strong downside potential.

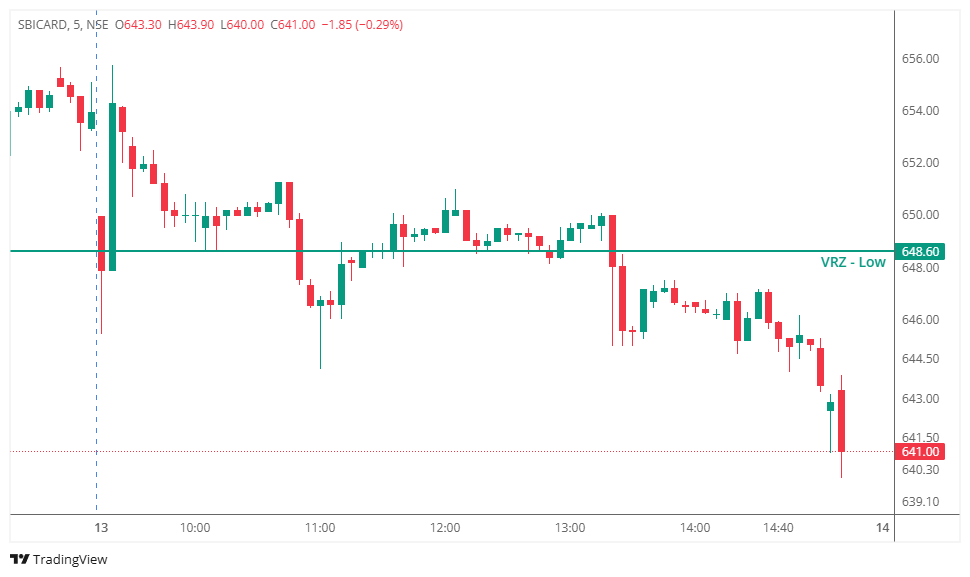

SBICARD opened with noticeable selling pressure and traded around the VRZ Low at ₹648.60, creating an important support area for the session.
Price repeatedly tested the zone and attempted to reclaim it, providing the conditions for a potential BOF long setup under the Logical Trading System (LTS).
However, the broader intraday structure remained weak, making sustained bullish confirmation necessary for the reversal to succeed.
The price action around ₹648.60 showed repeated interaction between buyers and sellers.
🟢 Buyers attempted to defend the VRZ Low.
🟡 Price recovered toward the reversal zone.
🔴 However, the recovery lacked strong continuation.
As buyers failed to establish a convincing bullish structure above the zone, sellers gradually regained control.
The BOF long setup was triggered following the attempted reclaim of the VRZ Low.
Initially, the reclaim suggested that selling pressure could be weakening. However, buyers were unable to sustain momentum.
Price subsequently moved back below the reversal zone and began forming a series of lower highs and lower lows.
As bearish pressure accelerated, the BOF setup became invalid and the predefined stop loss was triggered.
The setup failed because the expected bullish reversal did not receive sufficient follow-through.
❌ Buyers could not sustain price above ₹648.60.
❌ Bullish momentum remained weak after the reclaim.
❌ Price repeatedly formed lower highs.
❌ Sellers regained control near the VRZ Low.
❌ The broader intraday structure continued to favor sellers.
❌ Price eventually broke decisively below the support zone.
These signals indicated that the BOF long reversal lacked the strength required for continuation.
The chart shows a failed BOF reversal followed by bearish continuation.
🔻 Sellers created the initial downside pressure.
🟢 Buyers attempted to recover and reclaim the VRZ Low.
🟠 Price consolidated around the reversal zone without strong bullish expansion.
🔴 Sellers eventually pushed price back below support.
📉 Bearish momentum accelerated toward the end of the session.
⭐ The final breakdown confirmed that the earlier reclaim did not develop into a sustainable bullish reversal.
⚠️ A BOF trigger alone does not guarantee a successful reversal.
📊 Strong follow-through is required after reclaiming a key zone.
🔍 Repeated rejection around the reversal level can indicate weak buyer conviction.
🛡️ A predefined stop loss is essential when the expected price action fails to develop.
🎯 The objective is not to predict every reversal, but to execute the trading system consistently.
This setup demonstrates why professional traders must remain neutral after a trade is triggered.
✅ A valid setup can still fail.
✅ Market structure can change quickly.
✅ Losses should remain controlled and predefined.
✅ The trading process matters more than the result of one individual trade.
💪 Discipline allows traders to accept the outcome and remain prepared for the next opportunity.
Capital protection remains the foundation of consistent trading.
✔️ Entry was based on predefined BOF rules.
✔️ Risk was identified before execution.
✔️ The stop loss defined the maximum planned loss.
✔️ No emotional averaging was required.
✔️ Capital remained available for future setups.
Small, controlled losses are an unavoidable part of probability-based trading.
🌍 Markets continuously test patience, discipline, and risk management.
⚠️ This SBICARD BOF Failure shows that a reclaim of the VRZ Low is not sufficient by itself. Buyers must demonstrate strong confirmation, sustained momentum, and the ability to maintain the reclaimed level.
📉 When price repeatedly fails to hold the reversal zone and sellers regain control, the bullish BOF thesis loses validity.
🛡️ Professional traders focus on managing risk rather than trying to eliminate every losing trade.
📈 Long-term consistency comes from repeatedly executing a proven process while keeping individual losses controlled.
💪 Trust your strategy, respect your stop loss, and allow disciplined execution—not emotions—to guide every trade.
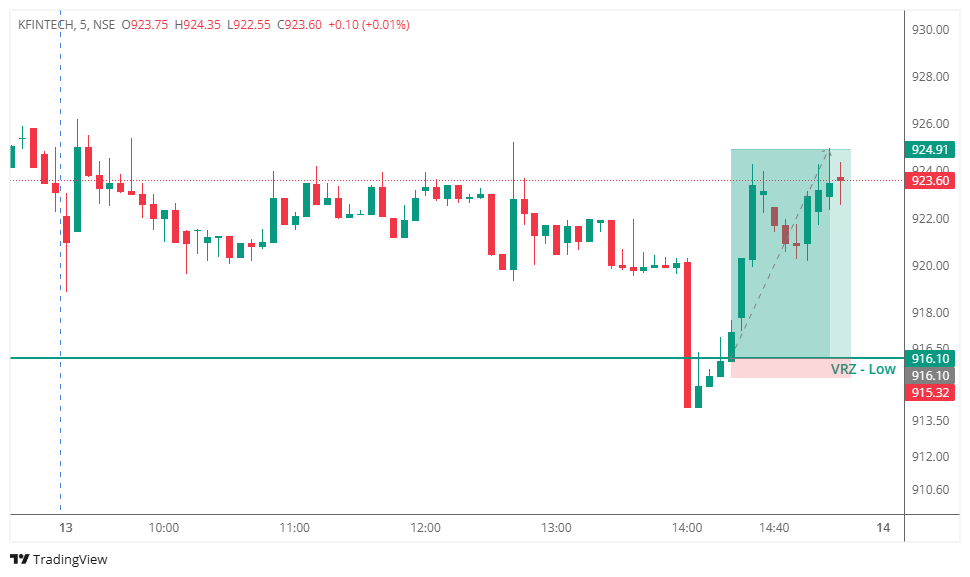

🔻 KFINTECH broke below the VRZ Low, creating a potential bearish breakdown.
⚠️ The breakdown failed to sustain as price quickly recovered back above the VRZ Low.
🟢 This sharp recovery confirmed the Breakdown Failure (BOF) setup and shifted the intraday bias toward buyers.
📈 After reclaiming the VRZ Low, buyers steadily regained control.
🟢 Price continued moving higher and maintained bullish momentum above the key zone.
🚀 The setup delivered a 0.96% bullish move with an exceptional 1:11 Risk-Reward.
🔴 Sellers: Attempted to sustain the breakdown below the VRZ Low.
🟡 Breakdown Traders: Became trapped when price reclaimed the support zone.
🟢 Buyers: Used the failed breakdown to regain control and drive the recovery.
🎭 The initial breakdown encouraged bearish expectations.
🚨 When price failed to sustain below the VRZ Low, bearish confidence weakened rapidly.
📈 The recovery above the zone attracted buying pressure and strengthened the bullish reversal.
🔻 Failed Breakdowns Can Create Strong Reversals
A breakdown that fails to hold can quickly turn into a bullish opportunity.
🎯 Zone Reclaim Signals Strength
The move back above the VRZ Low confirmed the loss of seller control.
🛡️ Defined Risk Supports Discipline
The VRZ Low provided a clear reference for setup invalidation.
⚡ Momentum Can Expand Rapidly
Once buyers regained control, the bullish move extended significantly.
🟢 Following the breakdown failure, KFINTECH developed a stronger bullish structure.
📊 Price recovered from the VRZ Low and continued forming higher levels.
🚀 Sustained buying pressure supported the continuation of the bullish reversal.
⚡ The failed breakdown created a clear transition from bearish to bullish control.
📈 Buyers continued pushing price higher after the VRZ Low reclaim.
🏆 Strong follow-through resulted in a 0.96% bullish move with a remarkable 1:11 RR.
🔸 The setup became actionable after KFINTECH failed to sustain the breakdown below ₹916.10.
🟢 The reclaim of the VRZ Low confirmed the bullish BOF structure.
📈 Buyers maintained control and extended the reversal.
⚖️ The trade delivered an impressive 1:11 Risk-Reward.