
Select a trading day to view all Scanner results, chart evidence, and market explanations.
4 Scanners Available
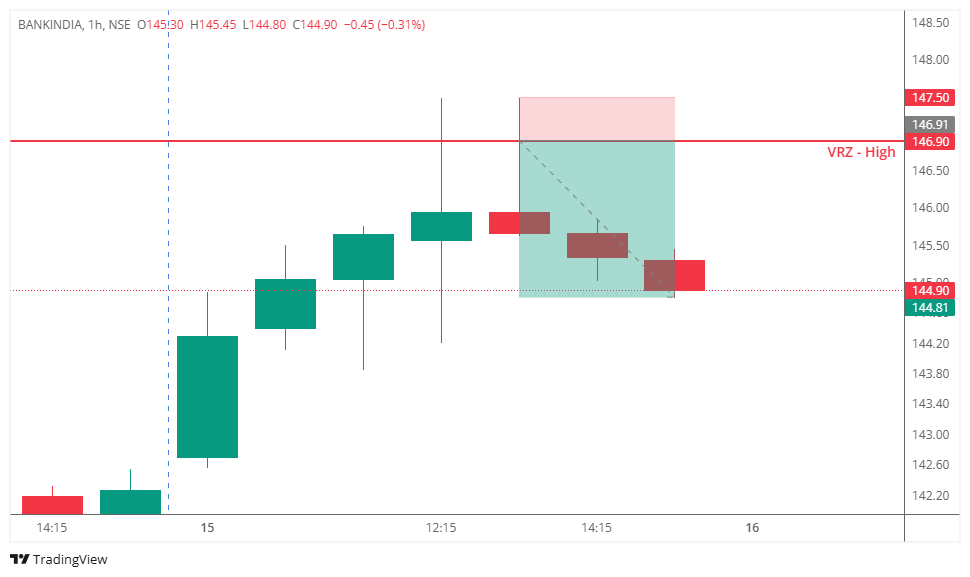

🎯 Bank of India tested the previously identified VRZ High at ₹146.90 and briefly traded above the resistance zone, giving traders the impression that a bullish breakout had been confirmed.
📈 The initial move attracted fresh buyers expecting a continuation of the uptrend as price challenged the key resistance level.
⚠️ However, the breakout lacked follow-through.
🔻 Selling pressure quickly emerged, forcing the stock back below ₹146.90. The following hourly candles confirmed acceptance beneath the VRZ High, indicating that buyers had lost control and sellers had regained momentum.
✅ This price action confirmed a classic Breakout Failure (BOF) setup.
💥 As the failed breakout became evident, trapped buyers started exiting their positions while fresh sellers entered the market. The combination of long unwinding and new selling pressure resulted in a 1.43% downside move, successfully achieving the planned 1:3 risk-reward target.
Many traders believed:
🚀 The breakout above resistance would continue.
📊 Buyers had taken complete control of the trend.
📈 Higher prices were likely to follow.
The market reacted differently.
🔻 Price quickly slipped back below ₹146.90.
😮 Breakout buyers became trapped.
🛡️ Sellers regained control near the resistance zone.
📉 Bearish momentum strengthened as long positions were unwound.
This shift from bullish optimism to bearish dominance fueled the successful downside move.
🔹 A Breakout Requires Sustained Acceptance Above Resistance
Temporary moves above the VRZ High are not enough to confirm a genuine breakout.
🔹 Quick Rejection Reflects Strong Seller Conviction
The swift move back below ₹146.90 highlighted aggressive selling pressure and weak buyer commitment.
🔹 Failed Breakouts Often Create High-Probability Short Trades
Trapped breakout buyers frequently accelerate bearish momentum through long liquidation.
🔹 Confirmation Enhances Trade Probability
Waiting for price to reclaim acceptance below the VRZ High provided a disciplined, high-probability BOF short setup with clearly defined risk.
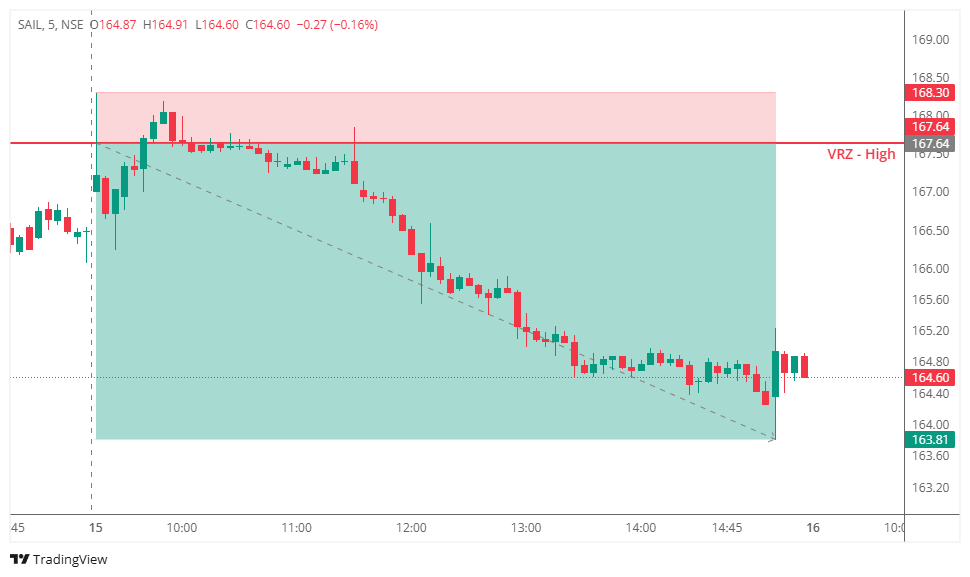

📍 SAIL tested the previously identified VRZ High and briefly moved above the resistance zone, signaling an apparent bullish breakout.
🚨 Buying momentum quickly faded as price slipped back below the VRZ High, invalidating the breakout attempt.
📉 This rejection confirmed a classic Breakout Failure (BOF), trapping aggressive breakout buyers and shifting momentum toward the sellers.
💹 Selling pressure strengthened steadily throughout the session, creating a clean bearish trend.
🎯 The setup produced an impressive 2.28% intraday move with an excellent 1:6 Risk-Reward.
Many traders initially expected:
🔸 The breakout above the VRZ High would continue.
🔸 Buyers would defend the resistance breakout.
🔸 Bullish momentum would extend toward fresh intraday highs.
📍 The market reacted differently.
💥 Breakout buyers became trapped below resistance.
🔥 Selling pressure increased candle after candle.
🚫 Bulls failed to reclaim the VRZ High.
📉 Bears regained complete short-term control.
🎯 The failed breakout developed into a textbook BOF bearish reversal.
⭐ 1️⃣ Failed Breakouts Create Opportunity
When resistance fails to hold as support, trapped buyers often accelerate the downside by exiting their positions.
🎯 2️⃣ Wait for Market Confirmation
The short setup became valid only after price accepted back below the VRZ High, filtering out false breakout signals.
🛡️ 3️⃣ Protect Risk, Maximize Reward
Using the VRZ High as the invalidation level created a well-defined stop-loss while capturing an efficient 1:6 Risk-Reward.
📈 4️⃣ Let Structure Guide the Trade
Following confirmed price action instead of predicting reversals keeps traders aligned with the market's true direction.
📊 SAIL demonstrated how a failed breakout can rapidly shift market control from buyers to sellers.
🌟 Traders who waited for BOF confirmation avoided the false breakout and entered alongside strengthening bearish momentum.
📉 The bearish structure remained intact from entry to target, reinforcing the value of patience, confirmation, and disciplined execution.
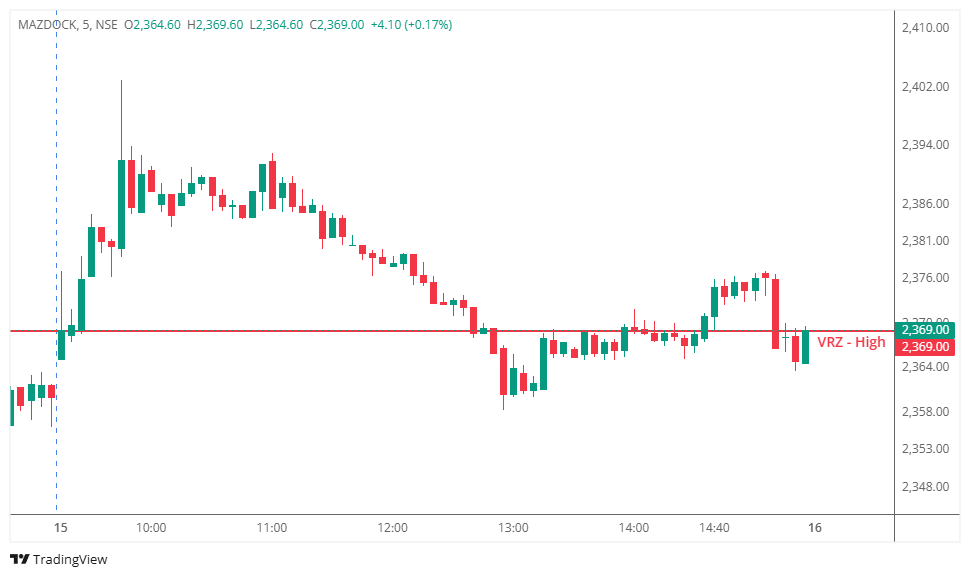

📈 MAZDOCK approached the previously identified VRZ High at ₹2369.00 and briefly moved above the resistance zone, creating the appearance of a bullish breakout.
💡 Initially, the breakout suggested buyers had gained control and that higher prices could follow. This attracted breakout traders expecting a strong bullish continuation.
⚠️ However, the price quickly slipped back below the VRZ High, indicating an early rejection of the breakout. Although this reclaim below resistance hinted at a potential Breakout Failure (BOF), sellers failed to generate the follow-through required to confirm a bearish reversal.
📊 Instead of accelerating lower, the stock continued trading around the VRZ High with limited momentum. The market remained range-bound, with neither buyers nor sellers establishing clear dominance.
❌ As a result, the potential BOF remained invalidated, and no high-probability trade setup emerged.
🔸 🚀 The breakout above resistance was genuine.
🔸 📉 A failed breakout would trigger aggressive selling.
🔸 🐻 Sellers would quickly dominate after the rejection.
After price moved back below ₹2369.00:
🟡 Buyers reduced their aggression.
🟠 Sellers gained only temporary control.
⚪ Strong bearish momentum never developed.
🔄 Price continued consolidating around the VRZ High.
💭 This lack of acceptance below resistance prevented the BOF from evolving into a quality intraday opportunity.
➡️ Moving back below resistance alone does not confirm a valid Breakout Failure.
➡️ Without strong follow-through selling, BOF setups lose their probability advantage.
➡️ Sideways price action near the VRZ indicates a lack of conviction from both buyers and sellers.
➡️ Waiting for complete confirmation helps avoid low-conviction trades and protects trading capital.
💡 This setup reminds traders that a rejection from the VRZ High is only the beginning of a BOF—not the confirmation.
Although MAZDOCK slipped back below the resistance zone, the absence of sustained selling pressure kept the setup incomplete under the Logical Trading System (LTS).
✅ By waiting for proper confirmation instead of anticipating the move, traders avoided a low-probability setup while preserving both capital and discipline.
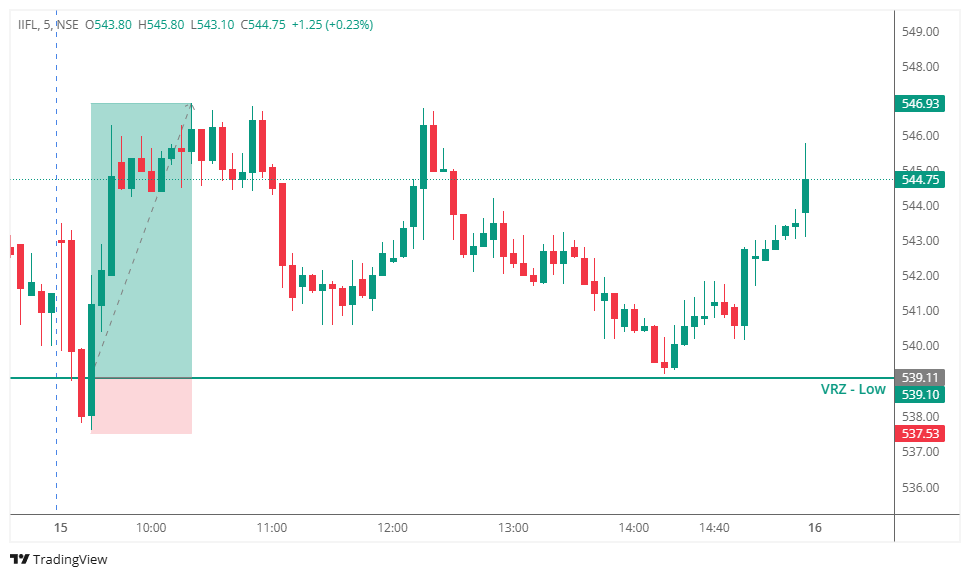

📍 IIFL approached the previously identified VRZ Low during the opening session and briefly traded below the support zone, suggesting a potential bearish breakdown.
⚠️ The breakdown failed to sustain as sellers couldn't maintain control beneath the support level.
📈 Price quickly reclaimed the VRZ Low, confirming a textbook Breakdown Failure (BOF) setup. This recovery trapped aggressive breakdown sellers and shifted short-term momentum back to the buyers.
💹 Following confirmation, buying pressure strengthened steadily and the stock respected the bullish structure throughout the session.
🎯 The setup generated a 1.45% move with an impressive 1:5 Risk-Reward, rewarding traders who waited for confirmation instead of reacting to the initial breakdown.
Many traders initially expected:
🔹 The breakdown below the VRZ Low would continue lower.
🔹 Sellers would dominate below the support zone.
🔹 Fresh bearish momentum would create new intraday lows.
📌 The market had other plans.
After price reclaimed the VRZ Low:
🔸 Breakdown sellers became trapped.
🔸 Buyers stepped in with increasing confidence.
🔸 Bears failed to regain control below support.
🔸 Bullish momentum strengthened throughout the session.
🔸 The failed breakdown transformed into a high-probability BOF reversal.
🟡 1️⃣ Failed Breakdowns Can Create Strong Buying Opportunities
When price quickly reclaims an important support level, trapped sellers often fuel the rally by covering their positions.
🟢 2️⃣ Confirmation Improves Trade Quality
The long setup became valid only after price accepted back above the VRZ Low, helping traders avoid false breakdown entries.
🔵 3️⃣ Smart Risk Management Improves Consistency
Using the VRZ Low as the invalidation level provided a clearly defined stop-loss while allowing traders to capture an efficient 1:5 Risk-Reward.
🟣 4️⃣ Trust Confirmed Price Action
Successful BOF trades come from following market confirmation rather than predicting reversals.

📊 This IIFL session demonstrated how a failed breakdown can quickly reverse market sentiment from bearish to bullish.
⭐ Traders who patiently waited for BOF confirmation avoided the false breakdown and participated in a high-probability bullish reversal.
📈 The bullish structure remained intact from entry to target, reinforcing the importance of patience, confirmation, and disciplined execution.