
Select a trading day to view all Scanner results, chart evidence, and market explanations.
4 Scanners Available
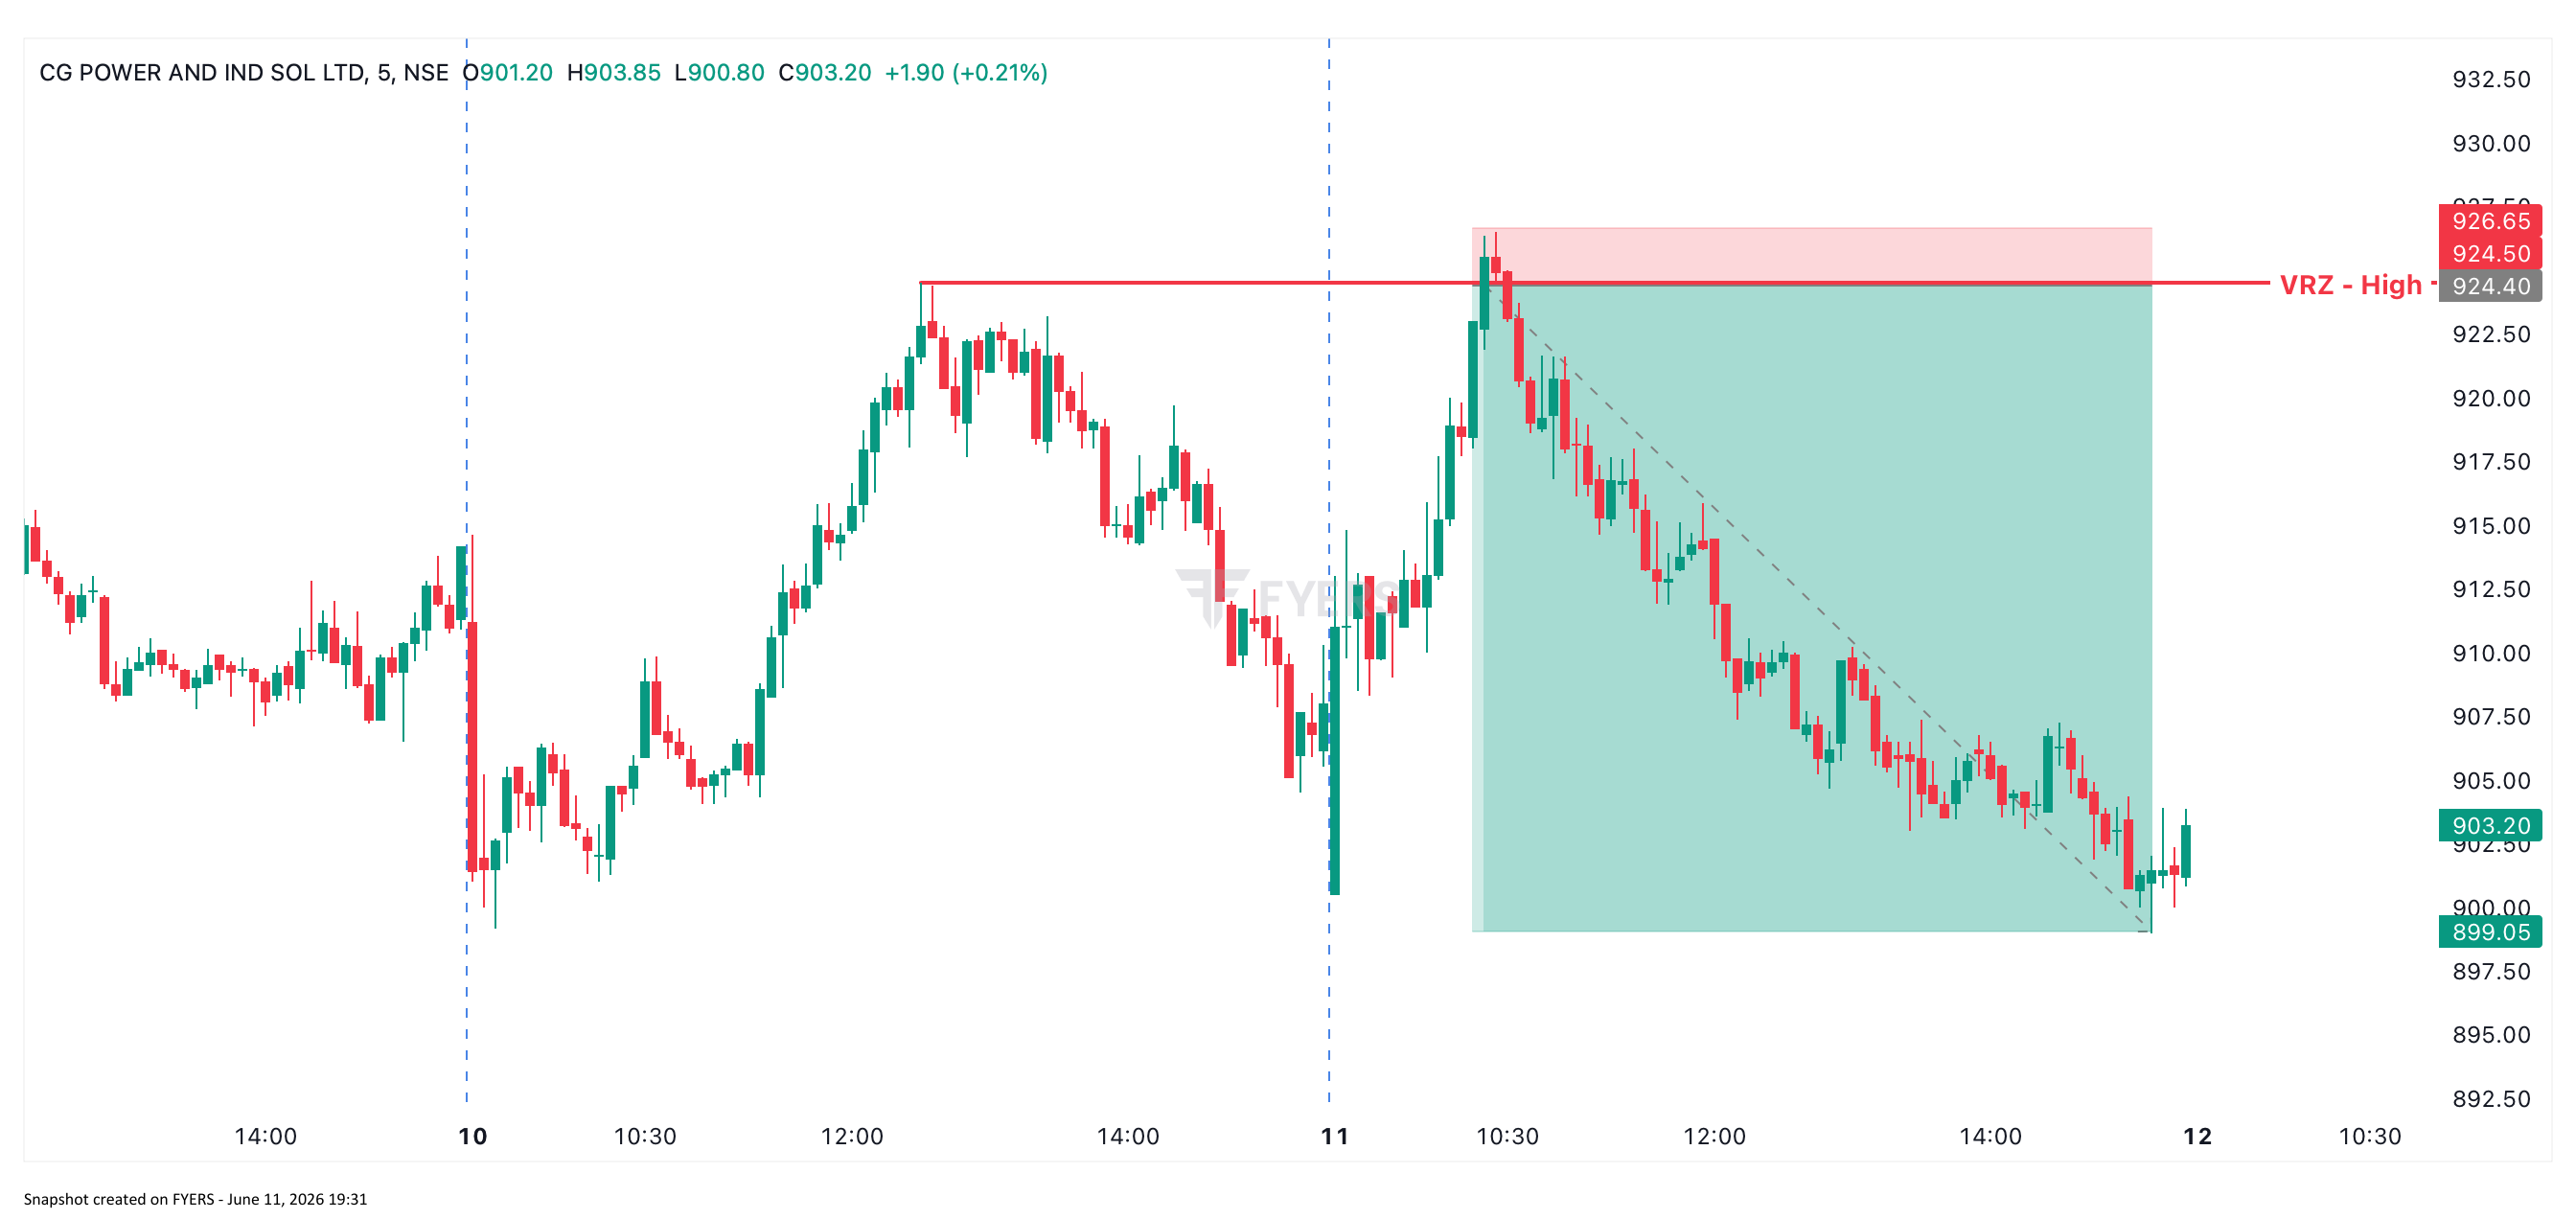
CG Power attempted a breakout above the VRZ High zone and briefly traded above resistance, attracting breakout buyers.
However, the breakout failed almost immediately. Price slipped back below the VRZ level, confirming a BOF short setup. Once the failure was established, sellers dominated the session and the stock entered a sustained downtrend.
Unlike many trades that achieve their target quickly and reverse, this setup continued to make lower highs and lower lows throughout the day, offering traders the opportunity to trail profits and capture a large move.
The biggest BOF winners often start with a small failure.
When a breakout attracts maximum participation but cannot sustain itself, the trapped side is forced to exit, creating momentum in the opposite direction.
This CG Power setup is a classic example of how a failed breakout can evolve into an all-day trending move.
The initial risk was small, but the downside move kept extending throughout the session. Traders who followed their plan and managed the position logically had the opportunity to extract multiple times their initial risk.
Result: ✅ BOF Success | Strong Intraday Trend | CG POWER (5-Minute Chart)

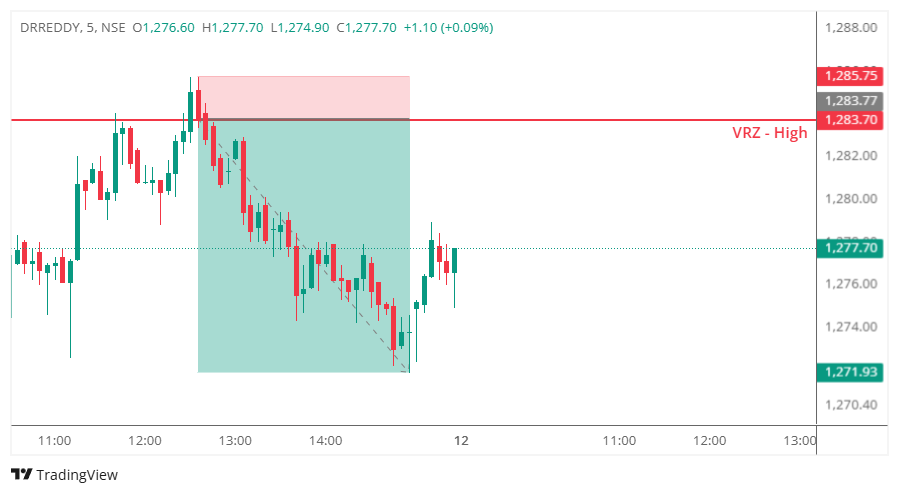
DRREDDY approached a significant Visible Reversal Zone (VRZ) High near ₹1283.70 during the afternoon trading session.
Initially, buyers managed to push the stock above the VRZ High, creating the appearance of a bullish breakout. The move attracted breakout traders expecting continuation toward higher prices.
At first glance, the setup appeared constructive for buyers.
However, the breakout quickly lost momentum.
Instead of sustaining above the resistance zone, selling pressure emerged near the highs and forced price back below the VRZ.
This failure to maintain acceptance above ₹1283.70 signaled a potential shift in market control.
As price continued trading below the VRZ, bearish momentum strengthened and the stock began forming a series of lower highs and lower lows.
The rejection confirmed a classic Breakout Failure (BOF) setup.
Once trapped buyers started exiting positions, selling pressure accelerated and DRREDDY witnessed a strong intraday decline from the breakout area.
Most traders believe that a breakout above resistance automatically signals strength.
The market often uses this belief to trap participants.
Many traders assumed:
The market had a different plan.
The breakout attracted participation but failed to attract acceptance.
When price moved back below ₹1283.70:
Started questioning their bullish positions.
Exited quickly as the breakout lost strength.
Found themselves trapped near the highs.
Recognized the rejection and shifted toward the short side.
This transition from confidence to fear created the fuel for the downside move.
The market rewarded traders who waited for confirmation and punished those who chased the breakout.
Many traders focus on price crossing resistance.
Professional traders focus on whether the market accepts prices above resistance.
DRREDDY failed that acceptance test.
When buyers become trapped above resistance, their exits often accelerate downside momentum.
This is one of the primary reasons BOF setups can be highly effective.
Following the rejection, every recovery attempt failed to create a new high.
This provided additional confirmation that sellers were dominating the market.
Predicting a breakout can lead to unnecessary risk.
Waiting for BOF confirmation often produces higher-probability trading opportunities with clearly defined risk.

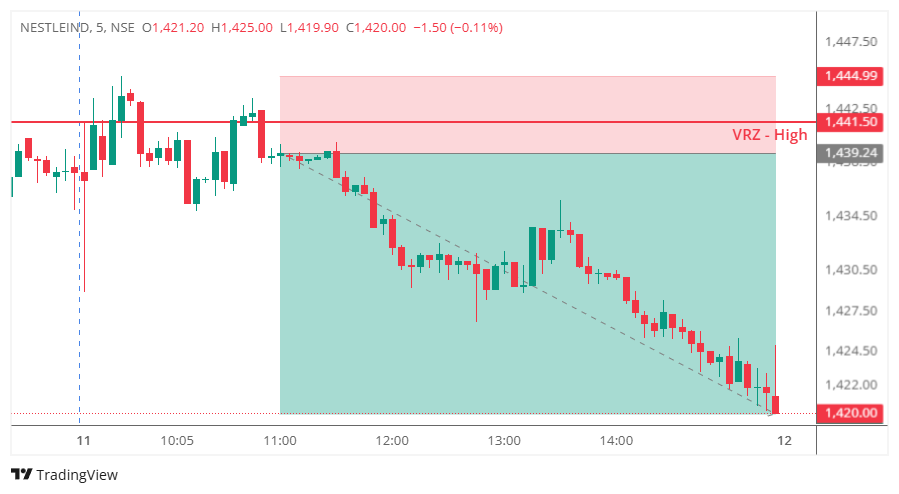
NESTLEIND approached a significant Visible Reversal Zone (VRZ) High near ₹1441.50 during the trading session.
As price moved toward resistance, buyers attempted to push the stock above the VRZ, creating the appearance of a bullish breakout. Traders expecting continuation viewed the move as a potential opportunity for further upside.
However, the breakout failed to gain acceptance.
Instead of sustaining above the resistance zone, selling pressure gradually emerged and pushed price back below the VRZ High.
The inability to hold above ₹1441.50 signaled that buyers were losing control.
As the session progressed, bearish candles began forming consistently below the VRZ, confirming a classic Breakout Failure (BOF) setup.
Once the rejection was confirmed, sellers dominated the market and the stock entered a steady intraday downtrend, producing lower highs and lower lows throughout the remainder of the session.
The market often moves against the expectations of the majority.
Many traders assumed:
The market disagreed.
The breakout attracted attention but failed to attract commitment.
When price started trading below ₹1441.50:
Began questioning their positions.
Exited as bullish momentum weakened.
Found themselves trapped near the highs.
Recognized the lack of acceptance and shifted toward the short side.
This transition from confidence to uncertainty fueled the bearish move.
The market rewarded traders who waited for confirmation rather than reacting to the initial breakout attempt.
Many traders focus on whether price crosses resistance.
Professional traders focus on whether the market accepts prices above resistance.
NESTLEIND failed that acceptance test.
A breakout is only valid if buyers can sustain control.
Temporary moves above resistance often become traps for aggressive traders.
Following the rejection, each recovery attempt failed to create a new high.
This provided additional evidence that sellers were controlling the auction.
Predicting a breakout can be expensive.
Waiting for BOF confirmation often provides a higher-probability trading opportunity.
Entry: Short position after confirmation that price held below the VRZ High.
Stop Loss: Above BOF Candle High.
Target: 1:3 Risk-Reward (RR)

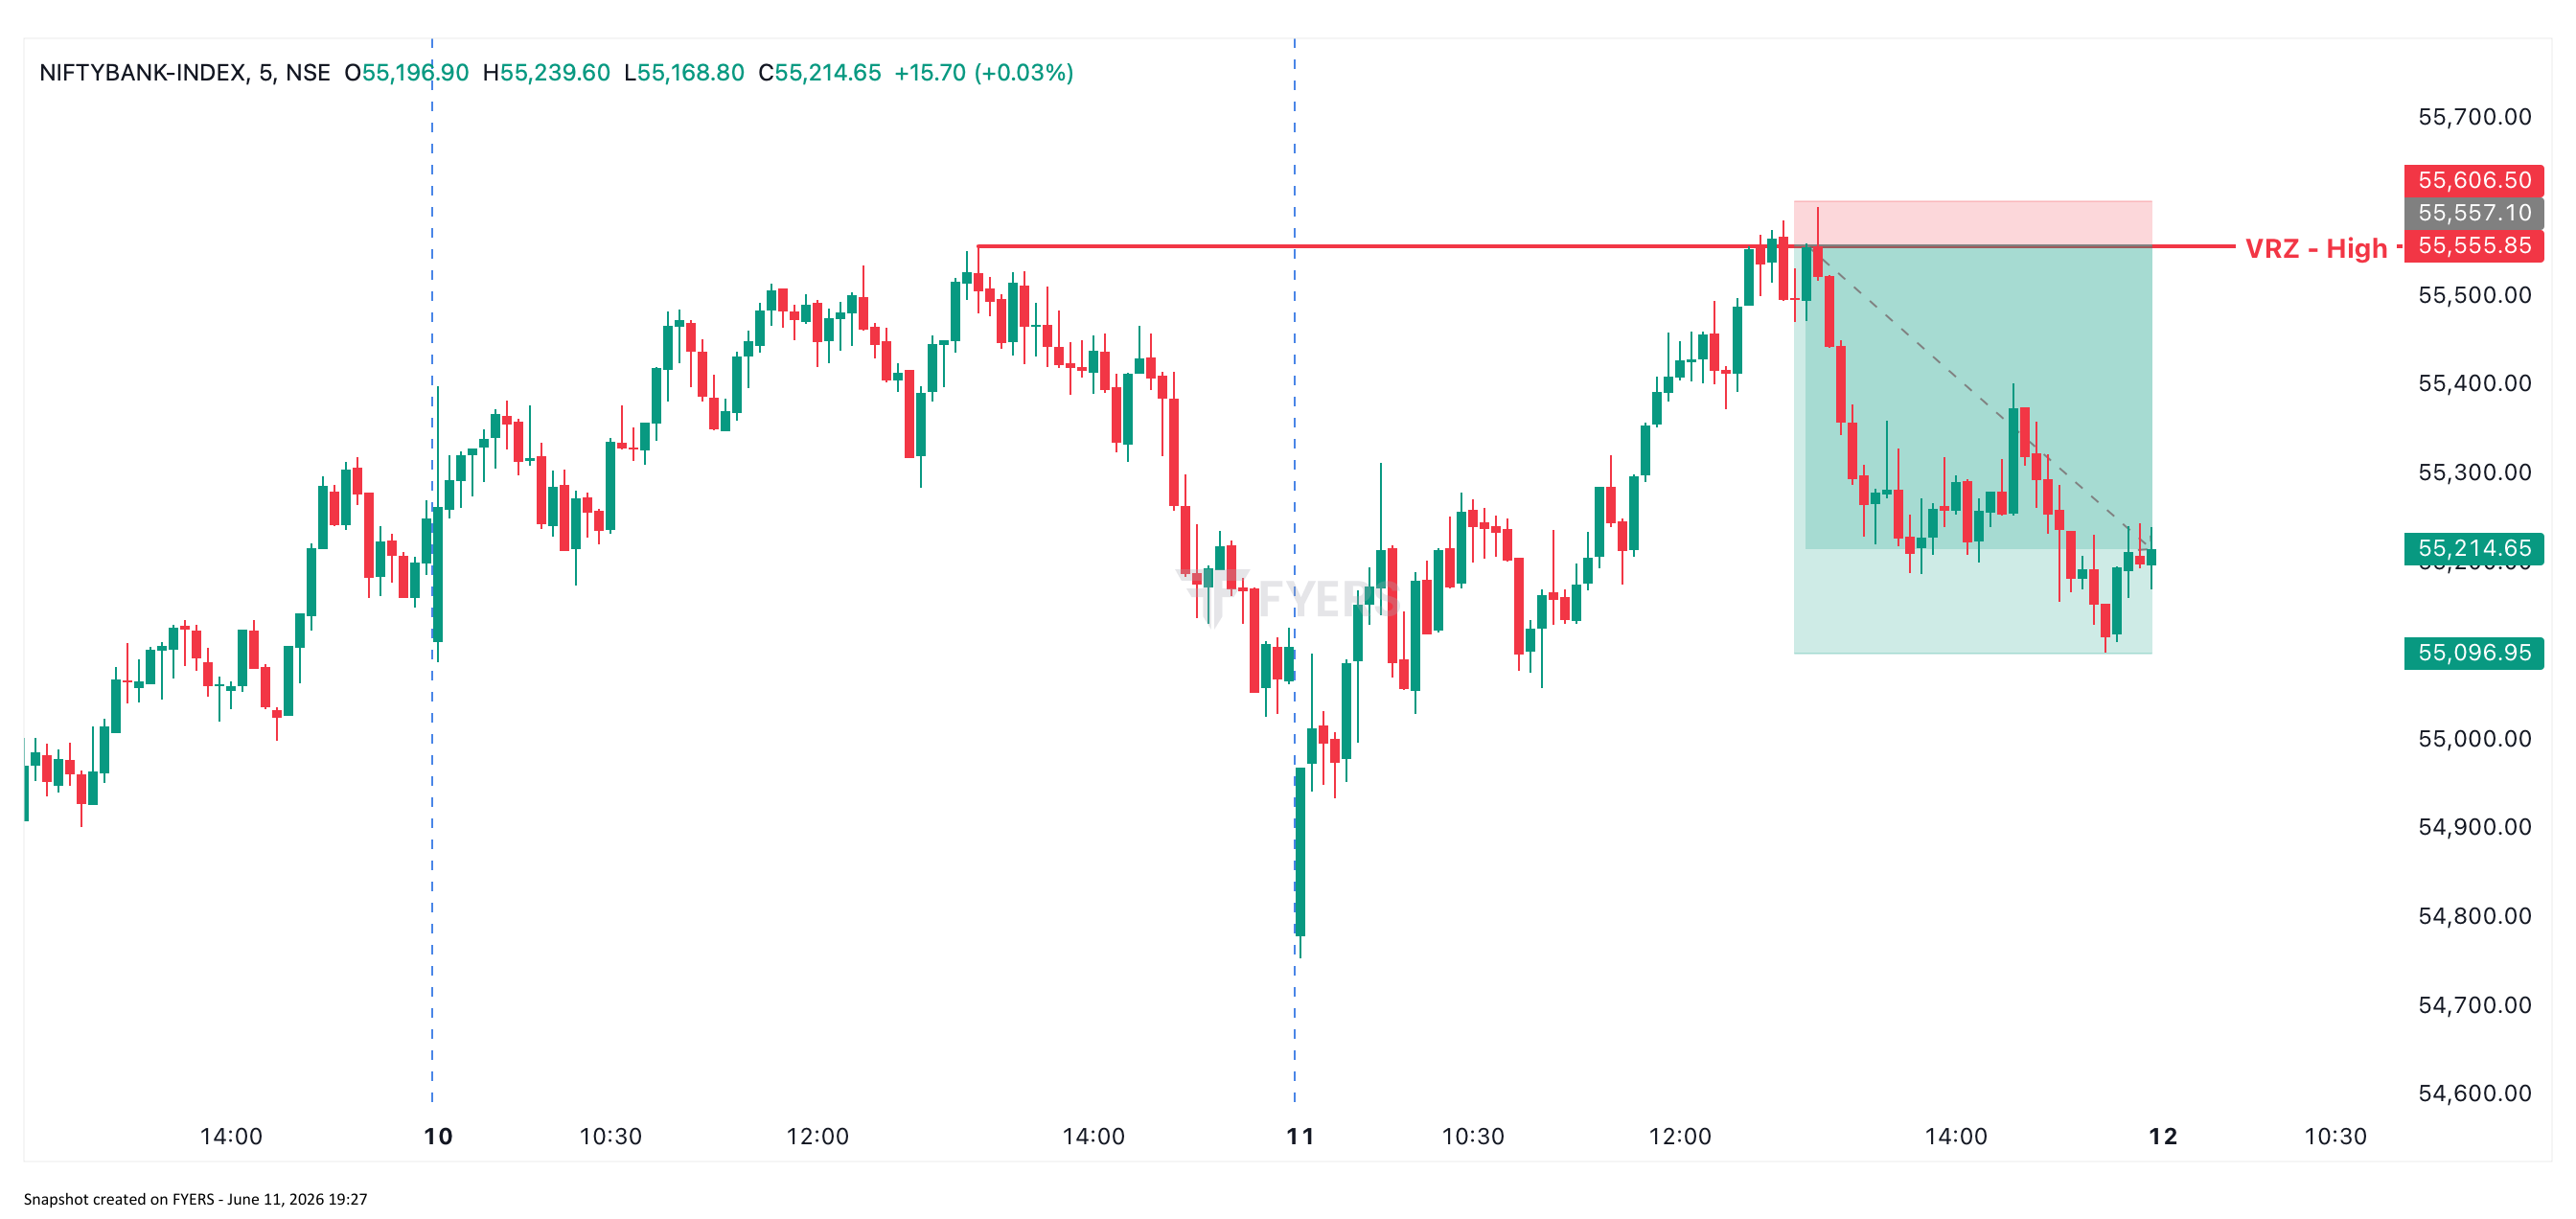
BANK NIFTY attempted to break above the VRZ High and briefly traded beyond the level, creating the impression of a bullish breakout.
However, buyers failed to sustain the move. The breakout quickly lost momentum, and price slipped back below the VRZ level, triggering a BOF short setup.
Once the failure was confirmed, sellers took complete control. The market declined sharply throughout the session, delivering an exceptional 1:9 Risk-Reward move.
The strongest BOF trades often occur when:
This BANK NIFTY setup demonstrates how a failed breakout can produce a move far larger than the breakout itself.
A trader risking 1 unit on this setup had the potential to earn 9 units, meaning a single trade could offset multiple small losses and still leave a substantial net gain.
