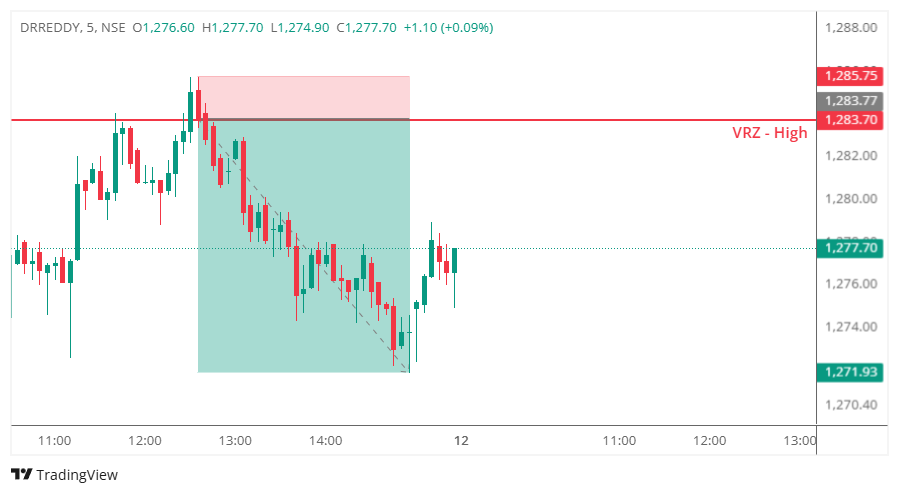
DRREDDY approached a significant Visible Reversal Zone (VRZ) High near ₹1283.70 during the afternoon trading session.
Initially, buyers managed to push the stock above the VRZ High, creating the appearance of a bullish breakout. The move attracted breakout traders expecting continuation toward higher prices.
At first glance, the setup appeared constructive for buyers.
However, the breakout quickly lost momentum.
Instead of sustaining above the resistance zone, selling pressure emerged near the highs and forced price back below the VRZ.
This failure to maintain acceptance above ₹1283.70 signaled a potential shift in market control.
As price continued trading below the VRZ, bearish momentum strengthened and the stock began forming a series of lower highs and lower lows.
The rejection confirmed a classic Breakout Failure (BOF) setup.
Once trapped buyers started exiting positions, selling pressure accelerated and DRREDDY witnessed a strong intraday decline from the breakout area.
Most traders believe that a breakout above resistance automatically signals strength.
The market often uses this belief to trap participants.
Many traders assumed:
The market had a different plan.
The breakout attracted participation but failed to attract acceptance.
When price moved back below ₹1283.70:
Started questioning their bullish positions.
Exited quickly as the breakout lost strength.
Found themselves trapped near the highs.
Recognized the rejection and shifted toward the short side.
This transition from confidence to fear created the fuel for the downside move.
The market rewarded traders who waited for confirmation and punished those who chased the breakout.
Many traders focus on price crossing resistance.
Professional traders focus on whether the market accepts prices above resistance.
DRREDDY failed that acceptance test.
When buyers become trapped above resistance, their exits often accelerate downside momentum.
This is one of the primary reasons BOF setups can be highly effective.
Following the rejection, every recovery attempt failed to create a new high.
This provided additional confirmation that sellers were dominating the market.
Predicting a breakout can lead to unnecessary risk.
Waiting for BOF confirmation often produces higher-probability trading opportunities with clearly defined risk.