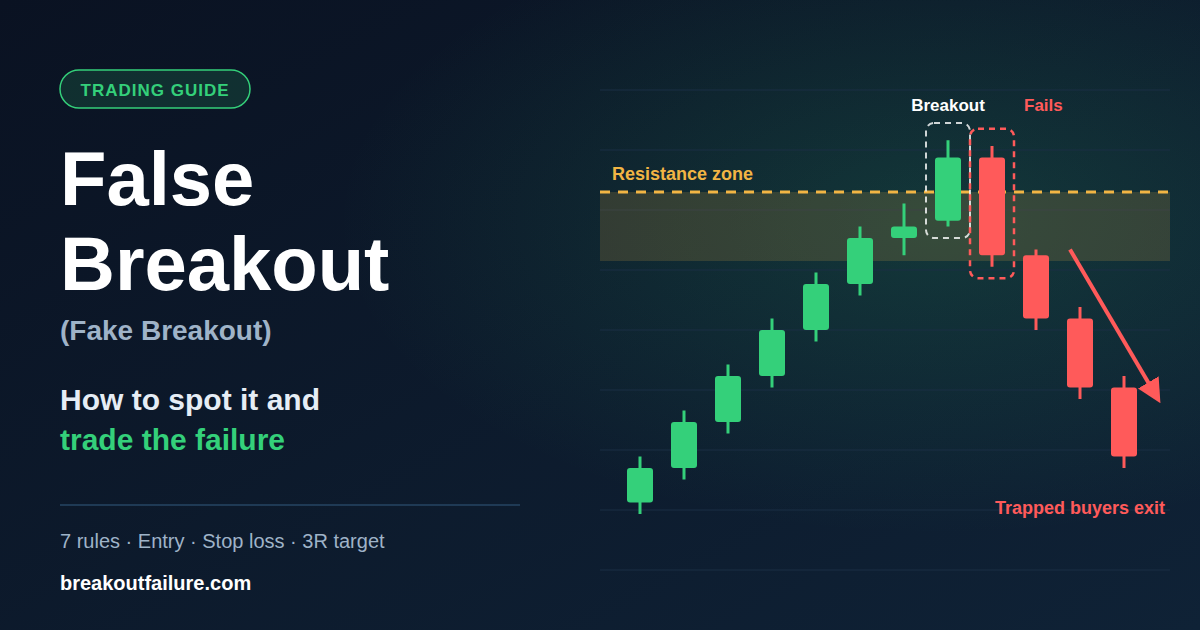
What is a false breakout? A false breakout (also called a fake breakout or breakout failure) happens when price moves beyond a key support or resistance level, fails to hold there, and quickly returns inside its old range. Traders who entered the breakout get trapped, and their exits often drive a sharp move in the opposite direction.

Caption: A False Breakout: price breaks out, fails on the next candle and reverses as buyers get trapped.
You buy a stock the moment it breaks above resistance. Minutes later, price is back below the level and your stop loss is hit. If that sounds familiar, you have traded a false breakout.
False breakouts are one of the most common reasons retail traders lose money in the Indian stock market. They happen every day on Nifty, Bank Nifty and NSE stocks. But the same move that traps breakout traders gives a clear, low-risk opportunity to traders who know how to read it.
This guide is based on the research paper Breakout Failure in Financial Markets: A Behavioural and Structural Analysis Using Visible Reversal Zones by Suresh Duraisamy. Read Research Paper ->
It turns the false breakout into a rule-based setup called a Breakout Failure (BOF).
In this guide you will learn:
- What a false breakout is, and how it differs from a real breakout
- Why fake breakouts happen, and who gets trapped
- The main types of false breakouts and fake breakout patterns
- The 7 rules to spot a high-probability false breakout
- A step-by-step false breakout trading strategy with entry, stop loss and a 3R target
- Whether any indicator can detect false breakouts
- How to stop getting trapped, and how to find false breakouts automatically
What Is a False Breakout in Trading?
A false breakout is a breakout that does not follow through. Price crosses a support or resistance level, attracts breakout traders, then reverses back inside the range.
To understand it, start with a normal breakout. A breakout is a move beyond a level where price has turned before. Resistance is where sellers have stopped rises. Support is where buyers have stopped falls. A real breakout shows that one side has taken control, and price keeps moving.
A false breakout looks exactly the same at first. The difference shows up in the next candle or two: instead of continuing, price falls back through the level.
False Breakout vs Fake Breakout vs Failed Breakout
These three terms mean the same thing. Indian traders search most often for "false breakout" and "fake breakout". Some traders also call it a fakeout. In the BOF model, a false breakout that meets strict rules is called a breakout failure (BOF).
What Is a False Breakdown?
A false breakdown is the same event on the downside. Price breaks below support, draws in short sellers, then climbs back above support. The sellers get trapped instead of the buyers. It is also called a bear trap.
Real Breakout vs False Breakout: Key Differences
The clearest difference is what the next candle does. A real breakout builds on the move; a false breakout gives it back.
- Breakout candle close: a real breakout closes firmly beyond the level. A false breakout often closes just beyond it, with a small extension.
- Next candle: a real breakout continues in the breakout direction. A false breakout closes back inside the range.
- Candle shape: a real breakout has strong bodies and small wicks. A false breakout often leaves a long rejection wick beyond the level.
- Retest of the level: in a real breakout, old resistance holds as new support. In a false breakout, price falls straight back through it.
- Who gets trapped: a real breakout traps traders who bet against the move. A false breakout traps traders who chased the breakout.

Left: A real breakout holds and retests. Right: A false breakout closes back inside on the next candle.
Why Do False Breakouts Happen?
False breakouts happen when the push through a level comes from a short burst of orders, not from lasting buying or selling. Once those orders are filled, nobody is left to carry price further.
1. Stop-Loss Clusters and Liquidity Grabs
Traders place stop losses just beyond obvious levels. When price touches that area, a wave of stop orders fires at once. That burst pushes price through the level for a moment. Larger players can use this liquidity to fill their own orders in the opposite direction. This is often called stop loss hunting or a liquidity grab.
2. FOMO and Late Entries
Many traders buy a breakout because they fear missing a big move, not because of analysis. Their late entries add brief force. When the burst fades, they are the first to panic.
3. Crowding at Obvious Levels
The previous day high and low (PDH/PDL) and weekly highs and lows are marked on every chart. Crowds of breakout orders gather there. A crowd can push price briefly, but a crowd is not conviction.
4. Emotional Exhaustion
When price has already run a long way into a level, buyers are tired. A breakout attempt at that point often has no energy left to hold.
5. News Spikes and Thin Liquidity
Results days, RBI policy announcements and global news can spike price through a level. Thin, illiquid stocks can jump through a level on a few orders. Both often snap back.
The Trapped-Trader Effect
Every false breakout leaves a group of trapped traders. After a failed upside breakout, breakout buyers sit on losses with stop losses just below the level. As price falls back, those stops trigger, their selling adds to the fall, and fresh sellers join in. This chain reaction is why the reversal after a false breakout is often fast and sharp.
Types of False Breakouts
Every false breakout is either a bull trap or a bear trap. The level it happens at gives it its other names.
Bull Trap (False Upside Breakout)
Price closes above resistance, draws in buyers, then closes back below. Breakout buyers are trapped. The trade idea is a short.
Bear Trap (False Breakdown)
Price closes below support, draws in short sellers, then closes back above. Sellers are trapped. The trade idea is a long.

Caption: The two types of false breakout: Bull Trap (left) and Bear Trap (right).
Other Common False Breakouts
- Trendline false breakout: price crosses a rising or falling trendline, then closes back on the original side.
- Range false breakout: price pokes out of the top or bottom of a sideways range and returns inside.
- Pattern false breakout: a triangle, flag or rectangle "completes", but price reverses.
- Inside bar false breakout: price breaks the high or low of an inside bar, then reverses the same way.
- Opening range false breakout: an early intraday break of the first 15 or 30 minutes' high or low fails and reverses.
Fake Breakout Patterns: What a False Breakout Looks Like on a Chart
A fake breakout pattern is usually a two-candle story: a breakout candle that closes beyond the level, then a failure candle that erases it.
The Breakout Candle
- Closes just beyond the level, not far past it
- Often has a wick pointing further in the breakout direction
- Looks convincing on its own, which is why traders chase it
The False Breakout Candle (the Failure Candle)
- Closes back inside the zone on the very next candle
- Closes beyond the breakout candle's whole range: below its low after an upside breakout, above its high after a downside one
- Usually has a strong body in the reversal direction
When you see both candles together at an important level, you are looking at a classic fake breakout pattern.
Warning Signs Before a Breakout Fails
- Price reaches the level after a long, one-way run with no pause
- The breakout candle is small, or its close barely clears the level
- The breakout happens near a big news event or in a thin, illiquid stock
- The broader market (Nifty 50 or the sector index) is moving the other way

Where False Breakouts Happen Most: Visible Reversal Zones (VRZ)
The most reliable false breakouts happen at Visible Reversal Zones (VRZ): price areas where the market has clearly reversed before. These zones hold the market's memory of where buyers or sellers acted with conviction, so traders react to them again.
Why VRZ Works Better Than PDH, PDL and Weekly Levels
The previous day high, previous day low and weekly highs and lows are calendar levels. Every charting tool marks them, so breakout orders crowd there. But a calendar level does not prove that any real buying or selling happened at that price. A VRZ is built from actual reversals, so price tends to react to it more consistently.
How to Mark a VRZ High and a VRZ Low
For intraday trading, mark VRZ on the 30-minute chart using a five-candle pattern:
- VRZ High (inverse V): the middle candle has the highest high of five candles, with two lower highs on each side. Its high is the VRZ High.
- VRZ Low (V-shape): the middle candle has the lowest low of five candles, with two higher lows on each side. Its low is the VRZ Low.
More candles confirming the turn on each side make the zone stronger. Only clear, visible turns count, not small random wiggles.

Caption: VRZ High and VRZ Low: the middle candle marks the turning point.
How to Spot a False Breakout: 7 Rules
A high-probability false breakout, a breakout failure (BOF), meets all seven rules below. For intraday trading, mark the VRZ on the 30-minute chart and watch the breakout on the 5-minute chart.
- A valid breakout candle. A candle closes fully above the VRZ High or below the VRZ Low. A wick alone does not count.
- The next candle closes back inside the VRZ. A wick touching the zone is not enough; the close must be inside.
- The failure candle breaks the breakout candle's structure. After an upside breakout, it closes below the breakout candle's low. After a downside breakout, it closes above the breakout candle's high. This is the most important rule.
- The VRZ is valid. It comes from a clear V-shape or inverse V-shape, not random noise.
- The breakout extension is small. The breakout candle closed only a little beyond the zone.
- The candles are clean. Solid bodies, not candles full of long wicks and indecision.
- Market conditions are normal. No high-impact news and no illiquid, thin trading.
In a successful setup, the third candle usually continues in the reversal direction. That confirms the breakout traders are trapped.

Caption: Save this checklist: all 7 rules must be met before you trade a false breakout.
Breakout Extension Metric (BEM)
BEM measures how far the breakout candle closed beyond the zone:
BEM = | Breakout candle close − VRZ boundary |
The boundary is the VRZ High for an upside breakout and the VRZ Low for a downside breakout. A small BEM suggests an emotional, weak push with a higher chance of failure. A large BEM shows real strength, so skip the trade.
Tip: never predict a false breakout. Wait for the failure candle to close and meet rule 3. Guessing the failure is as risky as chasing the breakout.
False Breakout Trading Strategy: Step by Step
The false breakout strategy trades against a confirmed failed breakout, with a stop loss beyond the trap and a fixed target of three times the risk (3R).
Step 1: Mark the Visible Reversal Zone
Before the market opens, mark VRZ Highs and VRZ Lows on the 30-minute chart. No valid zone, no trade.
Step 2: Wait for the Breakout Candle
On the 5-minute chart, wait for a candle to close fully outside the VRZ. Do nothing yet. You are waiting for the crowd to commit.
Step 3: Confirm the Failure Candle
The very next candle must close back inside the VRZ and beyond the breakout candle's range. Without both, there is no trade.
Step 4: Enter at the Failure Candle's Close
- Short (after a false upside breakout): enter at or near the close of the failure candle.
- Long (after a false breakdown): enter at or near the close of the failure candle.
Step 5: Place the Stop Loss Beyond the Trap
For a short, place the stop loss just above the high of the extreme candle (the candle that made the highest point of the trap). For a long, place it just below the low of the extreme candle. Never widen it. If price goes back beyond that point, the setup is wrong.
Step 6: Set a Fixed 3R Target
Target = Entry ± 3 × Risk
Use one fixed target instead of trailing indefinitely. It keeps decisions free of emotion and matches the speed of the reversal.
Step 7: Size the Position From Your Risk
Position size = Money you will risk ÷ Stop-loss distance
This keeps every loss the same size, whether the stop is wide or tight.

Caption: A short trade on a false breakout: entry, stop loss and a fixed 3R target.
Worked Example: Trading a False Breakout on an NSE Stock
The numbers below are hypothetical and show the method only. They are not a recommendation.
- VRZ High (30-minute chart): ₹1,500
- Breakout candle (5-minute): high ₹1,508, low ₹1,496, close ₹1,505
- Breakout extension (BEM): ₹5 (small)
- Failure candle close: ₹1,493 (inside the zone, below ₹1,496)
- Entry (short, intraday): ₹1,493
- Stop loss (above the extreme high of ₹1,508): ₹1,509
- Risk per share: ₹16
- Target (3R = ₹48 below entry): ₹1,445
- Money at risk (1% of ₹5,00,000): ₹5,000
- Position size: ₹5,000 ÷ ₹16 ≈ 312 shares
If the target is hit, the gain is about ₹15,000 before charges. If the stop is hit, the loss is about ₹5,000.
Indian market note: in the NSE cash segment, short selling is allowed only intraday. To hold a short overnight, traders use stock futures or options. Long trades after a false breakdown can be held in cash delivery.
Why a 3R Target Works Even If You Lose More Trades Than You Win
Expectancy (E) = (Win rate × Reward-to-risk) − (Loss rate × 1)
With a 45% win rate and a 3R target:
E = (0.45 × 3) − (0.55 × 1) = 1.35 − 0.55 = +0.80R per trade
So even when fewer than half the trades win, the average trade still returns +0.8R over a long series. That is the edge in trading false breakouts: small, fixed losses and larger, fixed wins. Results in live markets will vary.
Real Chart Examples: False Breakouts on Nifty & BankNifty on 27th September 2026
The two examples below show the same rules on real, past charts. They are for education only and are not trade recommendations.
Example 1: A False Upside Breakout (Bull Trap)

Example 2: A False Breakdown (Bear Trap)

What Is the Best Indicator for False Breakouts?
No indicator can reliably predict a false breakout before it happens. Indicators are built from past prices, so they react after the move. The most dependable signal is price action: the close of the failure candle at a meaningful zone.
The BOF approach deliberately uses no indicators. Candle closes, a structural zone and the failure candle's break of the breakout candle give a clear yes or no. That also makes the rules easy to test and to automate.
False Breakouts in Trending vs Ranging Markets
The market's mood decides which false breakouts to trade.
- Uptrend: trade only false breakdowns (long trades) at a VRZ Low. Shorting false breakouts against a strong uptrend fails more often.
- Downtrend: trade only false upside breakouts (short trades) at a VRZ High.
- Sideways range: false breakouts work best here. Price tests the zones on both sides again and again, pokes out on stop-loss orders, and snaps back inside.
Timeframes for Intraday, Swing and Positional Trading
- Intraday: zones on the 30-minute chart, breakout and failure on the 5-minute chart. Hold for minutes to hours.
- Swing: zones on the daily chart, breakout and failure on the 1-hour chart. Hold for days.
- Positional: zones on the weekly chart, breakout and failure on the daily chart. Hold for weeks.
The intraday pairing comes from the research. Swing and positional traders apply the same rules one step higher.
When Not to Trade False Breakouts
- During high-impact news: company results, RBI policy, Union Budget day, major global data
- In illiquid stocks or very quiet sessions
- When candles are unusually large, which makes the stop loss too wide and the 3R target too far
7 Common Mistakes When Trading False Breakouts
- Entering before the failure candle closes. Shorting a breakout because you think it will fail. Wait for rule 3.
- Counting wicks as breakouts. Only a full candle close outside the zone is a breakout.
- Using calendar levels instead of reversal zones. PDH and PDL attract crowds but prove nothing. Use VRZ.
- Trading big breakout extensions. A large BEM means real strength; those breakouts often continue.
- Widening the stop loss. Once it is set beyond the extreme candle, it never moves further away.
- Trading the same zone again and again. Take only one false breakout per zone per side. Repeated trades in a choppy zone add losses.
- Fighting a strong trend. In an uptrend, trade long setups only; in a downtrend, short setups only.
How to Avoid Getting Trapped by False Breakouts
If you trade breakouts, these habits keep you out of most traps:
- Wait for the candle close. Never enter on a wick or in the middle of a candle.
- Watch the next candle. If it closes back inside the level, exit early instead of hoping.
- Prefer a retest. Enter after price breaks out, pulls back to the level and holds it.
- Avoid obvious levels. The more obvious the level, the more stop losses sit around it.
- Check the bigger picture. A breakout against the Nifty trend or the sector trend fails more often.
- Skip news candles. Let the first reaction to big news settle before trading a break.
Find False Breakouts Automatically With BOF Scanner
Spotting false breakouts by hand means watching dozens of charts all day and waiting for the exact candle close. The BOF Scanner does that for you.
BOF Scanner is an automated tool that finds breakout failures around Visible Reversal Zones in stocks, indices and commodities. It:
- Scans the market every 5 minutes and sends a push notification when a false breakout setup appears
- Shows a colour-coded heatmap of breakout failure activity across sectors
- Lets you build favourites lists of the stocks and commodities you trade
- Covers every style: intraday alerts for quick reversals, swing alerts for multi-day moves and daily alerts for positional trades
Stop chasing breakouts. Start catching the failures. Download BOF Scanner and get your next false breakout alert without staring at charts.
False Breakout FAQs
What is a false breakout?
A false breakout is a move beyond support or resistance that fails to hold. Price returns inside its old range, trapping traders who entered the breakout, and often reverses sharply.
What is the difference between a false breakout and a fake breakout?
There is no difference. False breakout, fake breakout, failed breakout and fakeout all describe a breakout that does not follow through.
How do you identify a false breakout?
Look for a candle that closes beyond a Visible Reversal Zone, followed by a candle that closes back inside the zone and beyond the breakout candle's range. A small breakout extension and clean candles raise the probability.
Why do most breakouts fail?
Many breakouts are driven by stop-loss orders, fear of missing out and crowds at obvious levels, not by lasting buying or selling. Once those orders are filled, price falls back.
What is the best indicator for false breakouts?
No indicator predicts false breakouts reliably. Most dependable signal is the failure candle's close at a meaningful zone.
How do you trade a false breakout?
Enter at the close of the failure candle, place the stop loss beyond the extreme of the trap, and target three times your risk. Size the position so each loss is a fixed amount.
Where should the stop loss go on a false breakout trade?
For a short, just above the high of the extreme candle. For a long, just below the low of the extreme candle. Never widen it.
What timeframe is best for trading false breakouts?
For intraday trading, mark zones on the 30-minute chart and trade on the 5-minute chart. Swing traders can use daily zones with 1-hour entries.
Is a false breakout the same as a bull trap?
A bull trap is one type of false breakout: a failed upside breakout. A bear trap is the other: a failed breakdown below support.
Can false breakouts be traded on Nifty and Bank Nifty?
Yes. False breakouts appear on indices, stocks, commodities, currencies and crypto. The research behind the BOF model studied NIFTY, SENSEX, Dow Jones 30, XAUUSD and Bitcoin.
Key Takeaways
- A false breakout (fake breakout) is a breakout that closes back inside its level instead of following through.
- The strongest false breakouts form at Visible Reversal Zones, not at calendar levels like PDH and PDL.
- Confirm the setup with the failure candle: it must close inside the zone and beyond the breakout candle's range.
- Trade with a structural stop loss at the extreme candle and a fixed 3R target.
- Trapped traders are the fuel behind the sharp reversal.
Conclusion
Most traders lose money chasing breakouts. The false breakout turns that crowd behaviour into a clear, rule-based trade. Mark your Visible Reversal Zones, wait for the failure candle to confirm, and let the trapped traders do the work. Start by journaling every false breakout you see this week. When you are ready, let BOF Scanner watch the charts for you.
About the author: Suresh Duraisamy (B.E., Computer Science Engineering) is the author of the research paper Breakout Failure in Financial Markets: A Behavioural and Structural Analysis Using Visible Reversal Zones.
Disclaimer: This article is for educational purposes only and is not investment advice or a recommendation to buy or sell any security. Trading in equities and derivatives involves a high risk of loss. All examples are illustrative. Consult a SEBI-registered investment adviser before making trading decisions.