Scanner Viewer

Select a trading day to view all Scanner results, chart evidence, and market explanations.

04 03 02 01

September 04, 2026

7 Scanners Available

NIFTY BANK
Index
Success
VRZ High Intraday Sep 04, 2026
What Triggered NIFTY BANK’s 0.42% Bearish BOF Move?
View Full Analysis β†’

πŸ’₯ What Triggered NIFTY BANK’s 0.42% Bearish BOF Move? πŸ“‰


πŸ“Œ Instrument: Nifty Bank

🏦 Sector: Banking & Financial Services

πŸ“‰ Trade Type: Intraday

⏱️ Trading Time Frame: 5 Minutes

🎯 Setup Type: Bearish Breakout Failure (BOF)

🚩 Zone: VRZ High – β‚Ή57,613.05

πŸ“‰ Trade Direction: Short


BOF Scanner App identified this setup at 11:45 am


🚨 Failed Breakout & Seller Dominance

πŸ“ˆ Nifty Bank rallied toward the β‚Ή57,613.05 VRZ High and attempted to push through the resistance zone.

⚠️ The breakout failed to sustain as buyers lost momentum near the VRZ High.

πŸ”΄ Sellers stepped in and pushed price back below the resistance.

πŸ“‰ The rejection developed into a clear bearish reversal, with price forming lower highs and lower lows.

🎯 The downside move eventually reached the β‚Ή57,369.65 area.


πŸ”» Bearish Trend Gains Strength

πŸ”Ί Buyers initially controlled the upward move toward VRZ High.

βš”οΈ At the resistance zone, selling pressure increased.

πŸ”΄ The failed breakout trapped buyers at higher levels.

πŸ“‰ Price gradually shifted into a bearish structure as sellers gained control.

⚑ The 5-minute price action continued to support the downside move.


🎭 The Psychology of the Reversal

🟒 Buyers expected a sustained breakout above VRZ High.

⚠️ Instead, price failed to hold the higher levels.

😰 Breakout buyers became trapped as the market reversed.

πŸ”΄ Sellers used the failed breakout to regain control.

πŸ“‰ The resulting liquidation and fresh selling pressure accelerated the bearish move.


βš”οΈ The Battle Around VRZ High

🎯 β‚Ή57,613.05 became the key resistance level.

πŸ“ˆ Buyers challenged the zone, but failed to maintain the breakout.

πŸ”» Sellers rejected higher prices and forced a move back below VRZ High.

πŸ”„ This created the classic Breakout Failure structure.

πŸ’₯ Continued selling pressure then drove Nifty Bank toward the lower levels.


⚑ What Made the BOF Successful?

🎯 Clear rejection at VRZ High with strong selling pressure.

⚠️ Failed breakout above resistance triggered the bearish reversal.

πŸ”’ Breakout buyers were trapped as price moved back below the key zone.

πŸ“‰ Strong bearish price structure confirmed seller dominance.

⚑ Sustained selling momentum pushed price toward the downside target.

πŸ“Š Clean 5-minute BOF confirmation supported the bearish trade setup.

πŸ’° Effective 1:3 Risk-Reward provided strong reward potential with defined risk.

πŸ† Overall: A well-structured BOF setup combining resistance rejection, trapped buyers, and strong downside momentum.


🧭 Market Momentum Change

πŸ“ˆ Buyers Lose Control: Upward momentum weakened near the VRZ High.

⚠️ Breakout Failure: Price failed to sustain above the resistance zone.

πŸ”„ Trend Reversal: Momentum shifted from buyers to sellers.

πŸ“‰ Selling Pressure Builds: Bearish candles confirmed increasing downside strength.

⚑ Sellers Take Over: Sustained selling pushed price toward lower levels.

🎯 Downside Expansion: The bearish momentum supported the 0.42% move with 1:3 RR.


🚨 Live BOF Signal Tracker


🎯 Identify VRZ High & VRZ Low breakout failures in real time.

πŸ“ Instantly access stock, signal type, trigger price, and alert timing.

⚑ Monitor fresh Intraday & Swing BOF setups with live scanner alerts.


⚑ Trade Recap

🎯 VRZ High: β‚Ή57,613.05 β€” Key resistance zone where the breakout failure developed.

πŸ“‰ Trade Direction: Bearish / Short β€” Selling pressure strengthened after the rejection.

⚑ Price Action: Failed breakout followed by sustained downside momentum.

πŸ’₯ Outcome: 0.42% Bearish Move β€” Price moved decisively lower from the VRZ High.

βš–οΈ Risk-Reward: 1:3 RR β€” Strong reward potential with defined risk.

πŸ† Final Result: Nifty Bank delivered a clean VRZ High Breakout Failure, with rejection triggering sustained selling pressure and a 0.42% downside move with 1:3 RR.

ETERNAL
Retail
Success
VRZ Low Intraday Sep 04, 2026
ETERNAL Market Analysis | Failed Breakdown at VRZ Low Triggers Strong Bullish Reversal
View Full Analysis β†’

πŸš€ ETERNAL Market Analysis | Failed Breakdown at VRZ Low Triggers Strong Bullish Reversal


πŸ“Œ BOF Setup Details

πŸ”Ή Stock Name: Eternal Ltd. (ETERNAL)

🏒 Sector: Consumer Services

πŸ“ˆ Trade Type: Intraday

πŸ•’ VRZ Marking Time Frame: 30 Minutes

⏱️ Trading Time Frame: 5 Minutes

🎯 Setup Type: Bullish Breakout Failure (BOF) at VRZ Low

🚩 VRZ Low: β‚Ή321.20

πŸ“ˆ Trade Direction: Bullish / Long


BOF Scanner App identified this setup at 03:15 pm


πŸ”„ Failed Breakdown & Bullish Reversal

πŸ“‰ Sellers initially pushed price beneath β‚Ή321.20, attempting to extend the existing downside trend.

πŸ”„ However, the breakdown failed as buyers stepped in and drove price back above the VRZ Low.

πŸ“ˆ This shift from breakdown to recovery created a clear bullish reversal structure.


🧠 BOF Price Action Psychology

πŸ’­ The failed breakdown indicated that sellers could not maintain control below the support zone.

βš”οΈ Traders positioned for further downside faced increasing pressure as price reclaimed the broken level.

🟒 Once buyers regained control, the failed breakdown became a potential signal for short-term upside momentum.


🎯 Trade Execution & Risk Management

πŸ“ The β‚Ή321.20 VRZ Low acted as the primary reference level for the bullish BOF setup.

πŸ›‘οΈ Risk could be structured around the failed breakdown area, keeping the trade parameters clearly defined.

βš–οΈ The setup offered a favorable 1:3 risk-to-reward ratio, providing attractive reward potential against the defined risk.


πŸ“ˆ Bullish Momentum Takes Over

πŸš€ After reclaiming the VRZ Low, ETERNAL began showing stronger buying momentum.

πŸ”₯ Price moved from the reversal zone toward the β‚Ή322+ area, confirming the recovery after the failed breakdown.

πŸ“Š The price action demonstrated how a rejected support breakdown can quickly develop into a bullish intraday move.


🧩 Why Did ETERNAL’s BOF Setup Work?

πŸ” The key factor was the failure to sustain price below β‚Ή321.20.

πŸ“ˆ Buyers successfully reclaimed the VRZ Low, while sellers failed to continue the breakdown.

⚑ This combination of support rejection, level reclaim, and bullish price action strengthened the BOF setup.


🧠 Trading Mindset

🎯 A failed breakdown should not automatically be treated as continued bearishness.

πŸ’‘ Traders can focus on how price reacts after breaking an important level and whether the breakout or breakdown actually sustains.

πŸ›‘οΈ Maintaining discipline and predefined risk is essential when trading reversal setups.


πŸ”‘ Key Trading Takeaway

πŸ“Œ The ETERNAL setup demonstrates the importance of identifying failed breakdowns at key VRZ levels.

πŸ”„ When sellers fail to sustain a move below support and buyers reclaim the zone, the market structure can shift rapidly.

πŸ† Combining VRZ levels + BOF confirmation + price action + risk management created a structured bullish opportunity.


🏁 Final Strategy Insight

πŸ”₯ ETERNAL delivered a clean VRZ Low Breakout Failure, where the breakdown below β‚Ή321.20 failed and price reversed higher.

πŸ“ˆ 0.48% Bullish Move | 1:3 RR β€” a strong example of how failed support breakdowns can create short-term bullish BOF opportunities.


πŸ’° Trade Performance

πŸ† The successful BOF setup captured a 0.48% bullish move from the reversal zone.

🎯 The trade delivered a solid 1:3 RR, highlighting the importance of maintaining a structured risk-to-reward approach.

πŸ’Ž Despite the relatively small percentage move, the defined risk structure created a meaningful trading opportunity.


πŸ… ETERNAL BOF Highlights

πŸ”Έ VRZ Low: β‚Ή321.20 β€” Key support zone where the failed breakdown developed.

🟒 Setup: Bullish BOF β€” Breakdown failure followed by a strong bullish reversal.

⏱️ Time Frame: 5 Minutes β€” Intraday chart capturing the complete reversal setup.

πŸ“ˆ Move: 0.48% β€” Upside recovery following the VRZ Low rejection.

βš–οΈ Risk-to-Reward: 1:3 RR β€” Favorable reward potential against the defined trading risk.

πŸš€ Price Action: Failed Breakdown + VRZ Low Reclaim β€” Buyers regained control after sellers failed to sustain the breakdown.

πŸ† Result: Successful Bullish BOF Setup β€” A clean support rejection that generated a strong intraday recovery.

NIFTY FIN SERVICE
Index
Success
VRZ High Intraday Sep 04, 2026
NIFTY FIN SERVICE BOF Success Analysis | 0.36% Bearish Move with 1:3 RR
View Full Analysis β†’

πŸ“‰ NIFTY FIN SERVICE BOF Success Analysis | 0.36% Bearish Move with 1:3 RR


πŸ”Ή Index: NIFTY FIN SERVICE

🏦 Segment: Financial Services

πŸ“‰ Trade Type: Intraday

πŸ•’ VRZ Marking Time Frame: 30 Minutes

⏱️ Trading Time Frame: 5 Minutes

🎯 Setup Type: Breakout Failure (BOF)

πŸ”΄ Zone: VRZ High – 26,160.65


BOF Scanner App identified this setup at 11:45 am


πŸ” Breakout Failure Confirmation

πŸ”Ί NIFTY FIN SERVICE tested the VRZ High, where buyers attempted to sustain a breakout above resistance.

⚠️ The breakout failed to hold as price moved back below the VRZ High.

πŸ”» This rejection confirmed the bearish BOF setup and created an intraday short opportunity.


πŸ“‰ Bearish Price Action

πŸ”΄ Sellers gained control after the failed breakout.

πŸ“Š Price remained below the VRZ High, forming a gradual bearish structure.

🎯 The setup delivered a 0.36% downside move with a 1:3 Risk-Reward.


βš”οΈ Buyer vs Seller Activity

🟒 Buyers: Attempted to push price above the VRZ High.

🟑 Breakout Traders: Became trapped when the breakout failed.

πŸ”΄ Sellers: Took control after the rejection and drove price lower.


🧠 Market Sentiment Shift

🎭 The breakout initially created bullish expectations.

🚨 Failure to sustain above resistance weakened buyer confidence.

πŸ“‰ Selling pressure increased and shifted market control toward sellers.


πŸ” BOF Confirmation

🎯 The key confirmation came when price rejected the VRZ High at 26,160.65.

πŸ”„ Price sustained below the resistance zone, validating the failed breakout.

⚑ Continued downside follow-through strengthened the bearish setup.


πŸ’‘ BOF Trading Lessons

🚫 Failed Breakouts Can Trigger Reversals

A breakout without follow-through can quickly turn bearish.

🎯 Resistance Rejection Matters

The VRZ High rejection highlighted weakening buyer strength.

πŸ›‘οΈ Defined Risk Improves Execution

The VRZ High provided a clear invalidation reference.

⚑ Price Action Confirms Momentum

Sustained selling below resistance supported the downside move.


πŸ“Š Bearish Market Structure

πŸ“‰ After the rejection, NIFTY FIN SERVICE developed a sequence of lower highs and lower lows.

πŸ”΄ Price remained below the VRZ High as sellers maintained control.

🐻 The bearish structure supported continued downside momentum.


⚑ Momentum & Price Movement

🚨 Selling pressure increased following the failed breakout.

πŸ“‰ Price gradually moved away from the VRZ High and extended lower.

πŸ† The trade ultimately produced a 0.36% bearish move with a 1:3 RR.


πŸ“ˆ Trade Entry Analysis

πŸ”Έ The trade became actionable after NIFTY FIN SERVICE failed to sustain the breakout above 26,160.65.

πŸ“‰ Sellers regained control following the rejection.

βš–οΈ The confirmed BOF structure provided a disciplined intraday setup with defined risk.


πŸ† Trade Performance

πŸ”΄ Setup: Confirmed BOF

πŸ“‰ Direction: Intraday Bearish Reversal

🎯 Outcome: 0.36% Bearish Move

βš–οΈ Risk-Reward: 1:3 RR

πŸ”΄ Zone: VRZ High – 26,160.65

⏱️ Trading Time Frame: 5 Minutes

πŸ† Result: Successful Breakout Failure Trade with Bearish Follow-Through


πŸ”₯ Final Trading Insight

πŸ’‘ NIFTY FIN SERVICE demonstrated how a failed breakout at the VRZ High can shift control from buyers to sellers. The resistance rejection and bearish price action delivered a 0.36% downside move with a 1:3 Risk-Reward, highlighting the importance of BOF confirmation and disciplined execution. πŸ“‰πŸŽ―

KEI
Consumer Services
Failure
VRZ Low Intraday Sep 04, 2026
What Caused the KEIIND BOF Failure? | Failed VRZ Low Reclaim
View Full Analysis β†’

❓ What Caused the KEIIND BOF Failure? | Failed VRZ Low Reclaim


🧾 Stock & Setup Snapshot

πŸ“Œ Stock: KEI Industries Ltd (KEIIND)

🏭 Sector: Electrical Equipment / Cables & Wires

⏱️ Chart Time Frame: 5 Minutes

πŸ•’ VRZ Marking Time Frame: 30 Minutes

🟒 Reversal Zone: VRZ Low – β‚Ή4,982.20


🎯 Trade Setup Configuration

🧩 Setup Type: Breakout Failure (BOF)

πŸ“ Reference Zone: VRZ Low – β‚Ή4,982.20

πŸ“ˆ Expected Direction: Buy

🚫 Outcome: BOF Failed / Stop Loss Triggered


BOF Scanner App identified this setup at 09:35 am


🧭 Market Trend Overview

KEIIND initially traded around the β‚Ή4,982 VRZ Low, but buyers were unable to maintain strength above the reversal zone.

Price gradually moved lower and eventually remained well below the VRZ Low, indicating continued seller dominance.

The expected bullish BOF reversal failed to develop as buyers could not reclaim and sustain the key level.


🧩 Price Movement Assessment

The session developed with a clear bearish structure after the initial opening volatility.

πŸ”» Price moved below the β‚Ή4,982 VRZ Low.

πŸ“‰ Sellers continued producing lower highs and lower lows.

⚠️ Recovery attempts remained weak.

πŸ”„ Price repeatedly failed to regain the reversal zone.

πŸ“ The VRZ Low effectively remained overhead resistance rather than turning into support.


βš™οΈ Trade Execution Review

The bullish BOF idea depended on a failed breakdown followed by a strong reclaim of the β‚Ή4,982 VRZ Low.

However, the required confirmation never materialized.

Instead, price continued accepting lower levels and selling pressure remained dominant. Without a sustained reclaim above the VRZ Low, the bullish reversal thesis lost strength and the predefined risk level was triggered.


🚨 Primary Failure Factors

The setup failed because buyers could not reclaim and hold the VRZ Low.


πŸ”» Key Warning Signals

❌ No sustained bullish reclaim above β‚Ή4,982.

❌ Persistent trading below the reversal zone.

❌ Lower highs continued forming.

❌ Selling pressure remained dominant.

❌ Recovery attempts lacked strong follow-through.

❌ The VRZ Low continued acting as resistance.


πŸ”» Bearish Candle Structure

The chart highlights a failed bullish reversal attempt followed by sustained weakness.

🟒 Early buying created a sharp opening move.

πŸ”΄ Sellers quickly absorbed the buying pressure.

πŸ“‰ Price slipped progressively below the VRZ Low.

⚠️ Mid-session consolidation failed to produce a meaningful bullish breakout.

πŸ”» The later price action continued toward lower levels.

πŸ“Š Overall momentum remained bearish throughout most of the session.


πŸ’‘ Trading Lessons From the Failure

⚠️ A strong bounce alone does not confirm a bullish BOF.

πŸ“ The VRZ Low must be reclaimed with convincing price action.

πŸ” Sustained acceptance below the zone signals continued seller control.

πŸ›‘ Stop losses are essential when the expected reversal does not materialize.

🎯 Waiting for confirmation helps avoid premature reversal entries.


🧠 Trader Psychology

This setup demonstrates why traders should avoid anticipating a reversal simply because price approaches a predefined VRZ.

A bullish BOF requires evidence of trapped sellers and renewed buyer control. When that evidence is absent, patience becomes more valuable than prediction.

βœ… Follow the predefined setup.

βœ… Wait for confirmation.

βœ… Accept invalidation without emotion.

βœ… Protect capital for the next opportunity.


πŸ” Risk Management & Capital Protection

πŸ›‘οΈ The trade was structured around predefined risk.

πŸ“Œ Entry was based on the BOF framework.

⚠️ The setup was invalidated when bullish confirmation failed.

πŸ›‘ Stop loss limited the potential downside.

πŸ’° Controlled losses help preserve capital for future setups.


🚦 Final Price Action Verdict

πŸ“‰ The KEIIND BOF Failure shows that a potential reversal zone does not automatically become support.

⚠️ Without a sustained reclaim of the β‚Ή4,982 VRZ Low, the bullish BOF lacked the confirmation required for continuation.

🧠 The key lesson is simple: wait for price to prove the reversal instead of assuming it will happen.


πŸ›‘ Position Closure Status

🚫 BOF Failed | πŸ›‘ Stop Loss Triggered | KEIIND (5-Minute Chart) | πŸ“ VRZ Low β‚Ή4,982.20 β€’ πŸ“Š Failed Bullish Reversal β€’ πŸ” Controlled Risk β€’ 🧠 Trading Discipline Maintained

OBEROIRLTY
Realty
Success
VRZ Low Intraday Sep 04, 2026
OBEROI REALTY Market Analysis | Failed Breakout at VRZ High Triggers Strong Bearish Reversal
View Full Analysis β†’

πŸ“Š OBEROI REALTY Market Analysis | Failed Breakout at VRZ High Triggers Strong Bearish Reversal


πŸ”Ή Stock Name: Oberoi Realty Ltd. (OBEROIRLTY)

🏒 Sector: Real Estate

πŸ“‰ Trade Type: Intraday

πŸ•’ VRZ Marking Time Frame: 30 Minutes

⏱️ Trading Time Frame: 5 Minutes

🎯 Setup Type: Bearish Breakout Failure (BOF) at VRZ High

🚩 VRZ High: β‚Ή1,929.80


BOF Scanner App identified this setup at 10:35 am


πŸ“‘ BOF Scanner Identifies the Opportunity

⚑ Price pushed into the β‚Ή1,929.80 VRZ High resistance zone, creating the conditions for a potential breakout failure.

πŸ” The upside move failed to sustain above the VRZ High, signaling that buyers were losing control near resistance.


πŸ”„ Failed Breakout & Bearish Reversal

πŸ“‰ After testing the VRZ High zone, price reversed sharply and began forming lower highs and lower lows.

🐻 This rejection confirmed a bearish BOF structure as selling pressure started taking control.


🧠 BOF Price Action Psychology

πŸ’­ Buyers attempting the breakout were unable to maintain higher prices above resistance.

βš”οΈ As the breakout failed, trapped buyers faced increasing pressure while sellers gained momentum, accelerating the reversal.


🎯 Trade Execution & Risk Management

πŸ“ The β‚Ή1,929.80 VRZ High provided a clear reference level for the bearish setup.

πŸ›‘οΈ With defined risk around the failed breakout zone, the trade offered a favorable 1:7 risk-to-reward opportunity.


πŸ“‰ Downside Momentum Builds

πŸ”₯ Selling pressure intensified as OBEROIRLTY moved steadily lower from the VRZ High rejection.

πŸš€ The bearish move extended toward the β‚Ή1,875–₹1,876 area, producing a strong downside expansion.


🎯 Profit & RR Results

πŸ† The setup delivered an impressive 2.70% bearish move.

βš–οΈ With 1:7 RR, the trade demonstrated strong reward potential relative to the defined risk.


πŸ”‘ Essential Trading Lesson

πŸ’‘ A failed breakout at a major resistance zone can quickly shift market sentiment from bullish to bearish.

πŸ“Š Combining VRZ levels, breakout-failure confirmation, price action, and disciplined risk management can create a structured BOF trading setup.


🏁 Final BOF Strategy Insight

πŸš€ OBEROIRLTY showcased a clean VRZ High Breakout Failure, followed by sustained bearish momentum.

🎯 2.70% Move | 1:7 RR β€” a strong example of how a failed resistance breakout can develop into a high-reward bearish BOF setup.


🎯 Mindset Behind the Trade

🎯 Stay Disciplined: Follow the trading plan instead of reacting emotionally to every price move.

βš–οΈ Respect Risk: Focus on controlled risk and consistent execution rather than chasing every opportunity.

🧘 Control Emotions: Avoid fear, greed, and impulsive decisions when the market moves unexpectedly.

πŸ“Š Trust the Setup: Let confirmed price action guide the trade instead of forcing a prediction.

πŸ† Think Long-Term: One trade does not define successβ€”consistency and discipline do.


πŸ… OBEROIRLTY BOF Highlights

πŸ”Έ VRZ High: β‚Ή1,929.80

🟣 Setup: Bearish BOF

⏱️ Time Frame: 5 Minutes

πŸ”» Move: 2.70%

πŸ’Ž Risk-to-Reward: 1:7 RR

πŸ† Result: Successful Bearish BOF Setup

AUROPHARMA
Pharma
Success
VRZ Low Intraday Sep 04, 2026
AUROPHARMA BOF Case Study | Strong Bullish Price Action | 1:4 RR
View Full Analysis β†’

🟒 AUROPHARMA BOF Case Study | Strong Bullish Price Action | 1:4 RR


πŸ“Œ Stock & Setup Details

πŸ”Ή Stock: Aurobindo Pharma Ltd. (AUROPHARMA)

πŸ’Š Sector: Pharmaceuticals

πŸ“ˆ Trade Type: Intraday

πŸ•’ VRZ Marking Time Frame: 30 Minutes

⏱️ Trading Time Frame: 5 Minutes

🎯 Setup Type: Breakdown Failure (BOF)

🟒 Zone: VRZ Low – β‚Ή1,625.60


BOF Scanner App identified this setup at 09:40 am


🚨 Breakdown Failure Trigger

πŸ”» AUROPHARMA tested the VRZ Low, where sellers attempted to push price below the support zone.

⚠️ The breakdown failed to sustain as price quickly recovered above the VRZ Low.

🟒 This rejection confirmed the bullish BOF setup and created an intraday reversal opportunity.


πŸ“ˆ Bullish Price Action

🟒 Buyers stepped in strongly after the failed breakdown.

πŸ“Š Price reclaimed the β‚Ή1,625.60 VRZ Low and moved higher with improving momentum.

πŸš€ The setup delivered a 1.97% bullish move with a strong 1:4 Risk-Reward.


βš”οΈ Buyer vs Seller Activity

πŸ”΄ Sellers: Attempted to break below the VRZ Low.

🟑 Breakdown Traders: Became trapped as price reclaimed the support zone.

🟒 Buyers: Regained control and drove the bullish reversal.


🧠 Market Sentiment Shift

🎭 The initial breakdown created bearish expectations.

🚨 The failure to sustain below support weakened seller confidence.

πŸ“ˆ The recovery above the VRZ Low shifted market sentiment toward the buyers.


πŸ” BOF Confirmation

🎯 The key confirmation came when AUROPHARMA reclaimed β‚Ή1,625.60.

πŸ”„ Sustained trading above the zone validated the breakdown failure.

⚑ Continued bullish follow-through strengthened the reversal setup.


πŸ’‘ BOF Trading Lessons

🚫 Failed Breakdowns Can Reverse Quickly

A breakdown without follow-through can trap sellers and trigger an upside reversal.

🎯 Support Reclaim Matters

Regaining the VRZ Low highlighted renewed buyer strength.

πŸ›‘οΈ Defined Risk Supports Discipline

The VRZ Low provided a clear reference for setup invalidation.

⚑ Follow-Through Builds Momentum

Once buyers regained control, the bullish move extended significantly.


πŸ“Š Bullish Market Structure

πŸ“ˆ After reclaiming the VRZ Low, AUROPHARMA developed a stronger bullish structure.

🟒 Buyers maintained control as price moved away from the support zone.

πŸš€ The improving structure supported continued upside momentum.


πŸ”₯ Trade Momentum

⚑ Buying pressure increased following the failed breakdown.

πŸ“ˆ Price moved steadily higher and reached the upper part of the marked range.

πŸ† The setup ultimately produced a 1.97% bullish move with a 1:4 RR.


🎯 Trade Execution Review

πŸ”Έ The trade became actionable after AUROPHARMA failed to sustain the breakdown below β‚Ή1,625.60.

πŸ“ˆ Buyers reclaimed the zone and maintained bullish control.

βš–οΈ The confirmed BOF structure delivered a disciplined intraday opportunity with strong reward potential.


Heatmap


πŸ“ˆ Track sector-wise BOF signals and monitor market activity at a glance.

πŸ” Select any sector to discover triggered VRZ High & VRZ Low stocks.

⚑ Spot active BOF zones and quickly identify potential trading opportunities.


πŸ“ Performance Review

🟒 Setup: Confirmed BOF

πŸ“ˆ Direction: Intraday Bullish Reversal

🎯 Outcome: 1.97% Bullish Move

βš–οΈ Risk-Reward: 1:4 RR

🟒 Zone: VRZ Low – β‚Ή1,625.60

⏱️ Trading Time Frame: 5 Minutes

πŸš€ Result: Successful Breakdown Failure Trade with Strong Bullish Follow-Through

HCLTECH
IT management
Success
VRZ High Intraday Sep 04, 2026
HCLTECH BOF Success: 2.39% Bearish Move | 5-Minute Chart
View Full Analysis β†’

πŸ“‰ HCLTECH BOF Success: 2.39% Bearish Move | 5-Minute Chart


πŸ“Œ Stock Name: HCL Technologies Ltd. (HCLTECH)

πŸ’» Sector: Information Technology / IT Services

πŸ“‰ Trade Type: Intraday

⏱️ Trading Time Frame: 5 Minutes

🎯 Setup Type: Breakout Failure (BOF) at VRZ High

🚩 Zone: VRZ High – β‚Ή1,323.00

πŸ“‰ Trade Direction: Bearish / Short


BOF Scanner App identified this setup at 09:25 am


πŸ”„ Failed Breakout & Sharp Bearish Reversal

πŸ”Ί HCLTECH moved higher and tested the β‚Ή1,323.00 VRZ High.

⚠️ Buyers attempted to push price above the key resistance, but the breakout failed to sustain.

πŸ”΄ Strong selling pressure emerged near the VRZ High, forcing price back below the resistance.

πŸ“‰ The following candles developed a clear bearish structure as sellers gradually took control.

πŸ”„ The failed breakout trapped buyers near the resistance and strengthened the bearish reversal.

🎯 Price continued lower toward the β‚Ή1,291.40 downside area.

πŸš€ The BOF setup delivered a 2.39% bearish move with a solid 1:3 RR.


πŸ“‰ Bearish Momentum Takes Control

πŸ”Ž Price approached the VRZ High following an upward move.

🟒 Buyers attempted to establish control above β‚Ή1,323.00.

⚠️ The breakout lacked sustained buying follow-through.

πŸ”΄ Sellers quickly rejected higher prices around the resistance zone.

πŸ“‰ HCLTECH then formed a series of lower highs and lower lows.

⚑ Selling momentum remained dominant throughout the session.

🎯 Price eventually moved toward the β‚Ή1,291.40 downside objective.


🧠 The Psychology Behind the Reversal

Initially, traders could have expected:

🟒 A confirmed breakout above β‚Ή1,323.00.

πŸ“ˆ Further upside continuation.

πŸ‚ Buyers to remain in control.

But the market changed direction.

⚠️ The breakout failed to hold above resistance.

😰 Breakout buyers became trapped at higher levels.

πŸ”΄ Sellers stepped in near the VRZ High.

πŸ”„ Trapped buyers started exiting as price moved lower.

πŸ“‰ Fresh selling pressure accelerated the bearish move.


πŸ›‘οΈ The Battle at VRZ High

🟒 Buyers challenged the β‚Ή1,323.00 resistance.

πŸ”΄ Sellers strongly defended the VRZ High.

βš–οΈ The breakout attempt failed to attract sustained demand.

⚠️ Price quickly returned below the key zone.

πŸ”„ This rejection confirmed the Breakout Failure structure.

πŸ“‰ Sellers maintained control as the downside move expanded.

🎯 The bearish momentum carried HCLTECH toward the lower target area.


πŸ† What Made HCLTECH’s BOF Setup Successful?

🎯 VRZ High Rejection

The β‚Ή1,323.00 VRZ High acted as a strong resistance area where sellers emerged.

⚑ Breakout Failure

Buyers failed to sustain price above the resistance.

🚨 Bearish Confirmation

Price moved back below the VRZ High, confirming the failed breakout.

πŸ“‰ Strong Selling Structure

Lower highs and lower lows reinforced the bearish momentum.

πŸ”’ Defined Risk

The β‚Ή1,331.40 area provided a clear invalidation reference above the failed breakout.

πŸ’° Strong Reward-to-Risk

The setup delivered a 2.39% bearish move with a 1:3 RR.


πŸ“Š Momentum Shift Analysis

πŸ“ˆ Before Rejection: Buyers pushed HCLTECH toward the VRZ High.

⚠️ At the Zone: Price tested β‚Ή1,323.00, but the breakout failed.

πŸ”΄ After Rejection: Sellers regained control and drove price lower.

πŸ“‰ Confirmation: Consecutive bearish price action strengthened the reversal.

🎯 Final Move: Price declined toward the β‚Ή1,291.40 downside objective.


πŸ“ˆ Trade Results

🎯 Entry: Short position initiated after the failed breakout and bearish rejection at the VRZ High.

πŸ›‘ Stop Loss: Positioned above the failed breakout area near β‚Ή1,331.40.

πŸ“‰ Outcome: 2.39% Downside Move

βš–οΈ Risk-Reward: 1:3 RR

πŸ’Ž Trade Quality: High-quality bearish BOF setup supported by VRZ High rejection, trapped breakout buyers, sustained selling pressure, and a clear bearish price structure.

πŸ“Š Result: HCLTECH successfully followed the bearish BOF structure and delivered the projected downside move.

βœ… Final Result: Bearish BOF Confirmed | 2.39% Downside | 1:3 RR Achieved | HCLTECH

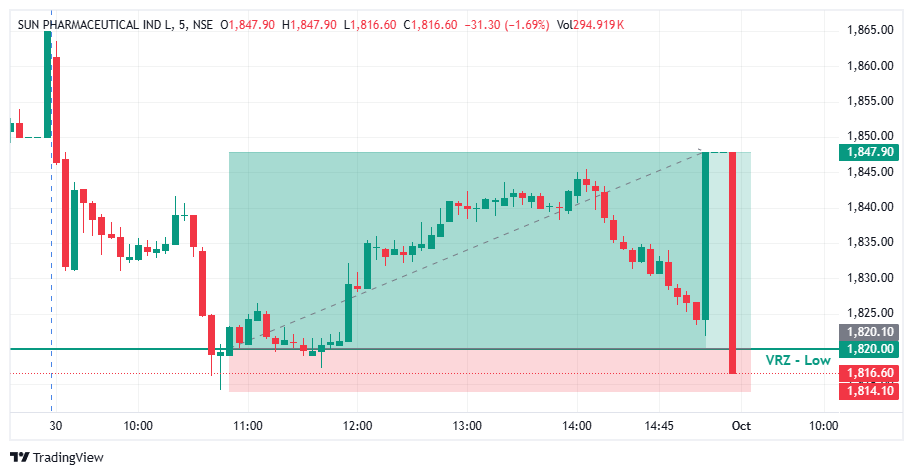
Scanner Chart Preview