
Select a trading day to view all Scanner results, chart evidence, and market explanations.
4 Scanners Available
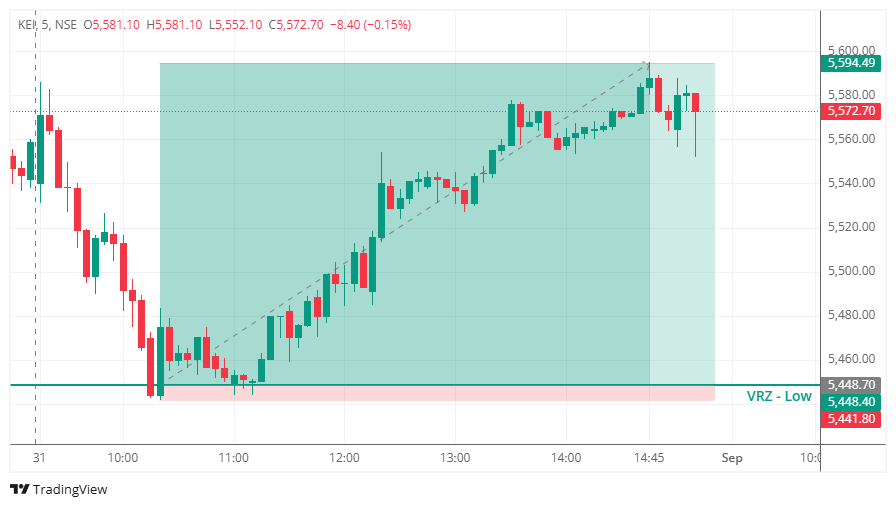

🔻 KEI initially moved lower and approached the ₹5,448.40 VRZ Low.
⚠️ Sellers pushed price toward and briefly below the key support zone, creating a potential bearish breakdown.
🔄 The breakdown failed as buyers strongly defended the VRZ Low.
🟢 Price reclaimed the key zone and started forming a bullish reversal structure.
📈 Subsequent candles showed consistent buying pressure with higher highs and higher lows.
🎯 KEI continued climbing toward the upside objective around ₹5,594.49.
🚀 The successful BOF setup delivered a 2.68% bullish outcome with an exceptional 1:21 RR.
🔎 Price remained under selling pressure during the early part of the session.
🔴 Sellers drove KEI down toward the ₹5,448.40 VRZ Low.
⚠️ The downside breakdown failed to attract sustained selling.
🟢 Buyers stepped in aggressively around the VRZ Low.
🔄 Price reclaimed the support and established a clear bullish structure.
📊 A series of higher lows and higher highs confirmed improving momentum.
🚀 Buying pressure continued throughout the session, pushing KEI toward the projected upside zone.
Initially, traders could have expected:
🔴 A confirmed breakdown below the VRZ Low.
📉 Further downside continuation.
🐻 Sellers to remain in control.
But the market quickly changed the narrative.
⚠️ The breakdown failed to sustain.
😰 Breakdown sellers became trapped below the key zone.
🟢 Buyers reclaimed the VRZ Low and regained control.
🔄 Trapped sellers were forced to exit as price moved higher.
📈 Fresh buying followed, accelerating the bullish reversal.
🚀 The failed breakdown ultimately transformed into a strong bullish BOF setup.
🔴 Sellers attempted to push KEI below ₹5,448.40.
🟢 Buyers strongly defended the VRZ Low.
⚖️ The battle between buyers and sellers intensified around the support zone.
⚠️ Failure to sustain below the VRZ Low weakened the bearish setup.
🔄 The reclaim confirmed the Breakout Failure.
📈 Buyers gradually took complete control of the price structure.
🚀 Sustained buying pressure carried KEI significantly higher from the reversal zone.
🎯 VRZ Low Held Firm
The ₹5,448.40 VRZ Low acted as a strong demand zone where buyers stepped in.
⚡ Breakdown Lost Momentum
Sellers failed to maintain price below the key support.
🚨 Bullish Reclaim Confirmed
Price recovered above the VRZ Low and signaled that the breakdown had failed.
📈 Strong Price Structure
Higher highs and higher lows confirmed sustained bullish momentum.
🔒 Defined Invalidation
The area below the failed breakdown provided a clear risk-control reference.
💰 Exceptional Risk-Reward
The successful setup delivered a 2.68% bullish outcome with an outstanding 1:21 RR.
🔴 Before Rejection: Sellers controlled the initial decline toward the VRZ Low.
⚠️ At the Zone: Price tested the ₹5,448.40 support area, but the breakdown failed.
🟢 After Rejection: Buyers reclaimed the VRZ Low and reversed the bearish momentum.
📈 Confirmation: Higher highs and higher lows established a sustained bullish structure.
🎯 Final Move: KEI advanced toward the ₹5,594.49 upside objective.
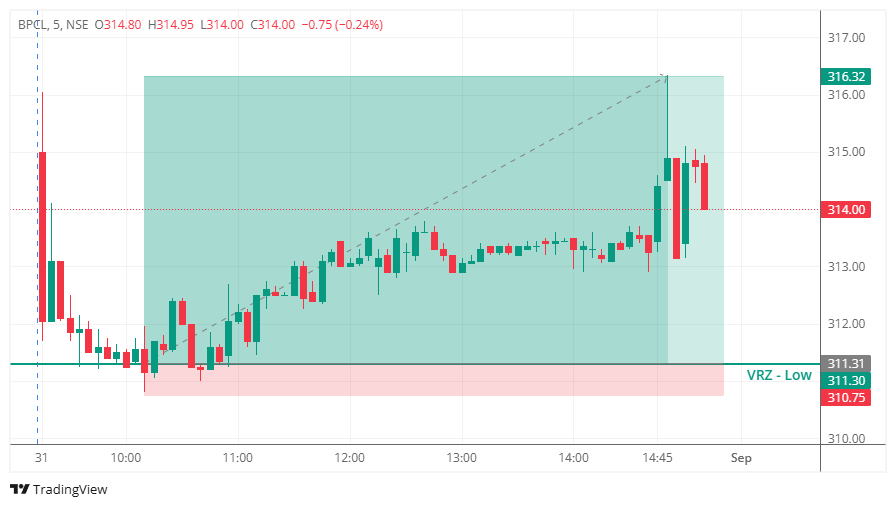

🔻 BPCL tested the VRZ Low, where sellers attempted to push price below the support zone.
⚠️ The breakdown failed to sustain as price recovered back above the VRZ Low.
🟢 This rejection confirmed the Breakdown Failure (BOF) setup and created a bullish intraday opportunity.
🟢 Buyers stepped in after the failed breakdown.
📊 Price reclaimed the ₹311.30 VRZ Low and gradually developed stronger upside momentum.
🚀 The setup delivered a 1.61% bullish move with an impressive 1:9 Risk-Reward.
🔴 Sellers: Attempted to break below the VRZ Low.
🟡 Breakdown Traders: Became trapped when price reclaimed support.
🟢 Buyers: Regained control and pushed BPCL higher.
🎭 The initial breakdown created bearish expectations.
🚨 When price failed to sustain below the VRZ Low, seller confidence weakened.
📈 The recovery above support shifted control toward buyers and strengthened the bullish reversal.
🎯 The key confirmation came when BPCL reclaimed ₹311.30.
🔄 Price sustained above the VRZ Low, validating the bullish BOF structure.
⚡ Continued upside follow-through confirmed increasing buyer participation.
🚫 Failed Breakdowns Can Trigger Strong Reversals
A breakdown without follow-through can quickly turn bullish.
🎯 Support Reclaim Matters
Regaining the VRZ Low highlighted strengthening buyer control.
🛡️ Defined Risk Supports Discipline
The VRZ Low provided a clear reference for setup invalidation.
⚡ Momentum Supports Follow-Through
Once buyers gained control, the upside move extended significantly.
📈 After reclaiming the VRZ Low, BPCL developed a stronger bullish structure.
🟢 Buyers continued to maintain control as price moved higher.
🚀 The improving price structure supported further upside momentum.
⚡ Buying pressure strengthened following the failed breakdown.
📈 Price continued moving away from the VRZ Low and extended the bullish reversal.
🏆 The setup ultimately delivered a 1.61% upside move with a strong 1:9 RR.
🔸 The trade became actionable after BPCL failed to sustain the breakdown below ₹311.30.
📈 Buyers reclaimed the zone and maintained bullish control.
⚖️ The confirmed BOF structure delivered a disciplined setup with strong reward potential.

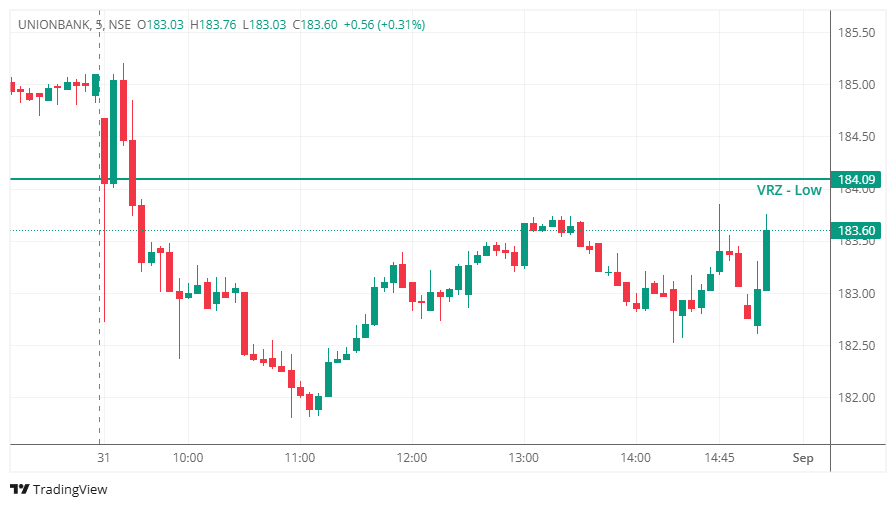
📌 Stock: Union Bank of India (UNIONBANK)
🏦 Sector: Banking / Financial Services
⏱️ Chart Time Frame: 5 Minutes
🕒 VRZ Marking Time Frame: 30 Minutes
🛑 Reversal Zone: VRZ Low – ₹184.09
🧩 Setup Type: Breakout Failure (BOF)
📍 Reference Zone: VRZ Low – ₹184.09
📈 Trade Direction: Buy
🚫 Outcome: BOF Failed / Reclaim Not Sustained

UNIONBANK opened with strong selling pressure and quickly moved below the ₹184.09 VRZ Low.
The subsequent recovery created the possibility of a bullish BOF reversal. However, buyers were unable to reclaim and sustain the VRZ Low, keeping the stock below the key reversal zone.
📉 Sellers dominated the early session and pushed price toward the lower levels.
🔄 Buyers gradually attempted to recover from the intraday low.
⚠️ The recovery stalled beneath the VRZ Low.
📍 Price remained below ₹184.09, preventing a confirmed bullish reversal.
This structure indicated that the buying strength was insufficient to invalidate the bearish move.
The bullish BOF setup failed because buyers could not convincingly reclaim the ₹184.09 VRZ Low.
Although price recovered from the intraday lows, the rebound lacked the strength required to establish sustained acceptance above the reversal zone.
❌ Weak follow-through during the recovery.
⚠️ Price remained below the VRZ Low.
🔄 Repeated attempts to move higher lacked continuation.
📉 Sellers maintained control around the reversal area.
🚫 No sustained bullish acceptance above ₹184.09 developed.
🔻 UNIONBANK initially broke below the VRZ Low.
🟢 Buyers later stepped in and pushed price higher.
⚠️ The recovery remained below the key ₹184.09 zone.
🔄 Price action became choppy near the lower levels.
📉 Without a sustained reclaim, the bullish BOF confirmation failed to materialize.
🎯 A recovery from the lows does not automatically confirm a bullish BOF.
📊 The VRZ Low must be reclaimed with strong follow-through.
🔍 Failure to reclaim the reversal zone keeps bearish pressure active.
🛡️ Waiting for confirmation helps avoid premature reversal entries.
📈 Trade confirmed price action rather than anticipating a reversal.
🧠 Every BOF setup carries a probability of failure.
✅ A failed setup should be accepted without emotional intervention.
📌 Following predefined rules is more important than predicting every market move.
🔒 Consistent risk management helps protect capital across multiple trades.
🛡️ Risk should always be defined before execution.
📍 The VRZ Low provides a clear reference for setup validation.
🚫 When the expected reclaim does not develop, the bullish thesis loses strength.
💰 Controlled risk keeps capital available for the next valid opportunity.
⚠️ This UNIONBANK BOF Failure demonstrates that a rebound after a breakdown is not enough to confirm a bullish reversal.
📉 Buyers needed to reclaim and sustain price above the ₹184.09 VRZ Low, but the recovery remained below the key zone.
🎯 Waiting for confirmation rather than anticipating the reversal helps improve trade quality.
💪 Trust the process, respect the reversal zone, and let confirmed price action—not emotions—guide every trading decision.
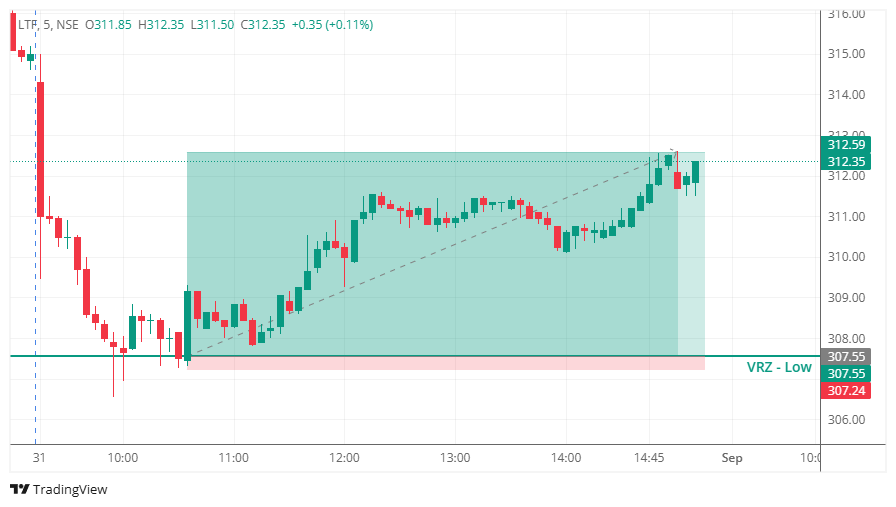

🔻 LTF tested the VRZ Low, where sellers attempted to push price below the support zone.
⚠️ The breakdown failed to sustain as price recovered back above the VRZ Low.
🟢 This rejection confirmed the Breakdown Failure setup and created a bullish intraday opportunity.
🟢 Buyers stepped in strongly after the failed breakdown.
📊 Price reclaimed the ₹307.55 VRZ Low and gradually developed upward momentum.
🚀 The bullish move continued through the session, delivering a 1.64% upside move with an exceptional 1:16 Risk-Reward.
🔴 Sellers: Attempted to break below the VRZ Low.
🟡 Breakdown Traders: Became trapped when price moved back above support.
🟢 Buyers: Regained control and pushed LTF higher.
🎭 The initial breakdown created bearish expectations.
🚨 When price failed to remain below the VRZ Low, seller confidence weakened.
📈 The strong recovery shifted market control toward buyers and supported the bullish reversal.
🎯 The key confirmation came when LTF reclaimed ₹307.55.
🔄 Price sustained above the VRZ Low and continued forming a bullish structure.
⚡ Strong follow-through validated the breakdown failure and strengthened the trade.
🚫 Failed Breakdowns Can Create Strong Reversals
A breakdown without follow-through can quickly shift toward the upside.
🎯 Support Reclaim Matters
The recovery above the VRZ Low confirmed improving buyer strength.
🛡️ Defined Risk Supports Discipline
The VRZ Low provided a clear reference for setup invalidation.
⚡ Momentum Can Expand the Move
Once buyers gained control, the bullish move extended significantly.
📈 After reclaiming the VRZ Low, LTF developed a stronger sequence of higher highs and higher lows.
🟢 Buyers maintained control as price moved steadily away from the support zone.
🚀 The improving structure supported continued bullish momentum.
⚡ Buying pressure strengthened following the failed breakdown.
📈 Price continued higher and reached the upper part of the marked trading range.
🏆 The setup ultimately delivered a 1.64% bullish move with an impressive 1:16 RR.
🔸 The trade became actionable after LTF failed to sustain the breakdown below ₹307.55.
📈 Buyers reclaimed the VRZ Low and maintained control.
⚖️ The confirmed BOF structure provided a clear-risk setup with strong reward potential.
