
Select a trading day to view all Scanner results, chart evidence, and market explanations.
5 Scanners Available
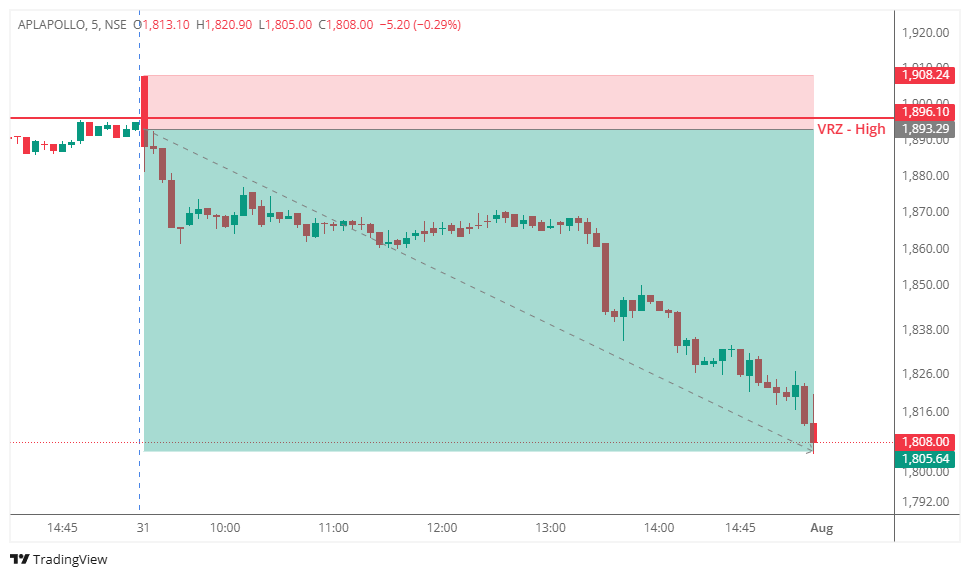

🔹 APLAPOLLO tested the VRZ High, where buyers attempted to sustain a breakout above the resistance zone.
⚠️ The breakout failed to hold as price quickly slipped back below the VRZ High, indicating weakening bullish momentum.
🔻 This rejection confirmed the Breakout Failure (BOF) setup and created a strong bearish intraday opportunity.
📉 After the failed breakout, sellers dominated the session and maintained continuous downside pressure.
🔴 Price remained below the VRZ High, confirming a strong bearish market structure.
🎯 The confirmed BOF setup delivered an impressive 4.63% bearish move with a 1:5 Risk-Reward.
🟢 Buyers: Attempted to sustain the breakout above the VRZ High.
🟡 Breakout Traders: Were trapped once price moved back below the resistance level.
🔴 Sellers: Took full control after the rejection and continued driving price lower throughout the session.
1️⃣ Failed Breakouts Can Lead to Strong Declines
A breakout that fails above resistance often results in sharp bearish momentum.
2️⃣ Confirmation Improves Trade Quality
Waiting for price to reject the VRZ High helped validate the BOF setup.
3️⃣ Structured Risk Delivers Better Consistency
Using the VRZ High as the invalidation level supported disciplined execution.
4️⃣ Let Market Structure Guide the Trade
Following confirmed price action increases confidence in BOF entries.
🔸 The setup became actionable after price failed to sustain above the VRZ High and confirmed the breakout failure.
📉 Sellers maintained complete control, resulting in a clean bearish intraday trend.
🏆 The trade delivered a 4.63% bearish move with a solid 1:5 Risk-Reward, rewarding disciplined execution.

The overall expectation was for buyers to defend the VRZ Low, making it a potential reversal zone for a BOF long trade.
When price briefly traded below the support level and reclaimed it, the setup aligned with the rules of the Logical Trading System (LTS) and offered a valid buying opportunity.
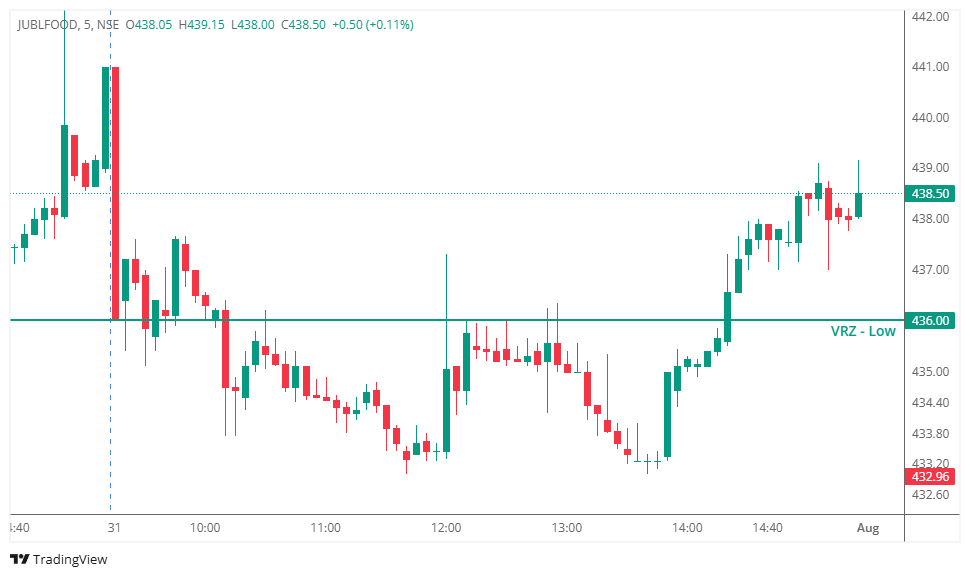
JUBLFOOD traded with early weakness and gradually approached the VRZ Low (₹436.00), a key support level where buyers were expected to regain control.
Price briefly moved below the VRZ Low before reclaiming the level, generating a valid BOF long setup. The quick recovery suggested that selling pressure might be fading and buyers were attempting to regain control.
The BOF buy trade was triggered after price reclaimed the VRZ Low.
Initially, the setup looked promising. However, buyers failed to generate immediate follow-through. The recovery lost momentum, allowing sellers to regain control and push the stock lower.
As bearish pressure intensified, the BOF setup was invalidated and the predefined stop loss was triggered.
Although the stock recovered strongly later in the session and traded well above the VRZ Low, the stop loss had already been executed, highlighting the importance of respecting predefined risk.
The trade failed because buyers could not sustain momentum after reclaiming the support zone.
❌ Weak bullish follow-through after entry.
❌ Sellers quickly regained control.
❌ Price failed to establish higher highs.
❌ Bearish momentum expanded after the reclaim.
❌ The expected reversal lacked strong confirmation.
These signals significantly reduced the probability of a successful BOF long trade.
The chart highlights a failed BOF long setup before a strong late-session recovery.
🔹 Sellers initially broke below the support zone.
🔸 Buyers reclaimed the VRZ Low.
🔺 The bullish move lacked early confirmation.
🔷 Sellers pushed the price to fresh intraday lows.
⭐ A delayed recovery occurred only after the BOF trade had already failed.
This is a classic example of late confirmation, where the anticipated move eventually occurred—but only after disciplined traders had already exited according to their predefined risk management rules.
Many traders assume that every BOF reclaim will immediately lead to a reversal.
This trade proves that timing matters just as much as the setup itself.
Professional traders understand that a valid setup without strong follow-through is enough reason to respect the stop loss and wait for the next opportunity.
⚠️ Every BOF setup has a probability of failure.
📉 A valid trading setup can still result in a controlled loss.
🏦 Delayed reversals don't change the outcome once the stop loss is triggered.
🛡️ Consistent risk management is more important than predicting every market move.
🎯 Long-term success comes from disciplined execution, not perfect accuracy.
This trade followed all the rules of the Logical Trading System (LTS) and remained a valid execution despite the loss.
Professional traders understand that:
✅ Every setup has winning and losing outcomes.
✅ Respecting stop losses protects long-term capital.
✅ Emotional decisions destroy consistency.
✅ The process always matters more than any single trade.
Professional trading is not about avoiding losses—it's about managing them effectively.
In this trade:
✔️ Risk was predefined before entry.
✔️ Stop loss limited the downside.
✔️ Capital remained available for future opportunities.
✔️ Discipline was maintained throughout the trade.
This is exactly how professional traders survive and remain profitable over the long run.
Protecting trading capital remains the highest priority.
✅ Entry followed predefined rules.
✅ Risk was planned before execution.
✅ Stop loss was respected without hesitation.
✅ Capital was preserved for future opportunities.
Small, controlled losses are a necessary cost of professional trading.
🌍 Markets constantly test patience, discipline, and risk management.
⚠️ This JUBLFOOD BOF Failure demonstrates that reclaiming a support level alone is not enough—strong bullish confirmation and follow-through are essential.
🛡️ Professional traders focus on protecting capital through disciplined execution rather than trying to avoid every losing trade.
📈 Long-term profitability is achieved by consistently following a proven trading system while keeping losses small and controlled.
💪 Stay patient, trust your strategy, and let discipline—not emotions—guide every trading decision.
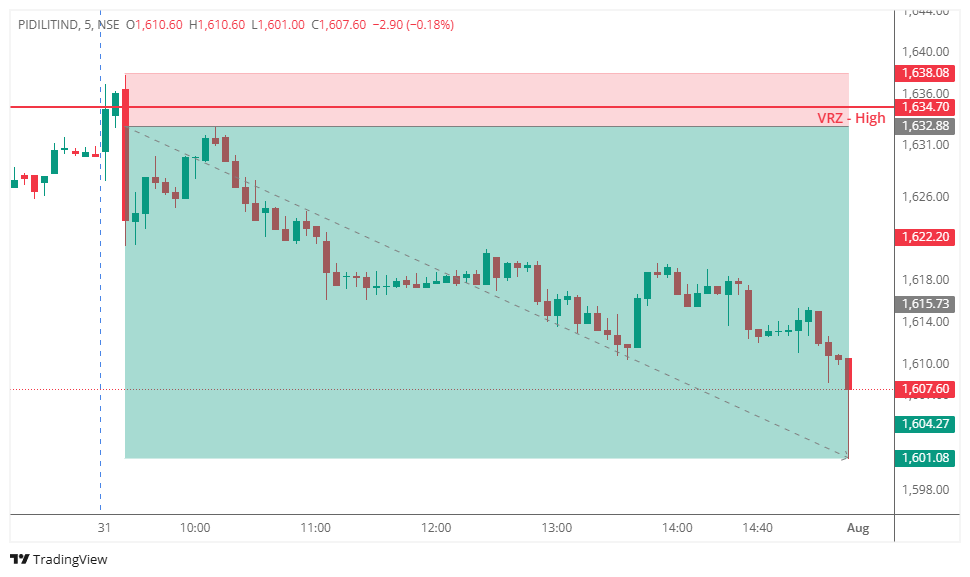

🔹 PIDILITIND tested the VRZ High, where buyers attempted to sustain a breakout above the resistance zone.
⚠️ The breakout failed to hold as price quickly moved back below the VRZ High, indicating weakening bullish momentum.
🔻 This rejection confirmed the Breakout Failure (BOF) setup and created a high-probability bearish intraday opportunity.
📉 Following the failed breakout, sellers gradually gained control and maintained steady downside pressure.
🔴 Price continued trading below the VRZ High, confirming the bearish shift in market structure.
🎯 The confirmed BOF setup delivered a 1.95% bearish move with an impressive 1:6 Risk-Reward.
🟢 Buyers: Attempted to sustain the breakout above the VRZ High.
🟡 Breakout Traders: Were trapped when price slipped back below the resistance zone.
🔴 Sellers: Capitalized on the rejection and drove the stock steadily lower.
🔸Failed Breakouts Can Create Strong Reversals
A breakout that fails to sustain above resistance often leads to bearish momentum.
🔹Confirmation Improves Trade Accuracy
Waiting for price to reject the VRZ High helped validate the BOF setup.
🟢Defined Risk Supports Better Execution
Using the VRZ High as the invalidation level helped maintain disciplined risk management.
🔵Let Price Action Lead
Following confirmed market structure increases the probability of successful BOF trades.
🔸 The trade became actionable after price failed to sustain above the VRZ High and confirmed the breakout failure.
📉 Sellers maintained consistent control, producing a clean bearish trend throughout the session.
🏆 The setup delivered a 1.95% bearish move with a strong 1:6 Risk-Reward, rewarding disciplined execution.
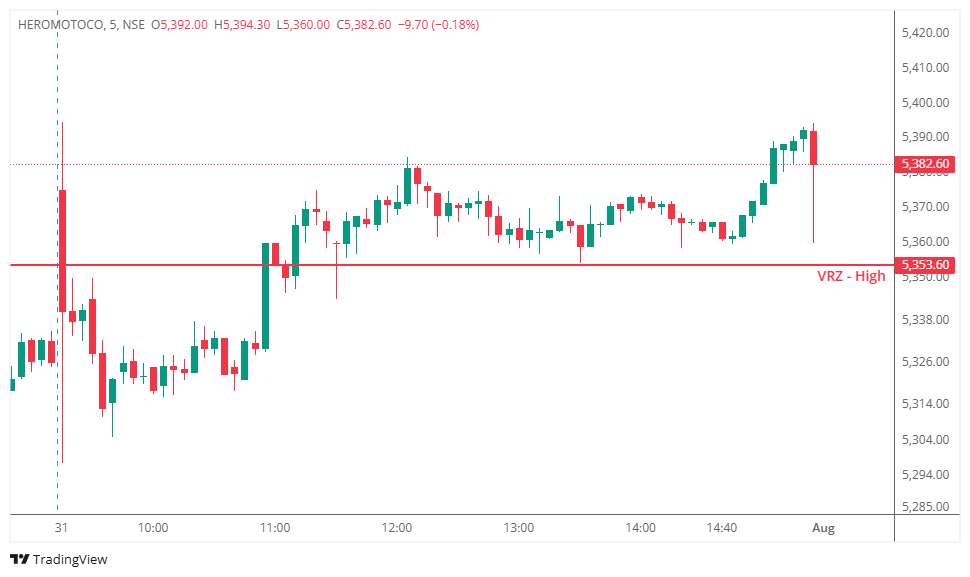

HEROMOTOCO recovered strongly after the opening session and moved toward the VRZ High, a key resistance zone where sellers were expected to defend the breakout.
Price briefly traded above ₹5,353.60 before slipping back, creating a valid BOF short setup according to the Logical Trading System (LTS). The initial rejection suggested a possible bearish reversal.
The BOF short trade was initiated after the rejection near the VRZ High.
However, bearish follow-through never developed. Buyers quickly absorbed the selling pressure and reclaimed higher price levels. The stock continued to form a bullish intraday structure, keeping sellers under pressure.
As buying momentum strengthened, the BOF setup was invalidated and the predefined stop loss was triggered before the sharp late-session pullback occurred.
The trade failed because buyers maintained control after the entry.
Key warning signs included:
❌ Price remained above the VRZ High.
❌ Bearish momentum failed to expand.
❌ Buyers continued defending higher price levels.
❌ Bullish market structure stayed intact.
❌ Selling pressure lacked follow-through.
These signals indicated that the expected reversal had a low probability of succeeding.
The chart reflects a failed BOF followed by bullish continuation before a late intraday pullback.
🔹 Buyers broke above the resistance zone.
🔸 Sellers attempted to reverse the breakout.
🔺 Bearish confirmation remained weak.
🔷 Buyers sustained control throughout most of the session.
⭐ The BOF short setup was invalidated before the late decline.
This type of price action often traps early short sellers before the market completes its primary move.
⚠️ Every BOF setup has a probability of failure.
📉 A valid setup can still result in a stop loss when market conditions change.
🏦 Strong buying participation can invalidate even quality reversal setups.
🛡️ Consistent execution and disciplined risk management create long-term trading success.
🎯 Following the process is more important than the outcome of any single trade.
This trade fully respected the Logical Trading System (LTS) and remained a valid execution despite the loss.
Professional traders understand that:
✅ Not every high-probability setup will succeed.
✅ Small losses are part of probability-based trading.
✅ Respecting stop losses preserves both capital and discipline.
✅ Long-term consistency comes from following the trading plan without emotional decisions.
Successful trading begins with protecting capital.
✅ Entry followed the predefined trading rules.
✅ Risk was calculated before execution.
✅ Stop loss was respected without hesitation.
✅ No emotional averaging or revenge trading occurred.
Small, controlled losses are essential for achieving consistent long-term performance.
🌍 Markets constantly test patience, discipline, and risk management.
⚠️ This HEROMOTOCO BOF Failure shows that an initial rejection near resistance is not enough—strong bearish confirmation is essential before expecting a sustained reversal.
🛡️ Professional traders focus on controlling risk rather than avoiding losses.
📈 Long-term profitability comes from disciplined execution, consistent risk management, and trusting a proven trading system.
💪 Stay patient, stay disciplined, and let your trading process—not emotions—drive every decision.
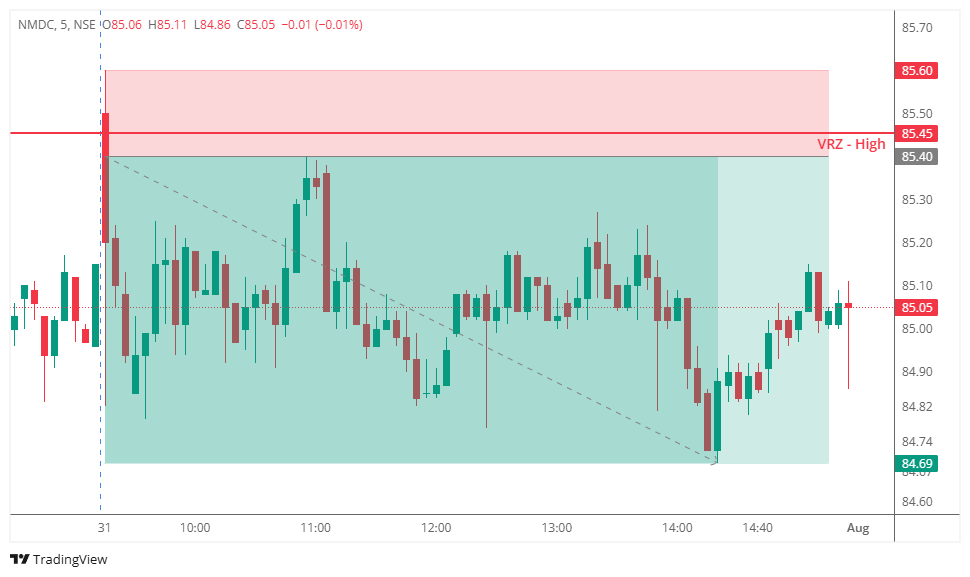

🔹 NMDC tested the VRZ High, with buyers attempting to sustain the breakout above the resistance level.
⚠️ The breakout failed to hold as price slipped back below the VRZ High, indicating weakening bullish momentum.
🔻 This rejection confirmed the Breakout Failure (BOF) setup and created a high-probability bearish intraday opportunity.
📉 After the failed breakout, sellers gradually gained control and pushed price lower.
🔴 Price remained below the VRZ High, confirming the bearish shift in momentum.
🎯 The confirmed BOF setup delivered a 0.83% bearish move with a solid 1:3 Risk-Reward.
🟢 Buyers: Attempted to sustain the breakout above the VRZ High.
🟡 Breakout Traders: Were trapped as price moved back below the resistance zone.
🔴 Sellers: Took control after the rejection and maintained steady bearish pressure.
🔸 1️⃣ Failed Breakouts Can Signal Reversals
A breakout that cannot sustain above resistance often shifts momentum toward sellers.
🔹 2️⃣ Wait for Confirmation
Allowing price to reject the VRZ High before entering helped confirm the BOF setup.
🟢 3️⃣ Trade with Disciplined Risk Management
Using the VRZ High as the invalidation level supported structured trade execution.
🔵 4️⃣ Follow Confirmed Price Action
Trading with confirmation improved the probability of capturing the bearish move.

🔸 The trade became actionable after price failed to sustain above the VRZ High and moved back below the resistance zone.
📉 Sellers maintained control throughout the session, resulting in a clean bearish intraday move.
🏆 The setup delivered a 0.83% bearish move with a disciplined 1:3 Risk-Reward.