
Select a trading day to view all Scanner results, chart evidence, and market explanations.
6 Scanners Available
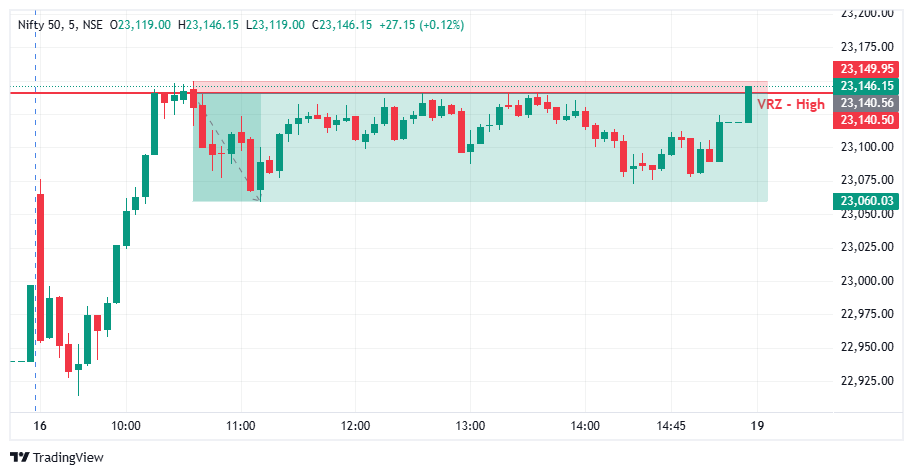

🔺 NIFTY 50 approached and tested the VRZ High, with buyers attempting to push price above the resistance zone.
⚠️ The breakout failed to sustain, and price slipped back below the 23,140.50 VRZ High.
🔴 This rejection confirmed a Breakout Failure (BOF) structure and created a bearish intraday opportunity.
🔻 Sellers gained control following the VRZ High rejection.
📊 The inability to sustain above the resistance zone highlighted weakening bullish momentum.
🚀 The setup delivered a 0.35% bearish move with a strong 1:8.6 Risk-Reward.
🟢 Buyers: Attempted to sustain the upside breakout above VRZ High.
🟠 Breakout Traders: Came under pressure as price failed to hold the breakout.
🔴 Sellers: Regained control and drove the short-term bearish reversal.
🎭 The initial upside attempt created bullish expectations around the VRZ High.
⚠️ Failure to sustain the breakout weakened buyer confidence.
📉 The rejection shifted short-term momentum toward sellers and supported the downside move.
🎯 The key confirmation came when NIFTY 50 rejected the 23,140.50 VRZ High and failed to sustain above the breakout area.
🔄 The failed breakout indicated that bullish momentum was losing strength.
⚡ Continued downside follow-through validated the BOF structure.
🔸 🚫 Failed Breakout Pressure
A failed move above resistance can trap breakout buyers and create selling pressure.
🔹 🎯 VRZ High Rejection
The 23,140.50 zone acted as the key reference for identifying the bearish reversal.
🛡️ Defined Risk & Strong RR
The setup offered a structured risk profile with an impressive 1:8.6 Risk-Reward.
📉 ⚡ Downside Momentum
Once sellers regained control, NIFTY 50 developed a bearish intraday move from the VRZ High.
📉 Following the VRZ High rejection, NIFTY 50 developed a weaker short-term price structure.
🔴 Sellers maintained pressure as price moved away from the resistance zone.
🚀 The developing structure supported the 0.35% bearish move.
🔥 Selling pressure strengthened after the failed breakout.
📉 NIFTY 50 moved lower from the VRZ High rejection zone.
🏆 The setup delivered a 0.35% downside move with 1:8.6 RR.
🔸 The setup became actionable after NIFTY 50 failed to sustain above the 23,140.50 VRZ High.
📉 Sellers regained control and pushed price lower from the rejection area.
⚖️ The confirmed BOF structure provided a defined-risk intraday setup with an impressive 1:8.6 Risk-Reward.

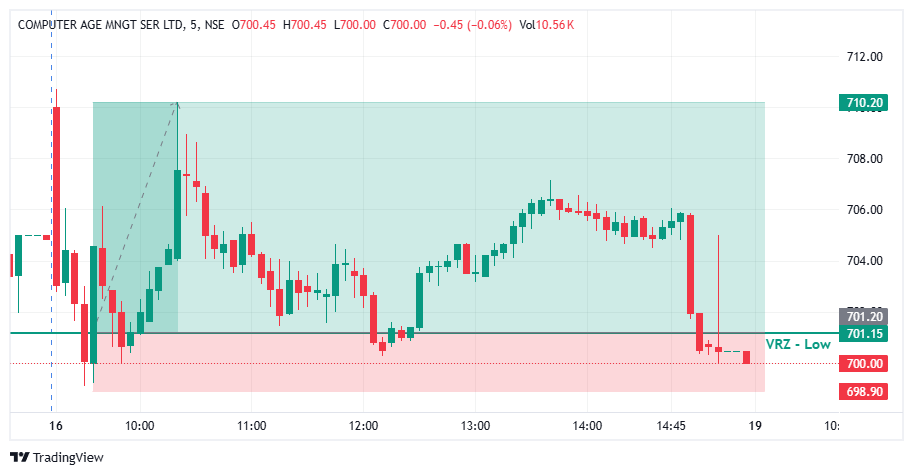

🔎 CAMS spiked at the open, then reversed and saw steady selling through the first few candles.
⚠️ Price slid into the ₹701.15 VRZ Low, where a breakdown looked likely.
🎯 The VRZ Low became the key technical reference for spotting a potential bullish Breakout Failure.
📉 Price dipped below the ₹701.15 VRZ Low and touched the ₹698.90 area, showing a clear attempt by sellers to extend the downside.
🪤 The move below support was shallow and could not hold.
🔄 Buyers stepped in right at the lows, forming the first base for a bullish reversal.
🎯 Price closed back above the ₹701.15 VRZ Low, confirming a Bullish Breakout Failure structure.
⚡ The failed breakdown showed that sellers had lost control below support.
📈 Once the level was reclaimed, short-term momentum shifted decisively toward the buyers.
📈 After the VRZ Low rejection, CAMS climbed quickly with higher lows and strong green candles.
⚡ Buyers pushed price out of the breakdown zone and into a fast bullish expansion.
💥 The rally peaked near ₹710.20, a 1.28% price expansion that confirmed the successful BOF outcome.
🔍 The chart shows an early dip below the ₹701.15 VRZ Low, a sharp recovery from the support area, and a fast move toward the highs.
🟢 Price later pulled back and retested the VRZ Low zone around midday, and buyers defended it again.
📈 A second push followed in the afternoon, lifting price back above ₹706.00.
🎯 The shift from breakdown pressure to bullish expansion was the defining technical event of this setup.
🔎 The main signal was the failed breakdown below the ₹701.15 VRZ Low.
⚡ Sellers pushed price under support, but the move lacked sustained follow-through.
🟢 The reclaim of the VRZ Low signalled a change in short-term price structure.
📈 Buyers then drove the recovery to higher levels, producing the reported 1.28% move.
🟢 VRZ Low: ₹701.15 served as the primary support reference.
⚠️ Breakdown Failure: Sellers could not hold price below the support zone.
🛡️ Buyer Defense: Buyers responded strongly near the ₹698.90 low.
🔄 Bullish Reclaim: Price recovered back above the key level.
📊 Momentum Shift: Short-term momentum turned bullish after the failed breakdown.
🚀 Upside Expansion: Price advanced toward the ₹710.20 area.
🏆 Trade Outcome: 1.28% upside with 1:4 RR.
🎯 The ₹701.15 VRZ Low, with the ₹698.90 swing low just below it, gave a tight and clearly defined risk reference for the bullish BOF setup.
⚖️ A small, defined risk against a larger upside move produced the 1:4 Risk-to-Reward outcome.
🧠 Structured position sizing, predefined invalidation levels, and disciplined execution matter when trading Breakout Failure setups.
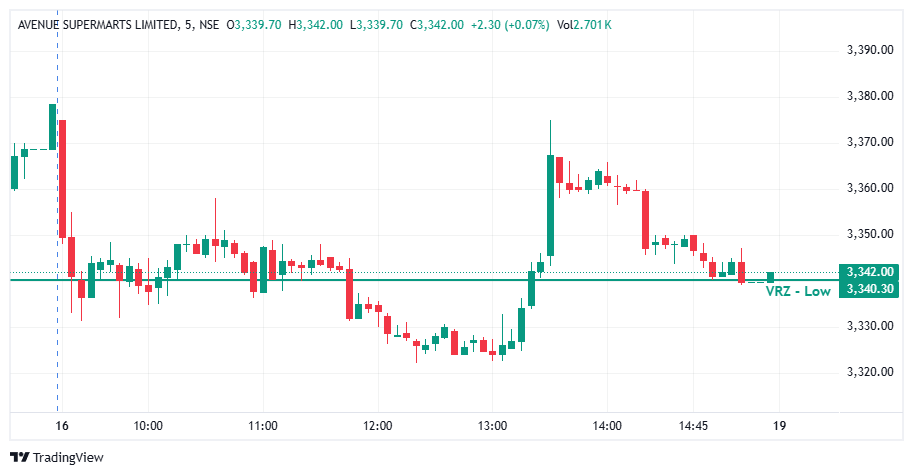

🔄 Price initially declined, forming a weak intraday structure. A sharp afternoon recovery failed to sustain its upward momentum, followed by lower price levels that indicated renewed selling pressure. 🚫 Buyers struggled to maintain price above the ₹3,340.30 reference zone, while the late-session movement toward the VRZ Low highlighted the weakness of the recovery.
🎯 A bullish BOF entry required clear confirmation around the ₹3,340.30 VRZ Low. However, the chart showed weakening momentum after the afternoon recovery and a return toward the reference level. ⚠️ Entering without a confirmed reclaim and sustained acceptance could expose a trade to unnecessary risk. Waiting for clear price-action confirmation would provide a stronger basis for execution.
🔐 Define the stop-loss and invalidation conditions before entering the trade. 📊 Monitor whether price sustains the expected direction after the trigger, rather than relying on a temporary recovery. ⚠️ When momentum weakens or the setup conditions are no longer valid, follow the predefined exit rules and protect trading capital.
📌 The DMART chart highlights the importance of distinguishing a temporary price recovery from a confirmed BOF reversal. The afternoon rally lost momentum, and price returned toward the ₹3,340.30 VRZ Low. Traders should prioritize confirmation, disciplined execution, and predefined risk management instead of assuming that every recovery will continue.
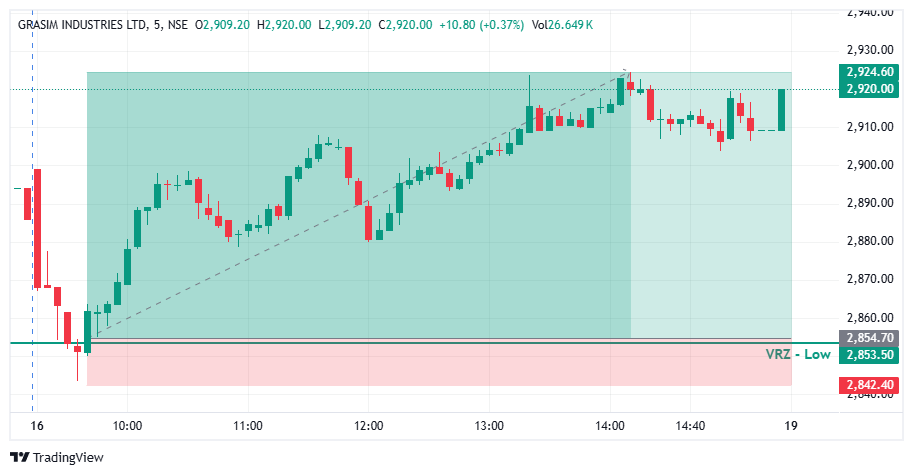

🔻 GRASIM tested the VRZ Low, where sellers attempted to extend the downside below the support zone.
🚨 The breakdown failed to sustain as price rejected the lower levels around ₹2,853.50.
🟢 The strong rejection confirmed a Breakdown Failure (BOF) structure and created a potential bullish reversal opportunity.
🟢 Buyers stepped in aggressively after the failed breakdown.
📊 Price reclaimed the VRZ Low and gradually developed stronger upside momentum.
🚀 The setup eventually delivered an impressive 2.45% bullish move with a 1:5.7 Risk-Reward.
🔴 Sellers: Attempted to push GRASIM below the VRZ Low.
🟡 Breakdown Traders: Came under pressure as price failed to sustain below support.
🟢 Buyers: Absorbed selling pressure and regained control of the price action.
🎭 The initial downside move created bearish expectations around the VRZ Low.
⚠️ However, sellers failed to maintain control below the support zone.
📈 The rejection shifted sentiment toward buyers and supported a sustained bullish recovery.
🎯 The key confirmation came when GRASIM rejected the ₹2,853.50 VRZ Low and started holding above the support area.
🔄 The failed breakdown signaled weakening bearish momentum.
⚡ Continued higher price action validated the bullish BOF setup.
🔸 🚫 Failed Breakdown Can Trap Sellers
When price fails to sustain below support, bearish positions can quickly come under pressure.
🔹 🎯 VRZ Low Rejection Signals Demand
The strong reaction around ₹2,853.50 highlighted renewed buying interest.
🛡️ Defined Risk Improves Trade Discipline
The VRZ Low provided a clear technical reference for risk management.
⚡ 📈 Strong Follow-Through Confirms Momentum
Continued upside movement strengthened the bullish reversal structure.
📈 After rejecting the VRZ Low, GRASIM formed a progressively stronger bullish intraday structure.
🟢 Buyers maintained control as price moved away from the support zone.
🚀 The developing structure supported continued upside momentum toward higher levels.
🔥 Buying pressure strengthened following the breakdown failure.
📈 GRASIM continued higher from the VRZ Low and delivered a 2.45% bullish move.
🏆 The setup achieved a strong 1:5.7 Risk-Reward outcome.
🔸 The setup became actionable after GRASIM failed to sustain below the ₹2,853.50 VRZ Low.
📈 Buyers reclaimed the support zone and maintained bullish control.
⚖️ The confirmed BOF structure provided a disciplined intraday setup with defined risk and a 1:5.7 RR opportunity.
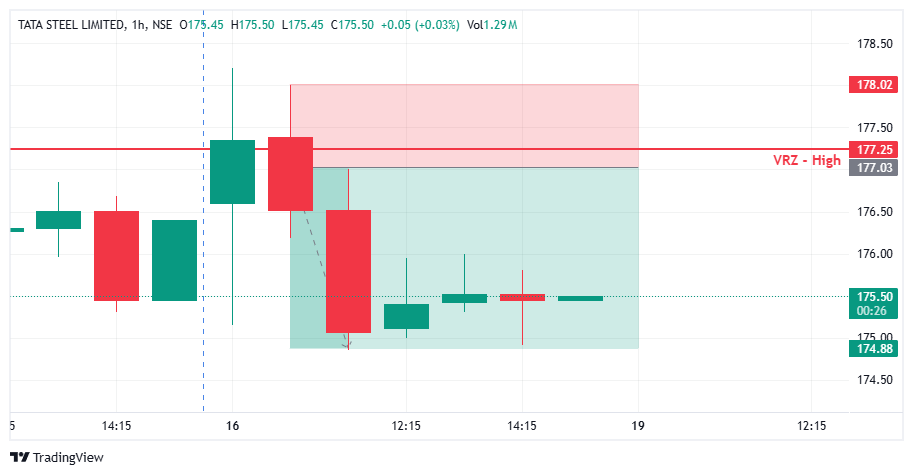

📈 TATASTEEL moved toward the identified VRZ High at ₹177.25, bringing price into a key resistance zone.
🟢 Buyers initially pushed price upward, testing the resistance area and creating the possibility of a bullish breakout.
⚠️ However, the upward move failed to sustain above the VRZ High.
🔻 Selling pressure emerged around resistance, and price began moving lower.
📉 The failed attempt to maintain higher levels indicated weakening bullish momentum and created the conditions for a Bearish Breakout Failure (BOF) setup.
🚨 After testing the VRZ High, TATASTEEL failed to maintain its upward momentum.
🔻 A strong bearish candle pushed price back below the resistance region.
📉 The move toward lower levels strengthened the bearish price structure.
🐻 Sellers gained control as the stock moved away from the failed breakout zone.
🎯 The rejection around ₹177.25 provided the key reference for the bearish BOF setup.
💥 The resulting trade delivered a 1.21% downside move, achieving the planned 1:2 risk-reward outcome.
🔍 VRZ High Resistance: ₹177.25 acted as the key reference level for the setup.
📈 Breakout Attempt: Buyers pushed price toward the resistance region.
⚠️ Breakout Failure: Price failed to sustain the upward move around the VRZ High.
🔻 Bearish Rejection: Selling pressure pushed price lower after the failed breakout.
📊 Downside Continuation: Subsequent price action supported the bearish move toward the lower target region.
🏆 Trade Outcome: A 1.21% downside move with 1:2 RR.
Many traders may have expected:
🚀 The upward move to continue beyond resistance.
📈 Buyers to establish a sustained breakout above ₹177.25.
🟢 Bullish momentum to carry the stock toward higher levels.
But the price action changed the scenario.
⚠️ The breakout failed to sustain.
😮 Buyers faced rejection around resistance.
🔻 Sellers regained control as price moved lower.
📉 The shift from bullish expectations to bearish momentum supported the downside move.
💭 This reversal illustrates how failed breakouts can change market sentiment around an important price zone.
🟢 Buyers initially attempted to push TATASTEEL above the VRZ High.
🔴 Sellers defended the resistance region and challenged the upward move.
⚖️ The failed breakout shifted the balance toward sellers.
📉 As price moved lower, breakout buyers may have exited their positions.
🐻 Selling pressure contributed to the bearish continuation.
🎯 The rejection and subsequent decline supported the successful BOF outcome.
A temporary move above resistance is not enough to confirm a genuine breakout. Price must sustain above the VRZ High.
When buyers fail to maintain price above resistance, sellers can regain control and create a bearish BOF opportunity.
A failed bullish breakout can leave breakout participants exposed to a reversal, potentially increasing selling pressure as positions are exited.
The move back below the resistance region provided evidence that the breakout attempt had failed.
A predefined entry, stop-loss, and target help traders manage risk systematically. This setup achieved a 1:2 RR alongside a 1.21% downside move.
🔎 Identify the VRZ High before evaluating a potential breakout.
👀 Monitor whether price sustains acceptance above resistance.
⚡ Look for rejection and a move back below the key zone.
🛡️ Use a predefined stop-loss above the failed breakout region.
🎯 Maintain a structured risk-reward plan throughout the trade.
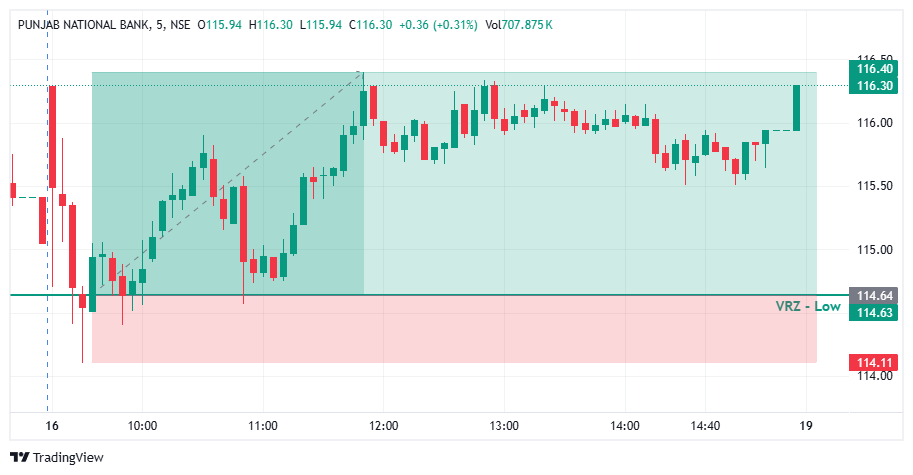

🔎 PNB faded after an early spike and slid steadily toward the support area.
⚠️ Price moved into the ₹114.63 VRZ Low, where a breakdown looked likely.
🎯 The VRZ Low became the key technical reference for spotting a potential bullish Breakout Failure.
🔻 Price dipped below the ₹114.63 VRZ Low and tagged the ₹114.11 area, showing a clear attempt by sellers to extend the downside.
🚫 The move below support was shallow and could not hold.
🔄 Buyers stepped in right at the lows, forming the first base for a bullish reversal.
🎯 Price closed back above the ₹114.63 VRZ Low, confirming a Bullish Breakout Failure structure.
⚡ The failed breakdown showed that sellers had lost control below support.
📈 Once the level was reclaimed, short-term momentum shifted decisively toward the buyers.
📈 After the VRZ Low rejection, PNB climbed steadily with higher lows and strong green candles.
⚡ Trapped sellers covered and buyers pushed price out of the breakdown zone into a sharp bullish recovery.
💥 The rally extended to around ₹116.40, a 1.54% price expansion that confirmed the successful BOF outcome.
🔍 The chart shows an early sell-off, a brief break of the ₹114.63 VRZ Low, and a strong recovery from the support area.
🟢 The reclaim of the zone was the key confirmation for the bullish BOF structure.
📈 Price then travelled up to the ₹116.40 area and held well above the VRZ Low for the rest of the session.
🎯 The shift from breakdown pressure to bullish expansion was the defining technical event of this setup.
🔎 The main signal was the failed breakdown below the ₹114.63 VRZ Low.
⚡ Sellers pushed price under support, but the move lacked sustained follow-through.
🟢 The reclaim of the VRZ Low signalled a change in short-term price structure.
📈 Buyers then drove the recovery to higher levels, producing the reported 1.54% move.
🟢 VRZ Low: ₹114.63 served as the primary support reference.
🪤 Bear Trap: Sellers could not hold price below the support zone.
🛡️ Buyer Defense: Buyers responded strongly near the ₹114.11 low.
🔄 Bullish Reclaim: Price recovered back above the key level.
📊 Momentum Shift: Short-term momentum turned bullish after the failed breakdown.
🚀 Upside Expansion: Price advanced toward the ₹116.40 area.
🏆 Trade Outcome: 1.54% upside with 1:3 RR.
🎯 The ₹114.63 VRZ Low, with the ₹114.11 swing low just below it, gave a tight and clearly defined risk reference for the bullish BOF setup.
⚖️ A small, defined risk against a larger upside move produced the 1:3 Risk-to-Reward outcome.
🧠 Structured position sizing, predefined invalidation levels, and disciplined execution matter when trading Breakout Failure setups.
