Select a trading day to view all Scanner results, chart evidence, and market explanations.
2 Scanners Available
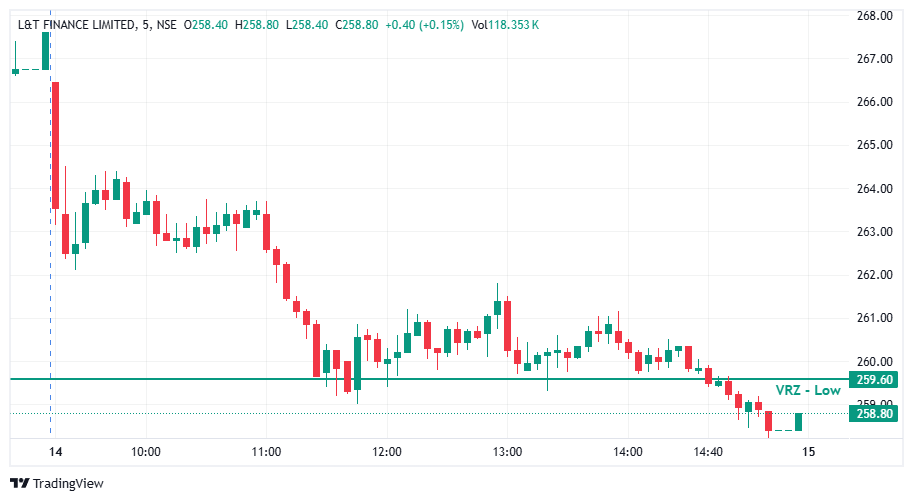

Following the BOF trigger, the trade initially moved favorably and reached the 1:2 risk-reward level within approximately one hour.
🚀 This initial movement indicated that the setup had generated a favorable price response. However, the chart also shows price struggling to establish sustained upward momentum around the ₹260–₹261 region.
⚠️ Although the trade reached 1:2 RR during the session, reaching that level did not automatically secure the profit. The eventual result depended on the exit strategy and actual trade execution.
After moving around the ₹260–₹261 zone, L&T Finance showed renewed selling pressure.
🔻 The chart illustrates lower price movement during the afternoon, with candles gradually moving toward and below the marked VRZ Low at ₹259.60.
📊 Instead of sustaining a recovery, the stock weakened further and approached the ₹259 area before moving toward the ₹258 zone.
🚨 This price behavior highlights how an initially favorable BOF trade can lose momentum when the expected reversal fails to sustain.
At 2:55 PM, the stop-loss was hit, marking the setup as a failed trade according to the reported trade outcome.
📉 Despite reaching the 1:2 RR level earlier, the subsequent price reversal changed the final result.
🧠 This case demonstrates an important distinction in intraday trading: a trade may temporarily reach a favorable reward level, but without an executed exit, that unrealized opportunity is not necessarily a booked profit.