Scanner Viewer

Select a trading day to view all Scanner results, chart evidence, and market explanations.

19 16 15 14 13 12 09 08 07 06 05 01

October 13, 2026

2 Scanners Available

SONACOMS
Auto
Failure
VRZ High Intraday Oct 13, 2026
⚠️ SONACOMS Bearish BOF Failure | Failed VRZ High Rejection & Bullish Price Action 🚫
View Full Analysis β†’

⚠️ SONACOMS Bearish BOF Failure | Failed VRZ High Rejection & Bullish Price Action 🚫


🧾 Trade Setup Snapshot

🏒 Stock: SONA BLW Precision Forgings Ltd. (SONACOMS)

🏭 Sector: Automobile Components

⏱️ Chart Time Frame: 5 Minutes

πŸ•’ VRZ Marking Time Frame: 30 Minutes

πŸ“ VRZ High: β‚Ή792.00

🧩 Setup Type: Bearish Breakout Failure (BOF)

πŸ“‰ Expected Direction: Bearish reversal after rejection near the VRZ High

⚠️ Observed Price Action: Price remained well above the VRZ High after reclaiming it


BOF Scanner App identified this setup at 09:25 am


🌊 Intraday Market Conditions

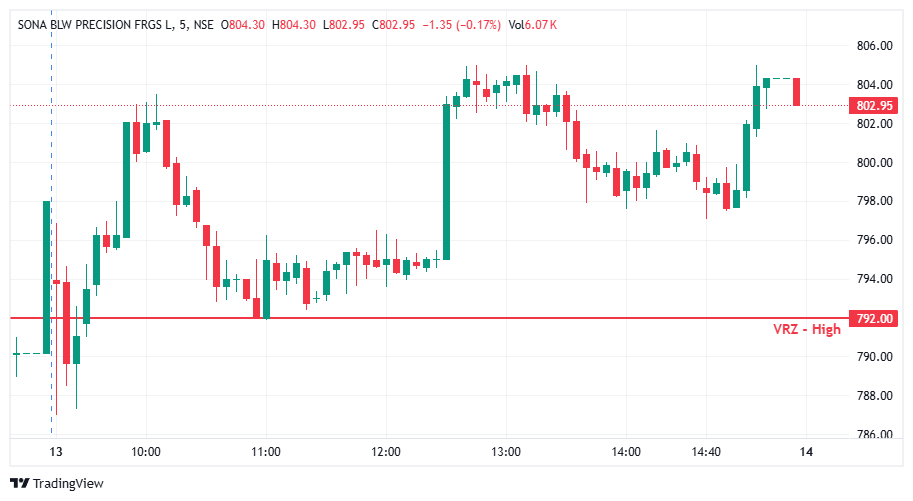
  • πŸ“Š SONACOMS initially moved around the β‚Ή792.00 VRZ High, showing early volatility and repeated price swings.
  • πŸ”„ Price later recovered from the lower levels and moved above the reference zone.
  • πŸ“ˆ Strong bullish momentum emerged around midday, pushing the stock toward β‚Ή804.00.
  • ⚠️ The sustained move above β‚Ή792.00 weakened the bearish reversal expectation.
  • πŸ”Ž The price structure suggested that buyers were maintaining control rather than allowing a bearish continuation.


πŸ—οΈ Chart Structure Assessment

  • 🧱 Price moved above the β‚Ή792.00 VRZ High and continued building a higher trading range.
  • πŸ“ˆ A strong upward move around midday established a bullish intraday structure.
  • πŸ”„ Subsequent pullbacks remained well above the VRZ High.
  • 🚫 Sellers failed to push price back below β‚Ή792.00.
  • 🎯 The sustained acceptance above the key level challenged the original bearish BOF thesis.


πŸ“Š Downside Momentum Evaluation

  • 🎯 The bearish BOF setup required price to reject the VRZ High and develop sustained downside movement.
  • 🚫 Instead, price reclaimed and held above β‚Ή792.00.
  • 🟒 Buyers continued supporting the stock during pullbacks.
  • πŸ“ˆ The sharp upward move toward β‚Ή804.00 showed that bullish momentum remained active.
  • ❌ The expected bearish reversal did not materialize, weakening the original short-side setup.


πŸ“ˆ Intraday Price Movement Review

  • ⚑ Strong bullish candles around midday signalled a significant upward momentum shift.
  • 🟒 Buyers maintained price above the VRZ High during later consolidation.
  • πŸ”» Some bearish candles appeared, but they did not produce a sustained breakdown below β‚Ή792.00.
  • πŸ“ˆ A late-session recovery pushed price back toward β‚Ή804.00.
  • ⚠️ The final pullback toward β‚Ή802.95 did not invalidate the broader move above the VRZ High.


🧭 Confirmation of Bearish Failure

  • πŸ“ Price sustained above the β‚Ή792.00 VRZ High.
  • 🟒 Buyers established a higher trading range.
  • πŸ“ˆ Strong upward momentum developed during the middle of the session.
  • 🧱 Pullbacks failed to break down through the reference level.
  • 🚫 Sellers could not establish sustained acceptance below β‚Ή792.00.
  • ⚠️ The expected bearish reversal lacked confirmation.


πŸ› οΈ Setup Execution Review

  • 🎯 A bearish entry required clear rejection and downside confirmation near the VRZ High.
  • 🚫 The continued move above β‚Ή792.00 did not support the expected bearish scenario.
  • πŸ“Š Entering short without confirmation would have exposed the trade to continued upward movement.
  • 🧭 Waiting for a decisive rejection and sustained breakdown would provide better setup validation.


βš–οΈ Capital Protection View

  • πŸ” The original trade thesis should be reassessed when price sustains above the expected rejection zone.
  • ⚠️ Avoid holding a bearish position simply because price has approached a marked VRZ level.
  • πŸ›‘ Follow predefined invalidation and Stop Loss rules when the expected price action fails.
  • 🎯 Protecting capital and following confirmation rules are more important than forcing a trade.


🎭 Psychology Behind the Trade

  • πŸ‘€ A marked VRZ High can create an expectation of bearish rejection, but the level alone does not guarantee a reversal.
  • ⚠️ Repeated bullish candles and sustained acceptance above the zone should not be ignored.
  • 🧩 Traders must distinguish between a potential setup and a confirmed trading opportunity.
  • 🧠 Avoid holding onto a bearish bias when price action increasingly favours buyers.


πŸ“– Main Lesson From the Trade

  • πŸ“Œ A VRZ level is a reference point, not an automatic entry signal.
  • πŸ” Confirm rejection and downside follow-through before validating a bearish BOF.
  • πŸ“ˆ Sustained acceptance above the VRZ High can invalidate the bearish thesis.
  • πŸ›‘οΈ Use predefined risk limits and avoid forcing entries against the prevailing structure.
  • 🎯 Confirmation, discipline, and risk management are essential for consistent BOF execution.


πŸ” Final Setup Assessment

πŸ›‘ The SONACOMS bearish BOF setup failed to develop as expected because price reclaimed and sustained above the β‚Ή792.00 VRZ High. πŸ“ˆ Strong bullish momentum carried the stock toward β‚Ή804.00, while subsequent pullbacks remained above the reference zone. ⚠️ The chart therefore favoured a bullish structure rather than the anticipated bearish reversal. The actual trade result depends on the entry, Stop Loss, and execution rules used.

NESTLEIND
FMCG
Success
VRZ Low Intraday Oct 13, 2026
🍫 NESTLEIND Intraday BOF Success: VRZ Low Reclaim Captures 2.69% Upside πŸš€
View Full Analysis β†’

🍫 NESTLEIND Intraday BOF Success: VRZ Low Reclaim Captures 2.69% Upside πŸš€


πŸ“Œ Stock Name: Nestle India Ltd. (NESTLEIND)

🏦 Sector: FMCG / Packaged Foods & Beverages

πŸ“Š Trade Type: Intraday

⏱️ Trading Time Frame: 5 Minutes

πŸ•’ VRZ Marking Time Frame: 30 Minutes

πŸ”„ Setup Type: Bullish Breakout Failure (BOF)

🟒 Zone: VRZ Low – β‚Ή1,316.00


BOF Scanner App identified this setup at 09:25 am


🎯 Weak Open Meets VRZ Low Support

πŸ”Ž NESTLEIND opened under pressure, with sellers pushing price toward support right from the first candles.

⚠️ Price moved into the β‚Ή1,316.00 VRZ Low, where a breakdown looked likely.

🎯 The VRZ Low became the key technical reference for spotting a potential bullish Breakout Failure.


πŸ”» Sellers Break Support, but the Move Fades

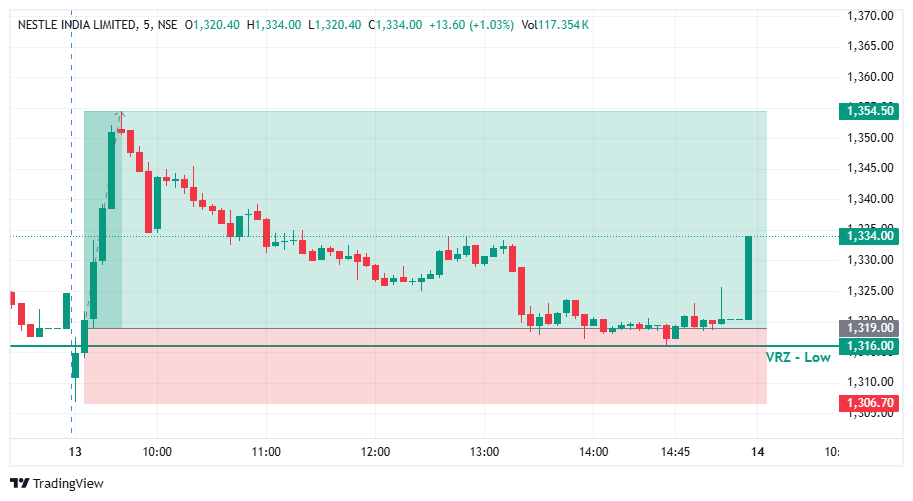
πŸ“‰ Price dipped below the β‚Ή1,316.00 VRZ Low and touched the β‚Ή1,306.70 area, showing a clear attempt by sellers to extend the downside.

πŸͺ€ The move below support could not hold, and follow-through selling faded quickly.

πŸ”„ Buyers stepped in near the lows, forming the first base for a bullish reversal.


πŸ”„ Bullish BOF Confirmed at the VRZ Low

🎯 Price closed back above the β‚Ή1,316.00 VRZ Low, confirming a Bullish Breakout Failure structure.

⚑ The failed breakdown showed that sellers had lost control below support.

πŸ“ˆ Once the level was reclaimed, short-term momentum shifted decisively toward the buyers.


πŸš€ Buyers Take Charge With a Sharp Rally

πŸ“ˆ After the VRZ Low rejection, NESTLEIND climbed quickly with a strong run of green candles.

⚑ Buyers pushed price out of the breakdown zone and into a fast bullish expansion.

πŸ’₯ The rally peaked near β‚Ή1,354.50, a 2.69% price expansion that confirmed the successful BOF outcome.


πŸ“Š Price Action & Market Structure

πŸ” The chart shows an early dip below the β‚Ή1,316.00 VRZ Low, a sharp recovery from the support area, and a strong move toward the highs.

🟒 Price later pulled back and retested the VRZ Low zone in the afternoon, and buyers defended it again.

πŸ“ˆ A late-session green candle lifted price back to β‚Ή1,334.00, keeping the bullish structure intact.

🎯 The shift from breakdown pressure to bullish expansion was the defining technical event of this setup.


🧠 Technical Analysis Insight

πŸ”Ž The main signal was the failed breakdown below the β‚Ή1,316.00 VRZ Low.

⚑ Sellers pushed price under support, but the move lacked sustained follow-through.

🟒 The reclaim of the VRZ Low signalled a change in short-term price structure.

πŸ“ˆ Buyers then drove the recovery to higher levels, producing the reported 2.69% move.


πŸ’‘ Key BOF Trading Insights

🟒 VRZ Low: β‚Ή1,316.00 served as the primary support reference.

⚠️ Breakdown Failure: Sellers could not hold price below the support zone.

πŸ›‘οΈ Buyer Defense: Buyers responded strongly near the β‚Ή1,306.70 low.

πŸ”„ Bullish Reclaim: Price recovered back above the key level.

πŸ“Š Momentum Shift: Short-term momentum turned bullish after the failed breakdown.

πŸš€ Upside Expansion: Price advanced toward the β‚Ή1,354.50 area.

πŸ† Trade Outcome: 2.69% upside with 1:3 RR.


πŸ›‘οΈ Risk Management Perspective

🎯 The β‚Ή1,316.00 VRZ Low, with the β‚Ή1,306.70 swing low just below it, gave a clearly defined risk reference for the bullish BOF setup.

βš–οΈ A defined risk below support against a larger upside move produced the 1:3 Risk-to-Reward outcome.

🧠 Structured position sizing, predefined invalidation levels, and disciplined execution matter when trading Breakout Failure setups.


πŸ“Š Live BOF Opportunities


🎯 Identify VRZ High & VRZ Low failures the moment they occur.

πŸ“Š Instantly see the stock, signal type, trigger price, and alert timing.

⚑ Monitor real-time Intraday & Swing BOF setups with continuous scanner alerts.


🎯 Trade Results

πŸ“ˆ Price Move: 2.69% upside following the VRZ Low rejection.

πŸ’° Risk-to-Reward: 1:3 RR achieved through structured trade execution.

🟒 Setup: Bullish BOF at VRZ Low after a failed breakdown.

🎯 Key Support: β‚Ή1,316.00 acted as the primary VRZ Low reference.

πŸ“ Price Area Reached: β‚Ή1,354.50 during the bullish expansion.

⚑ Momentum: Bullish momentum strengthened after the support reclaim.

πŸ”„ Price Action: Failed breakdown followed by a bullish reversal.

πŸ† Result: Successful Breakout Failure setup with 2.69% upside and 1:3 RR.

Scanner Chart Preview