
Select a trading day to view all Scanner results, chart evidence, and market explanations.
4 Scanners Available
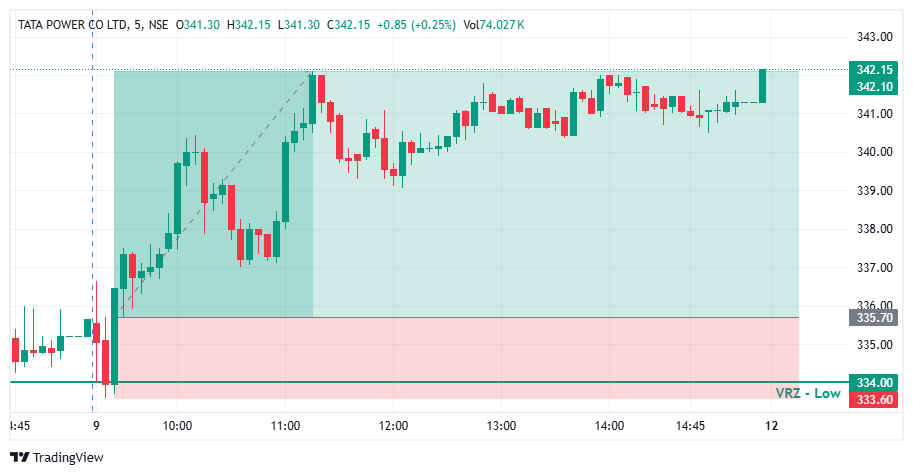

🔎 TATAPOWER opened with a quick dip and moved straight into the support area in the first candles.
⚠️ Price tested the ₹334.00 VRZ Low, where a breakdown looked likely.
🎯 The VRZ Low became the key technical reference for spotting a potential bullish Breakout Failure.
🔻 Price dipped below the ₹334.00 VRZ Low and tagged the ₹333.60 area, showing a clear attempt by sellers to extend the downside.
🚫 The move below support was shallow and could not hold.
🔄 Buyers stepped in right at the lows, forming the first base for a bullish reversal.
🎯 Price closed back above the ₹334.00 VRZ Low, confirming a Bullish Breakout Failure structure.
⚡ The failed breakdown showed that sellers had lost control below support.
📈 Once the level was reclaimed, short-term momentum shifted decisively toward the buyers.
📈 After the VRZ Low rejection, TATAPOWER climbed steadily with higher lows and strong green candles.
⚡ Trapped sellers covered and buyers pushed price out of the breakdown zone into a broader bullish recovery.
💥 The rally extended to around ₹342.15, a 1.91% price expansion that confirmed the successful BOF outcome.
🔍 The chart shows an early dip, a brief break of the ₹334.00 VRZ Low, and a sharp recovery from the support area.
🟢 The reclaim of the zone was the key confirmation for the bullish BOF structure.
📈 Price then travelled up to the ₹342.15 area and held firmly above the VRZ Low for the rest of the session.
🎯 The shift from breakdown pressure to bullish expansion was the defining technical event of this setup.
🔎 The main signal was the failed breakdown below the ₹334.00 VRZ Low.
⚡ Sellers pushed price under support, but the move lacked sustained follow-through.
🟢 The reclaim of the VRZ Low signalled a change in short-term price structure.
📈 Buyers then drove the recovery to higher levels, producing the reported 1.91% move.
🟢 VRZ Low: ₹334.00 served as the primary support reference.
🪤 Bear Trap: Sellers could not hold price below the support zone.
🛡️ Buyer Defense: Buyers responded strongly near the ₹333.60 low.
🔄 Bullish Reclaim: Price recovered back above the key level.
📊 Momentum Shift: Short-term momentum turned bullish after the failed breakdown.
🚀 Upside Expansion: Price advanced toward the ₹342.15 area.
🏆 Trade Outcome: 1.91% upside with 1:3 RR.
🎯 The ₹334.00 VRZ Low, with the ₹333.60 swing low just below it, gave a tight and clearly defined risk reference for the bullish BOF setup.
⚖️ A small, defined risk against a larger upside move produced the 1:3 Risk-to-Reward outcome.
🧠 Structured position sizing, predefined invalidation levels, and disciplined execution matter when trading Breakout Failure setups.
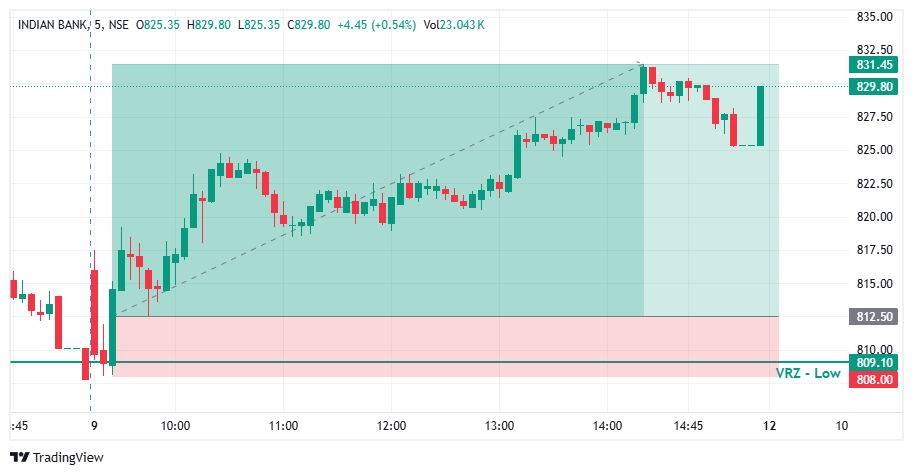

🔎 INDIAN BANK experienced selling pressure before testing the ₹809.10 VRZ Low, an important support reference on the chart.
⚠️ The decline brought price toward the marked support zone, raising the possibility of a breakdown below the established level.
🎯 This support area became the key reference for monitoring a potential bullish reversal through the Breakout Failure (BOF) strategy.
📉 Price moved toward and briefly below the VRZ Low area as sellers attempted to extend the downside.
🪤 However, the bearish move failed to sustain, and price recovered from the lower zone.
🟢 Buyers stepped in around support, creating the conditions for a potential bullish BOF reversal.
🎯 The recovery from the VRZ Low developed into a Bullish Breakout Failure setup.
⚡ Price reclaimed the support region as buying pressure increased.
📈 The failed breakdown signaled a potential shift in short-term momentum, with buyers gaining control of the subsequent price movement.
📈 Following the VRZ Low rejection, INDIAN BANK advanced steadily toward higher price levels.
⚡ The recovery developed into an upward intraday trend, with price forming higher levels through much of the session.
💥 The bullish move extended toward the ₹831.45 area, producing the reported 2.33% price move.
🔍 The chart highlights a recovery from the VRZ Low followed by a sustained upward price movement.
🟢 Support Rejection: Price recovered after testing the lower support region.
🔄 Structure Shift: The move away from the VRZ Low indicated improving short-term bullish momentum.
📈 Higher Price Levels: Price advanced through the session toward the upper marked area.
🎯 Technical Reference: The ₹809.10 VRZ Low remained the key level for evaluating the bullish BOF structure.
🔎 The key feature of this setup was the failed breakdown around the VRZ Low, followed by a recovery and sustained upward movement.
⚠️ Sellers attempted to extend the decline, but price recovered from the support region.
🔄 The reclaim indicated that bearish momentum was weakening and buyers were gaining control.
📈 The subsequent upward price expansion aligned with the bullish BOF structure and produced the reported 2.33% move.
🟢 VRZ Low: ₹809.10 served as the key support reference.
🔻 Breakdown Attempt: Sellers tested the lower zone but failed to sustain downside pressure.
🛡️ Support Defense: Buyers responded around the VRZ Low.
🔄 Bullish Reclaim: Price recovered from the support region.
📊 Momentum Shift: Price action developed into an upward intraday trend.
🚀 Price Expansion: INDIAN BANK moved toward the ₹831.45 area.
🏆 Trade Outcome: 2.33% move with 1:4 RR.
🎯 The VRZ Low provided an important technical reference for assessing the bullish BOF setup.
⚖️ The reported 1:4 risk-to-reward ratio represents a potential reward of four units for every unit of risk, based on the trade's defined risk and target.
🧠 Predefined invalidation levels, appropriate position sizing, and disciplined execution remain important when trading Breakout Failure setups.

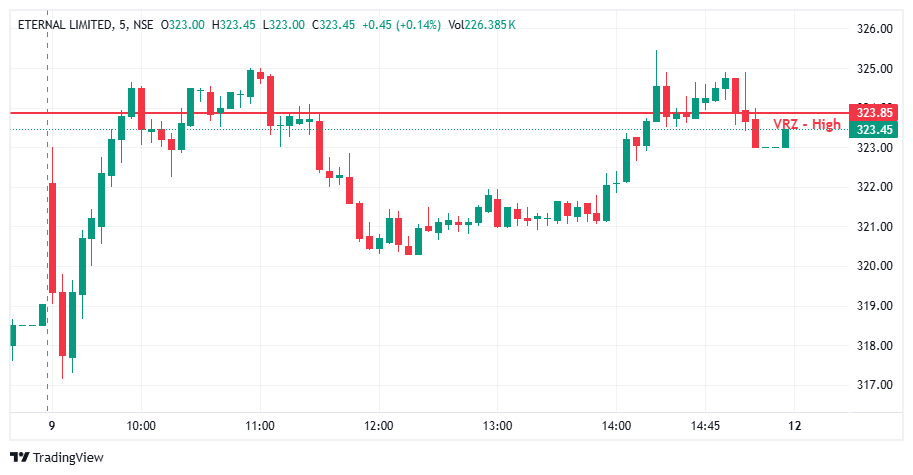

📈 ETERNAL recovered strongly during the morning session and moved toward the ₹323.85 VRZ High. 🎯 A potential BOF setup triggered around 10:05 AM, creating a trading opportunity. ⚠️ However, the expected price movement did not follow through as anticipated, and the trade eventually hit its predefined Stop Loss.
🕙 The BOF trigger appeared at 10:05 AM, but the price action failed to support the trade as expected. ⚠️ The setup moved against the position, and the Stop Loss was hit at 10:55 AM. 🛑 Once the SL was triggered, the original trade was closed according to the predefined risk-management rules.
🔄 After the Stop Loss event, ETERNAL continued moving around the VRZ High and later showed another price move. 📈 That subsequent movement reportedly offered a potential 1:5 risk-reward opportunity. ⚠️ However, this move occurred after the original trade had already been stopped out and cannot be counted as a successful outcome for that executed trade.
🎯 The trade must be evaluated using the actual entry and exit sequence. 🛑 Since the Stop Loss was hit at 10:55 AM, the original setup must be recorded as a failed trade. 📊 The later 1:5 RR move is a separate market opportunity and does not change the outcome of the stopped-out position.
🔒 A predefined Stop Loss protects capital when the expected setup fails. 🛑 Once the SL is hit, the trade is complete under the original plan. 🧭 Maintaining this rule helps ensure that backtesting results reflect actual execution rather than later price movements.
👀 The main psychological challenge is seeing price move favorably after a Stop Loss and feeling that the original trade should have worked. ⚠️ This is hindsight bias. 🧠 Traders should separate the actual trade result from any later opportunity that develops after the position has closed.
📌 A later 1:5 RR move does not turn an SL-hit trade into a successful trade. 🎯 ETERNAL triggered around 10:05 AM, but the Stop Loss was hit at 10:55 AM. 📊 The original setup must therefore remain classified as a failure, while the subsequent move can be reviewed separately for future strategy improvements.
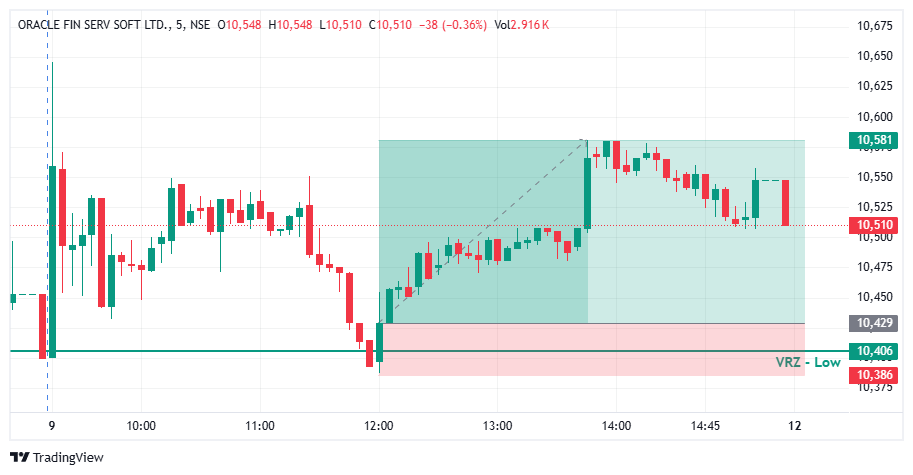

🔎 OFSS traded in a range through the morning, then turned lower with steady selling into midday.
⚠️ Price slid toward the ₹10,406.00 VRZ Low, where a breakdown looked likely.
🎯 The VRZ Low became the key technical reference for spotting a potential bullish Breakout Failure.
📉 Price dipped below the ₹10,406.00 VRZ Low and touched the ₹10,386.00 area, showing a clear attempt by sellers to extend the downside.
🪤 The move below support was shallow and could not hold.
🔄 Buyers stepped in right at the lows, forming the first base for a bullish reversal.
🎯 Price closed back above the ₹10,406.00 VRZ Low, confirming a Bullish Breakout Failure structure.
⚡ The failed breakdown showed that sellers had lost control below support.
📈 Once the level was reclaimed, short-term momentum shifted decisively toward the buyers.
📈 After the VRZ Low rejection, OFSS climbed steadily with higher lows through the afternoon session.
⚡ Buyers pushed price out of the breakdown zone and into a broader bullish recovery.
💥 A strong breakout candle lifted price to ₹10,581.00, a 1.46% price expansion that confirmed the successful BOF outcome.
🔍 The chart shows a midday sell-off, a brief break of the ₹10,406.00 VRZ Low, and a steady recovery from the support area.
🟢 The reclaim of the zone was the key confirmation for the bullish BOF structure.
📈 Price then travelled up to the ₹10,581.00 area, showing how quickly momentum can turn after a trapped breakdown.
🎯 The shift from breakdown pressure to bullish expansion was the defining technical event of this setup.
🔎 The main signal was the failed breakdown below the ₹10,406.00 VRZ Low.
⚡ Sellers pushed price under support, but the move lacked sustained follow-through.
🟢 The reclaim of the VRZ Low signalled a change in short-term price structure.
📈 Buyers then drove the recovery to higher levels, producing the reported 1.46% move.
🟢 VRZ Low: ₹10,406.00 served as the primary support reference.
⚠️ Breakdown Failure: Sellers could not hold price below the support zone.
🛡️ Buyer Defense: Buyers responded strongly near the ₹10,386.00 low.
🔄 Bullish Reclaim: Price recovered back above the key level.
📊 Momentum Shift: Short-term momentum turned bullish after the failed breakdown.
🚀 Upside Expansion: Price advanced toward the ₹10,581.00 area.
🏆 Trade Outcome: 1.46% upside with 1:3 RR.
🎯 The ₹10,406.00 VRZ Low, with the ₹10,386.00 swing low just below it, gave a tight and clearly defined risk reference for the bullish BOF setup.
⚖️ A small, defined risk against a larger upside move produced the 1:3 Risk-to-Reward outcome.
🧠 Structured position sizing, predefined invalidation levels, and disciplined execution matter when trading Breakout Failure setups.

🔍 Scan for VRZ High & VRZ Low breakout failures as they emerge.