
Select a trading day to view all Scanner results, chart evidence, and market explanations.
7 Scanners Available
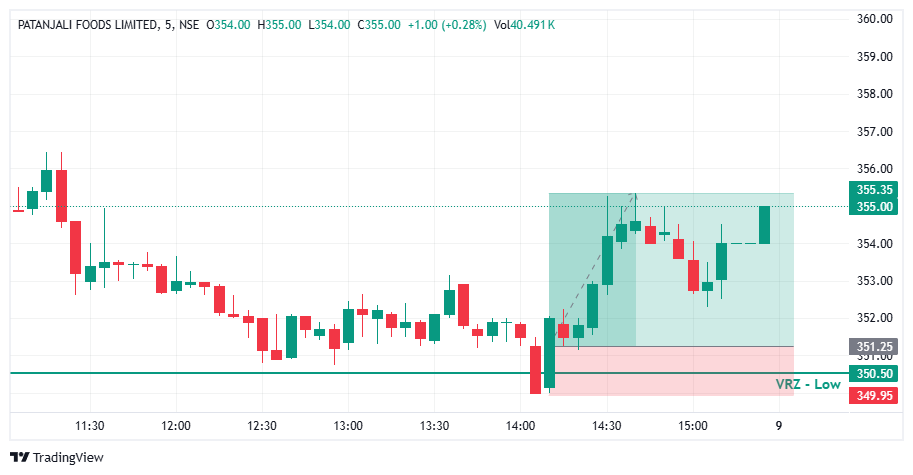

🔎 PATANJALI faded through the morning and spent the afternoon drifting in a tight range above support.
⚠️ Price kept pressing toward the ₹350.50 VRZ Low, where a breakdown looked likely.
🎯 The VRZ Low became the key technical reference for spotting a potential bullish Breakout Failure.
📉 A sharp sell-off pushed price below the ₹350.50 VRZ Low and into the ₹349.95 area, showing a clear attempt by sellers to extend the downside.
🪤 The move below support could not hold, and follow-through selling faded quickly.
🔄 Buyers stepped in right at the lows, forming the first base for a bullish reversal.
🎯 Price closed back above the ₹350.50 VRZ Low, confirming a Bullish Breakout Failure structure.
⚡ The failed breakdown showed that sellers had lost control below support.
📈 Once the level was reclaimed, short-term momentum shifted decisively toward the buyers.
📈 After the VRZ Low rejection, PATANJALI climbed steadily with higher lows and strong green candles.
⚡ Buyers pushed price out of the breakdown zone and into a broader bullish recovery.
💥 The rally peaked near ₹355.35, a 1.17% price expansion that confirmed the successful BOF outcome.
🔍 The chart shows a gradual sell-off, a sharp late-session break of the ₹350.50 VRZ Low, and a quick recovery from the support area.
🟢 The reclaim of the zone was the key confirmation for the bullish BOF structure.
📈 Price then travelled up to the ₹355.35 area, showing how quickly momentum can turn after a trapped breakdown.
🎯 The shift from breakdown pressure to bullish expansion was the defining technical event of this setup.
🔎 The main signal was the failed breakdown below the ₹350.50 VRZ Low.
⚡ Sellers pushed price under support, but the move lacked sustained follow-through.
🟢 The reclaim of the VRZ Low signalled a change in short-term price structure.
📈 Buyers then drove the recovery to higher levels, producing the reported 1.17% move.
🟢 VRZ Low: ₹350.50 served as the primary support reference.
⚠️ Breakdown Failure: Sellers could not hold price below the support zone.
🛡️ Buyer Defense: Buyers responded strongly near the ₹349.95 low.
🔄 Bullish Reclaim: Price recovered back above the key level.
📊 Momentum Shift: Short-term momentum turned bullish after the failed breakdown.
🚀 Upside Expansion: Price advanced toward the ₹355.35 area.
🏆 Trade Outcome: 1.17% upside with 1:3 RR.
🎯 The ₹350.50 VRZ Low, with the ₹349.95 swing low just below it, gave a tight and clearly defined risk reference for the bullish BOF setup.
⚖️ A small, defined risk against a larger upside move produced the 1:3 Risk-to-Reward outcome.
🧠 Structured position sizing, predefined invalidation levels, and disciplined execution matter when trading Breakout Failure setups.
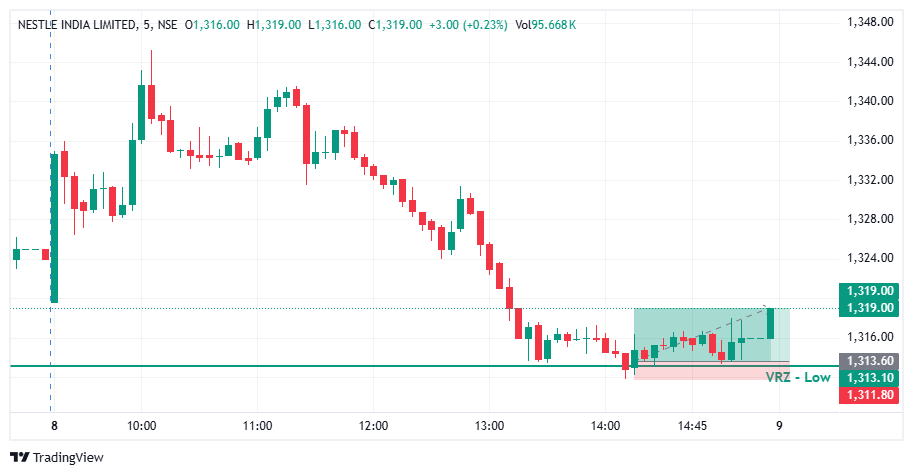

🔎 NESTLEIND faded from its morning highs and slid steadily through the afternoon session.
⚠️ Price kept moving toward the ₹1,313.10 VRZ Low, where a breakdown looked likely.
🎯 The VRZ Low became the key technical reference for spotting a potential bullish Breakout Failure.
🔻 Price dipped below the ₹1,313.10 VRZ Low and tagged the ₹1,311.80 area, showing a clear attempt by sellers to extend the downside.
🚫 The move below support was shallow and could not hold.
🔄 Buyers stepped in right at the lows, forming the first base for a bullish reversal.
🎯 Price closed back above the ₹1,313.10 VRZ Low, confirming a Bullish Breakout Failure structure.
⚡ The failed breakdown showed that sellers had lost control below support.
📈 Once the level was reclaimed, short-term momentum shifted toward the buyers.
📈 After the VRZ Low rejection, NESTLEIND climbed steadily with higher lows and a strong green breakout candle.
⚡ Trapped sellers covered and buyers pushed price out of the breakdown zone into a bullish recovery.
💥 The rally extended to around ₹1,319.00, a 0.41% price expansion that confirmed the successful BOF outcome.
🔍 The chart shows a morning rally, a steady afternoon sell-off, a brief break of the ₹1,313.10 VRZ Low, and a clean recovery from the support area.
🟢 The reclaim of the zone was the key confirmation for the bullish BOF structure.
📈 Price then travelled up to the ₹1,319.00 area, showing how quickly momentum can turn after a trapped breakdown.
🎯 The shift from breakdown pressure to bullish expansion was the defining technical event of this setup.
🔎 The main signal was the failed breakdown below the ₹1,313.10 VRZ Low.
⚡ Sellers pushed price under support, but the move lacked sustained follow-through.
🟢 The reclaim of the VRZ Low signalled a change in short-term price structure.
📈 Buyers then drove the recovery to higher levels, producing the reported 0.41% move.
🟢 VRZ Low: ₹1,313.10 served as the primary support reference.
🪤 Bear Trap: Sellers could not hold price below the support zone.
🛡️ Buyer Defense: Buyers responded strongly near the ₹1,311.80 low.
🔄 Bullish Reclaim: Price recovered back above the key level.
📊 Momentum Shift: Short-term momentum turned bullish after the failed breakdown.
🚀 Upside Expansion: Price advanced toward the ₹1,319.00 area.
🏆 Trade Outcome: 0.41% upside with 1:3 RR.
🎯 The ₹1,313.10 VRZ Low, with the ₹1,311.80 swing low just below it, gave a tight and clearly defined risk reference for the bullish BOF setup.
⚖️ A small, defined risk against a larger upside move produced the 1:3 Risk-to-Reward outcome.
🧠 Structured position sizing, predefined invalidation levels, and disciplined execution matter when trading Breakout Failure setups.
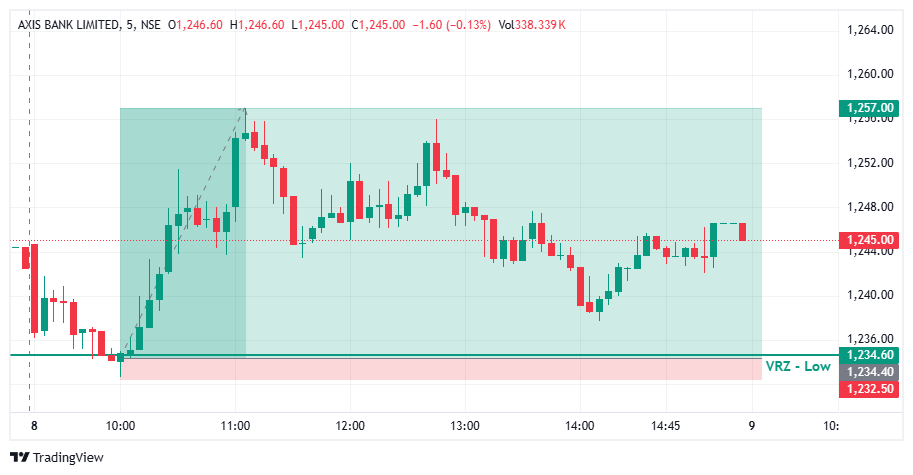

🔎 AXISBANK opened with a weak start and slid steadily through the opening session.
⚠️ Price kept moving toward the ₹1,234.60 VRZ Low, where a breakdown looked likely.
🎯 The VRZ Low became the key technical reference for spotting a potential bullish Breakout Failure.
📉 Price dipped below the ₹1,234.60 VRZ Low and touched the ₹1,232.50 area, showing a clear attempt by sellers to extend the downside.
🪤 The move below support was shallow and could not hold.
🔄 Buyers stepped in right at the lows, forming the first base for a bullish reversal.
🎯 Price closed back above the ₹1,234.60 VRZ Low, confirming a Bullish Breakout Failure structure.
⚡ The failed breakdown showed that sellers had lost control below support.
📈 Once the level was reclaimed, short-term momentum shifted decisively toward the buyers.
📈 After the VRZ Low rejection, AXISBANK climbed sharply with higher lows and strong green candles.
⚡ Buyers pushed price out of the breakdown zone and into a broader bullish recovery.
💥 The rally peaked near ₹1,257.00, a 1.83% price expansion that confirmed the successful BOF outcome.
🔍 The chart shows an early sell-off, a brief break of the ₹1,234.60 VRZ Low, and a sharp recovery from the support area.
🟢 The reclaim of the zone was the key confirmation for the bullish BOF structure.
📈 Price then travelled up to the ₹1,257.00 area, showing how quickly momentum can turn after a trapped breakdown.
🎯 The shift from breakdown pressure to bullish expansion was the defining technical event of this setup.
🔎 The main signal was the failed breakdown below the ₹1,234.60 VRZ Low.
⚡ Sellers pushed price under support, but the move lacked sustained follow-through.
🟢 The reclaim of the VRZ Low signalled a change in short-term price structure.
📈 Buyers then drove the recovery to higher levels, producing the reported 1.83% move.
🟢 VRZ Low: ₹1,234.60 served as the primary support reference.
⚠️ Breakdown Failure: Sellers could not hold price below the support zone.
🛡️ Buyer Defense: Buyers responded strongly near the ₹1,232.50 low.
🔄 Bullish Reclaim: Price recovered back above the key level.
📊 Momentum Shift: Short-term momentum turned bullish after the failed breakdown.
🚀 Upside Expansion: Price advanced toward the ₹1,257.00 area.
🏆 Trade Outcome: 1.83% upside with 1:12 RR.
🎯 The ₹1,234.60 VRZ Low, with the ₹1,232.50 swing low just below it, gave a very tight and clearly defined risk reference for the bullish BOF setup.
⚖️ A small, defined risk against a much larger upside move produced the 1:12 Risk-to-Reward outcome.
🧠 Structured position sizing, predefined invalidation levels, and disciplined execution matter when trading Breakout Failure setups.

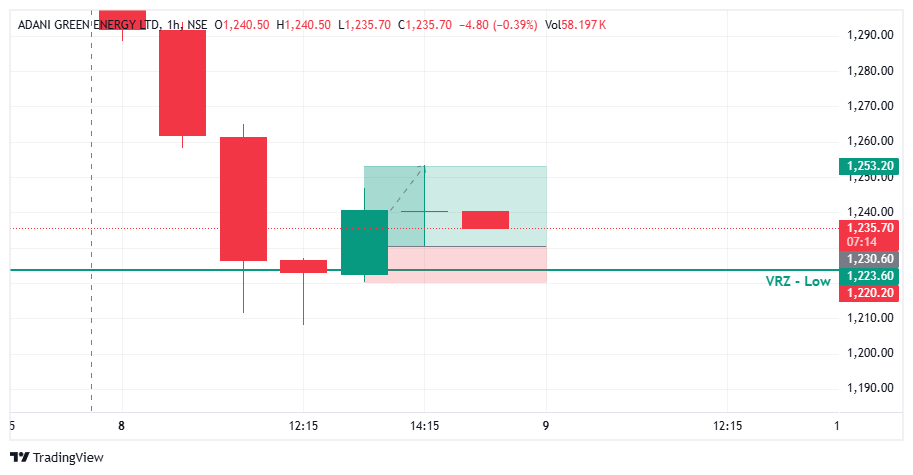

🔻 ADANIGREEN slipped below the ₹1,223.60 VRZ Low, with wicks dipping towards the ₹1,210 region.
⚠️ Despite the dip, the sellers could not hold price under the zone.
🟢 Buyers stepped in aggressively and pushed price back above the VRZ Low.
📈 A strong bullish hourly candle reclaimed the zone and signalled a shift in control.
✅ This rejection and reclaim confirmed the Breakout Failure (BOF) setup.
🚀 As breakdown sellers got trapped, ADANIGREEN delivered a 1.84% upside move, achieving the planned 1:2 risk-reward target.
🔎 Price had been falling steadily with strong bearish candles before reaching the VRZ Low.
🔻 Sellers tried to push through the support zone and extend the decline.
🟢 Long lower wicks below ₹1,223.60 showed that buyers were absorbing the selling pressure.
🔄 A bullish candle then closed back above the VRZ Low, shifting the short-term structure to the upside.
📈 Price moved toward the target zone, confirming the reversal momentum.
Initially, traders could have expected:
🔻 The bearish trend to continue after multiple red candles.
📉 A clean breakdown below the VRZ Low.
🐻 Sellers to stay in command.
But the market told a different story.
😮 Fresh short sellers were trapped below support.
🟢 Buyers defended the VRZ Low with conviction.
📈 Price reclaimed the zone and attracted new buying interest.
🚀 This sentiment shift powered the successful bullish BOF move.
🔴 Sellers pressed price below the VRZ Low, hoping for a fresh leg down.
🟢 Buyers absorbed that pressure around ₹1,223.60 and refused to let the zone break.
⚖️ Once price recovered above the zone, seller conviction collapsed.
🔄 Trapped shorts covering positions added fuel to the upside.
📈 Fresh buyers joined in and accelerated the bounce.
🔹 VRZ Low Rejection
The predefined support zone drew strong buying interest after the failed breakdown.
🔹 Breakdown Failure
Price could not sustain below ₹1,223.60, weakening the bearish case.
🔹 Bullish Reclaim
The hourly close back above the VRZ Low confirmed the reversal.
🔹 Momentum Confirmation
The strong green candle showed buyers were taking control.
🔹 Controlled Risk
A clearly defined invalidation level kept risk small against a 1:2 reward.
🎯 Don't Panic on a Support Break
A brief move below support doesn't always mean a true breakdown.
🔍 Watch the Reaction at the VRZ
Long wicks and rejection at a predefined VRZ Low can reveal early buyer participation.
📈 Wait for the Reclaim
A close back above the failed zone strengthens the bullish BOF signal.
⚡ Trapped Sellers Add Fuel
When price recovers above support, shorts are forced to exit, which adds momentum.
✅ Mark the VRZ Low before the session begins.
✅ Observe how price behaves around the support zone.
✅ Don't assume every breakdown will follow through.
✅ Wait for rejection and reclaim confirmation.
✅ Define your stop-loss before entering.
✅ Stay disciplined with risk management throughout.
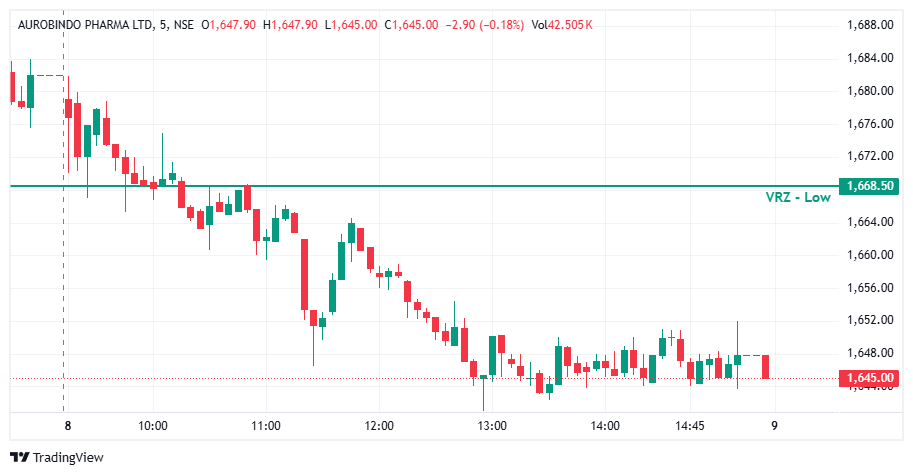

📉 AUROPHARMA opened under noticeable selling pressure and gradually moved toward the ₹1,668.50 VRZ Low. ⚠️ After breaking below the key level, the expected bullish reversal failed to gain traction. 🔻 Price remained beneath the VRZ Low and continued to develop a weak intraday structure.
🔎 Following the breakdown, price consistently traded below ₹1,668.50 and formed a sequence of lower highs and lower lows. 🧱 Recovery attempts remained weak, with buyers unable to push price back above the key reversal zone. 📉 The sustained trading below the VRZ Low kept sellers in control.
🎯 The bullish BOF required a decisive reclaim of ₹1,668.50 followed by sustained acceptance above the zone. 🚫 Instead, price repeatedly failed to recover the broken level. 🔴 With no convincing reclaim or bullish follow-through, the expected reversal setup gradually lost validity.
🟥 Bearish candles dominated the major downside phases of the session. 🟢 Although occasional green candles appeared during intraday consolidation, they failed to create meaningful upside momentum. 📊 The inability of buyers to sustain recovery kept the broader price action bearish.
🎯 The bullish BOF required reclaim + acceptance + bullish follow-through above ₹1,668.50. 🚫 Since these conditions did not materialize, the setup lacked sufficient confirmation for a sustained bullish entry. 🧭 Waiting for a genuine reclaim would have provided stronger trade validation and reduced exposure to the continuing downside move.
🔐 When a BOF setup fails to reclaim its reference zone, the original reversal thesis should be reassessed quickly. ⚠️ Holding onto a bullish bias while price remains below the VRZ Low can increase downside risk. 🧯 Respecting the invalidation level helps protect capital when the anticipated reversal does not develop.
👀 A breakdown near a VRZ level can create an expectation that price will soon reverse. ⚠️ However, a potential reversal is not confirmed until buyers demonstrate actual strength. 🧠 AUROPHARMA highlights why traders should avoid anticipating the reclaim and instead wait for clear evidence that the broken level has turned back into support.
📍 ₹1,668.50 remained the critical decision level for this setup. 🔻 Price failed to reclaim the VRZ Low and instead continued to trade below it for most of the session. 🎯 The setup reinforces the importance of waiting for rejection, reclaim and sustained acceptance before validating a bullish BOF reversal.
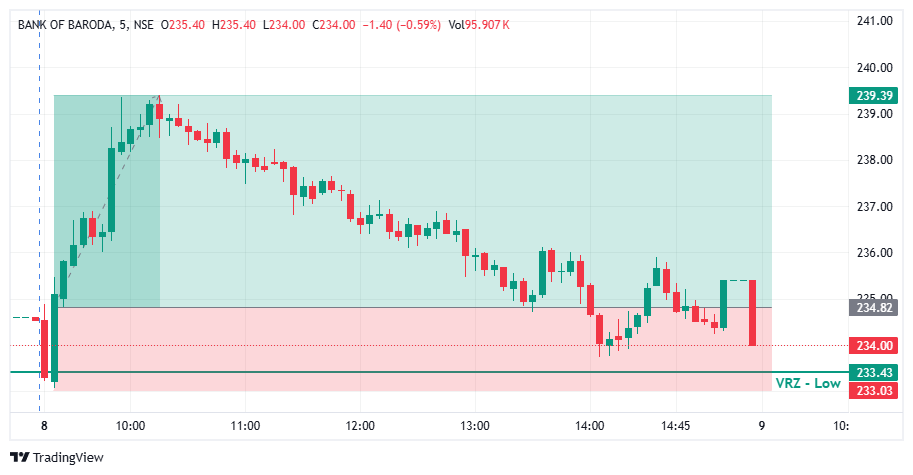

🔎 BANKBARODA opened under pressure and slipped quickly toward support in the first candles.
⚠️ Price moved into the ₹233.43 VRZ Low, where a breakdown looked likely.
🎯 The VRZ Low became the key technical reference for spotting a potential bullish Breakout Failure.
🔻 Price dipped below the ₹233.43 VRZ Low and tagged the ₹233.03 area, showing a clear attempt by sellers to extend the downside.
🚫 The move below support was shallow and could not hold.
🔄 Buyers stepped in right at the lows, forming the first base for a bullish reversal.
🎯 Price closed back above the ₹233.43 VRZ Low, confirming a Bullish Breakout Failure structure.
⚡ The failed breakdown showed that sellers had lost control below support.
📈 Once the level was reclaimed, short-term momentum shifted decisively toward the buyers.
📈 After the VRZ Low rejection, BANKBARODA climbed steadily with higher lows and strong green candles.
⚡ Trapped sellers covered and buyers pushed price out of the breakdown zone into a sharp bullish recovery.
💥 The rally extended to around ₹239.39, a 1.95% price expansion that confirmed the successful BOF outcome.
🔍 The chart shows an opening dip, a brief break of the ₹233.43 VRZ Low, and a sharp recovery from the support area.
🟢 The reclaim of the zone was the key confirmation for the bullish BOF structure.
📈 Price then travelled up to the ₹239.39 area, showing how quickly momentum can turn after a trapped breakdown.
🎯 The shift from breakdown pressure to bullish expansion was the defining technical event of this setup.
🔎 The main signal was the failed breakdown below the ₹233.43 VRZ Low.
⚡ Sellers pushed price under support, but the move lacked sustained follow-through.
🟢 The reclaim of the VRZ Low signalled a change in short-term price structure.
📈 Buyers then drove the recovery to higher levels, producing the reported 1.95% move.
🟢 VRZ Low: ₹233.43 served as the primary support reference.
🪤 Bear Trap: Sellers could not hold price below the support zone.
🛡️ Buyer Defense: Buyers responded strongly near the ₹233.03 low.
🔄 Bullish Reclaim: Price recovered back above the key level.
📊 Momentum Shift: Short-term momentum turned bullish after the failed breakdown.
🚀 Upside Expansion: Price advanced toward the ₹239.39 area.
🏆 Trade Outcome: 1.95% upside with 1:2 RR.
🎯 The ₹233.43 VRZ Low, with the ₹233.03 swing low just below it, gave a tight and clearly defined risk reference for the bullish BOF setup.
⚖️ A small, defined risk against a larger upside move produced the 1:2 Risk-to-Reward outcome.
🧠 Structured position sizing, predefined invalidation levels, and disciplined execution matter when trading Breakout Failure setups.
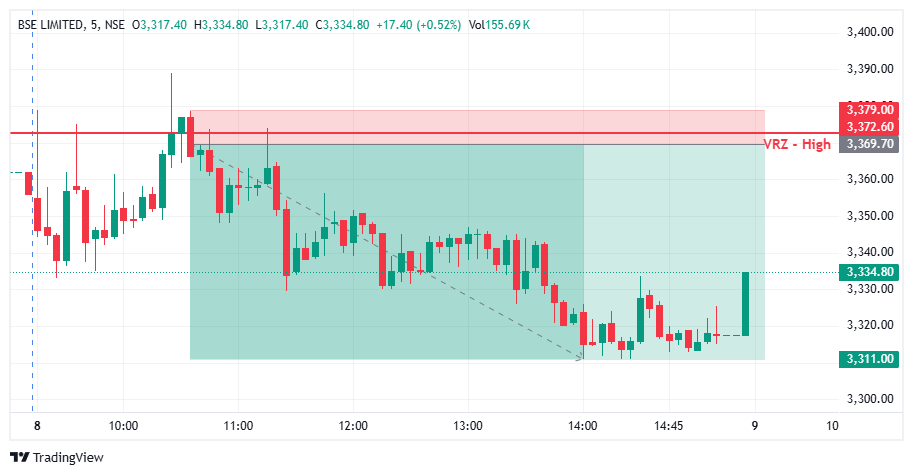

🔺 BSE approached the VRZ High, where buyers attempted to sustain price above the resistance zone.
⚠️ The breakout failed to hold, and price quickly moved back below the ₹3,369.70 VRZ High.
🔴 This rejection confirmed a Breakout Failure (BOF) setup and created a bearish intraday opportunity.
🔻 Sellers gained control following the VRZ High rejection.
📊 The failure to sustain higher levels around ₹3,369.70 highlighted weakening buying pressure.
🚀 The setup eventually delivered a 1.74% bearish move with a strong 1:6 Risk-Reward.
🟢 Buyers: Attempted to push BSE above the VRZ High.
🟠 Breakout Traders: Came under pressure as price failed to sustain the breakout.
🔴 Sellers: Regained control and drove the bearish reversal.
🎭 The initial breakout attempt created bullish expectations.
⚠️ Failure to sustain above the VRZ High weakened buyer confidence.
📉 The rejection shifted short-term momentum toward sellers and supported the downside move.
🎯 The key confirmation came when BSE rejected the ₹3,369.70 VRZ High and moved back below the breakout area.
🔄 The failed breakout indicated that buying momentum was losing strength.
⚡ Continued bearish follow-through validated the BOF structure.
🔸 Failed Breakouts Can Trap Buyers
A failed move above resistance can put breakout positions under pressure.
🔹 VRZ High Rejection
The ₹3,369.70 zone acted as a key reference for identifying the bearish reversal.
🛡️ Defined Risk Supports Trade Discipline
The VRZ High provided a clear technical level for structured risk management.
📉 Downside Momentum
Once sellers regained control, BSE continued developing a bearish intraday move.
📉 Following the VRZ High rejection, BSE developed a weaker price structure.
🔴 Sellers maintained pressure as price moved away from the resistance zone.
🚀 The developing structure supported continued downside momentum.
🔥 Selling pressure strengthened after the failed breakout.
📉 BSE extended the bearish move from the VRZ High.
🏆 The setup delivered a 1.74% downside move with 1:6 RR.
🔸 The setup became actionable after BSE failed to sustain above the ₹3,369.70 VRZ High.
📉 Sellers regained control and pushed price lower from the rejection zone.
⚖️ The confirmed BOF structure provided a defined-risk intraday setup with 1:6 Risk-Reward.
