
Select a trading day to view all Scanner results, chart evidence, and market explanations.
5 Scanners Available
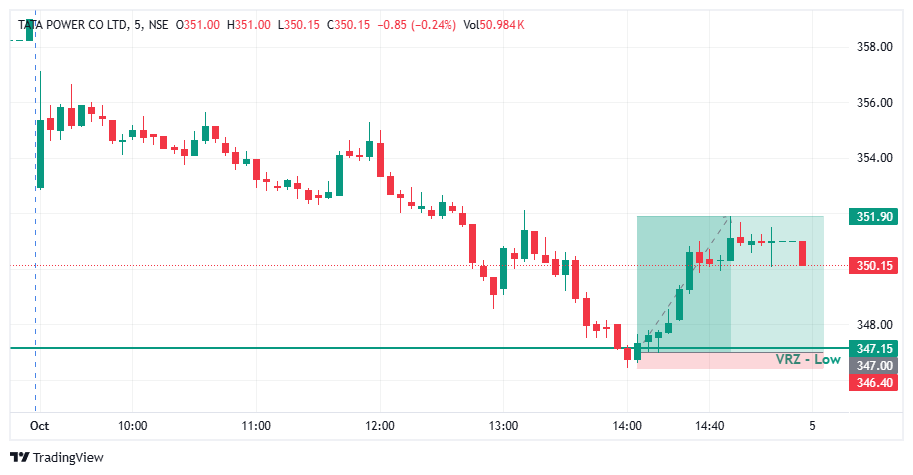

🔎 TATAPOWER remained under selling pressure during the session before moving toward the important ₹347.15 VRZ Low.
⚠️ The decline brought price into the marked support zone, creating the possibility of a breakdown below the established level.
🎯 The VRZ Low became the key technical reference for identifying a potential bullish reversal.
📉 Price tested the ₹347.15 VRZ Low after a sustained intraday decline.
🪤 Sellers attempted to extend the downside move, but the bearish pressure failed to produce continued weakness below the support zone.
🔄 Buyers stepped in around the VRZ Low, creating the initial structure for a bullish Breakout Failure setup.
🎯 The rejection from the VRZ Low developed into a Bullish Breakout Failure (BOF) structure.
⚡ Price recovered from the support area as buyers began gaining short-term control.
📈 The move away from the VRZ Low confirmed a shift from bearish pressure toward bullish price action.
📈 Following the VRZ Low rejection, TATAPOWER advanced strongly from the lower support area.
⚡ Buyers pushed price higher through the recovery phase, developing a clear bullish momentum shift.
💥 Price moved toward the ₹351.90 area, producing the reported 1.41% upside move.
🔍 The chart shows a prolonged intraday decline followed by a sharp recovery from the ₹347.15 VRZ Low.
🟢 The support rejection became the critical turning point in the setup.
📈 After reclaiming the lower zone, price developed a strong upward move toward the ₹351.90 area.
🎯 This transition from downside pressure to bullish recovery formed the core of the successful BOF structure.
🔎 The key technical development was the failed breakdown around the ₹347.15 VRZ Low.
⚠️ Sellers had controlled the earlier price movement, but downside momentum weakened near the marked support.
🔄 The subsequent recovery from the VRZ Low indicated a short-term shift in market structure.
📈 Buyers then drove the price toward higher levels, resulting in the reported 1.41% move.
🟢 VRZ Low: ₹347.15 served as the key support reference.
⚠️ Breakdown Failure: Sellers failed to sustain downside pressure below the zone.
🛡️ Buyer Defense: Buyers responded strongly around the VRZ Low.
🔄 Bullish Reclaim: Price recovered from the marked support area.
📊 Momentum Shift: Short-term momentum turned bullish after the failed breakdown.
🚀 Upside Expansion: Price advanced toward the ₹351.90 area.
🏆 Trade Outcome: 1.41% upside with 1:8 RR.
🎯 The ₹347.15 VRZ Low provided a defined technical reference for the bullish BOF setup.
⚖️ The reported 1:8 Risk-to-Reward highlights the trade's planned risk-to-reward relationship.
🧠 Position sizing, predefined invalidation levels, and disciplined execution remain important when trading Breakout Failure setups.
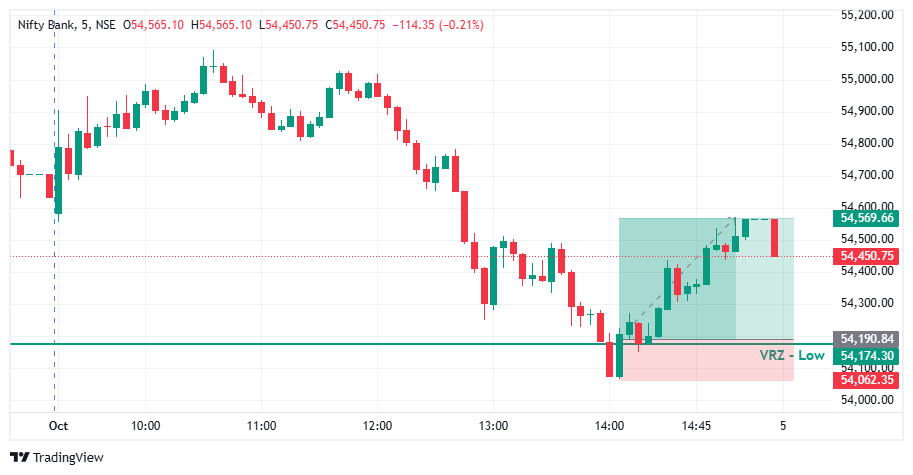

🔎 Nifty Bank faded from its morning highs and slid steadily through the second half of the session.
⚠️ Price kept moving toward the ₹54,174.30 VRZ Low, where a breakdown looked likely.
🎯 The VRZ Low became the key technical reference for spotting a potential bullish Breakout Failure.
🔻 Price dipped below the ₹54,174.30 VRZ Low and tagged the ₹54,062.35 area, showing a clear attempt by sellers to extend the downside.
🚫 The move below support was shallow and could not hold.
🔄 Buyers stepped in right at the lows, forming the first base for a bullish reversal.
🎯 Price closed back above the ₹54,174.30 VRZ Low, confirming a Bullish Breakout Failure structure.
⚡ The failed breakdown showed that sellers had lost control below support.
📈 Once the level was reclaimed, short-term momentum shifted decisively toward the buyers.
📈 After the VRZ Low rejection, Nifty Bank climbed steadily with higher lows and strong green candles.
⚡ Trapped sellers covered and buyers pushed price out of the breakdown zone into a broader bullish recovery.
💥 The rally extended to around ₹54,569.66, a 0.70% price expansion that confirmed the successful BOF outcome.
🔍 The chart shows a morning rally, an extended afternoon sell-off, a brief break of the ₹54,174.30 VRZ Low, and a sharp recovery from the support area.
🟢 The reclaim of the zone was the key confirmation for the bullish BOF structure.
📈 Price then travelled up to the ₹54,569.66 area, showing how quickly momentum can turn after a trapped breakdown.
🎯 The shift from breakdown pressure to bullish expansion was the defining technical event of this setup.
🔎 The main signal was the failed breakdown below the ₹54,174.30 VRZ Low.
⚡ Sellers pushed price under support, but the move lacked sustained follow-through.
🟢 The reclaim of the VRZ Low signalled a change in short-term price structure.
📈 Buyers then drove the recovery to higher levels, producing the reported 0.70% move.
🟢 VRZ Low: ₹54,174.30 served as the primary support reference.
🪤 Bear Trap: Sellers could not hold price below the support zone.
🛡️ Buyer Defense: Buyers responded strongly near the ₹54,062.35 low.
🔄 Bullish Reclaim: Price recovered back above the key level.
📊 Momentum Shift: Short-term momentum turned bullish after the failed breakdown.
🚀 Upside Expansion: Price advanced toward the ₹54,569.66 area.
🏆 Trade Outcome: 0.70% upside with 1:3 RR.
🎯 The ₹54,174.30 VRZ Low, with the ₹54,062.35 swing low just below it, gave a clearly defined risk reference for the bullish BOF setup.
⚖️ A small, defined risk against a larger upside move produced the 1:3 Risk-to-Reward outcome.
🧠 Structured position sizing, predefined invalidation levels, and disciplined execution matter when trading Breakout Failure setups.

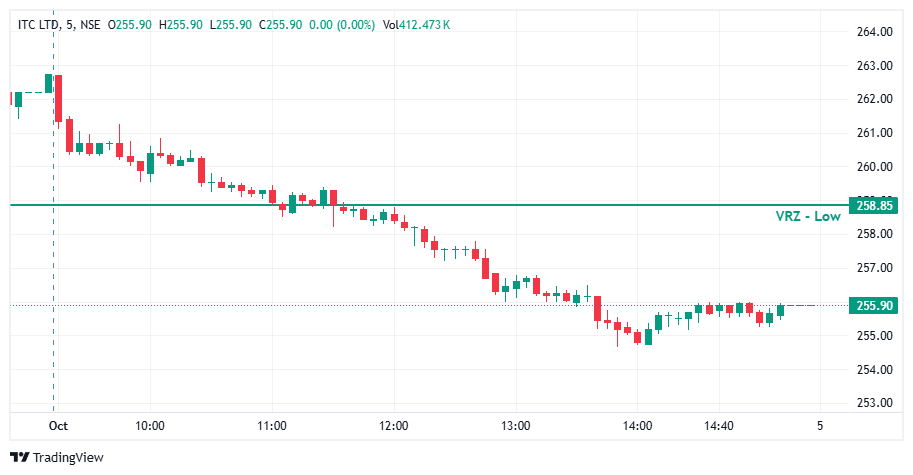

📉 ITC broke below the ₹258.85 VRZ Low during the session, creating a potential bullish BOF setup. ⚠️ However, buyers failed to generate a meaningful recovery toward the broken level. 🔻 Price continued to remain below ₹258.85 and gradually moved toward the ₹255 area, keeping the intraday structure weak.
🔎 After the breakdown, price continued forming lower levels beneath the VRZ Low. 📊 Recovery attempts remained shallow and failed to challenge ₹258.85. 🧱 The inability to reclaim the key zone kept the bearish structure intact and allowed sellers to maintain control.
🎯 A bullish BOF required a decisive reclaim of ₹258.85 followed by sustained acceptance above the level. 🚫 That confirmation never developed. 🔴 Instead, price continued declining and eventually reached around ₹255, invalidating the expected bullish reversal.
🔻 Bearish candles dominated the session after the VRZ Low breakdown. 📉 Selling pressure remained consistent through the morning and early afternoon. 🟢 Small recovery candles appeared near ₹255, but they lacked sufficient momentum to challenge the key VRZ level. ⚠️ The late consolidation remained well below ₹258.85.
🎯 The bullish BOF required confirmation above ₹258.85. 🚫 Since price never reclaimed and sustained above the level, the reversal remained unconfirmed. ⚠️ Entering before confirmation would have increased exposure to continued downside pressure. 🧭 Waiting for reclaim + acceptance + bullish follow-through would have provided stronger trade validation.
🔒 A breakdown should not automatically be treated as a bullish reversal opportunity. ⚠️ When price continues trading below the VRZ Low, the bullish thesis needs to be reassessed. 🛑 Using ₹258.85 as the key validation level helps avoid premature entries while bearish pressure remains active.
🧩 Traders may expect a reversal simply because price has moved significantly below the VRZ Low. 👀 However, ITC showed that a bounce is not enough to confirm a BOF. ⚠️ Buyers needed to reclaim and hold ₹258.85, but that evidence never appeared. 🎯 Confirmation should come from price action, not anticipation.
📍 ₹258.85 remained the critical decision level for this ITC setup. 🔻 Price broke below the VRZ Low and failed to recover it throughout the session. 📊 The continued trading below the zone and move toward ₹255 demonstrated why VRZ reclaim confirmation is essential before validating a bullish BOF.
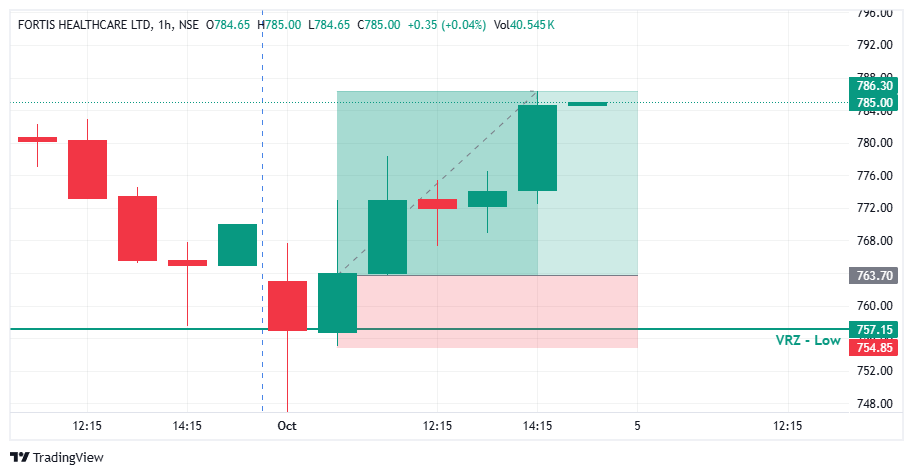

📉 FORTIS Healthcare approached the identified VRZ Low at ₹757.15 after experiencing selling pressure, creating a potential breakdown scenario.
🔻 Price briefly moved into the lower region around the VRZ Low, indicating that sellers were attempting to extend the downside move.
⚠️ However, the breakdown failed to sustain.
🔄 Buyers stepped in around the VRZ Low and pushed price back above the key support region.
📈 The reclaim of ₹757.15 shifted the short-term price structure from bearish to bullish.
🟢 Follow-through buying confirmed the Bullish Breakout Failure (BOF) setup.
🚀 As bullish momentum expanded, FORTIS continued moving higher and delivered a 2.96% upside move, achieving the planned 1:2 risk-reward outcome.
🔍 VRZ Low Support: ₹757.15 acted as the key reference level for the bullish BOF setup.
🔻 Failed Breakdown: Price tested the lower side of the VRZ Low but failed to sustain bearish momentum.
🔄 Bullish Reclaim: Buyers recovered price back above the key zone.
📊 Momentum Shift: Subsequent hourly candles showed increasing bullish participation.
🚀 Upside Continuation: Price advanced toward the ₹785–₹786 region, producing a 2.96% upside move.
🔻 Sellers initially attempted to push FORTIS below the VRZ Low.
📉 The move toward the lower levels created expectations of further downside.
⚠️ Instead, bearish momentum weakened around the support zone.
🔄 Price reversed and reclaimed the VRZ Low.
😮 Breakdown sellers were caught on the wrong side as the market moved higher.
🟢 Fresh buying participation added strength to the reversal.
🚀 This transition from bearish pressure to bullish momentum supported the successful BOF trade.
🔴 Sellers initially controlled the price action around the lower levels.
🟢 Buyers defended the VRZ Low and absorbed selling pressure.
⚖️ The failed breakdown shifted the balance toward buyers.
📈 Reclaiming the key zone encouraged additional bullish participation.
🚀 Continued buying pressure helped FORTIS extend the recovery toward higher levels.
A move below support does not automatically confirm bearish continuation. Failure to sustain the breakdown can create a bullish BOF structure.
The ₹757.15 VRZ Low provided the critical level for identifying the failed breakdown and subsequent bullish recovery.
Price recovery above the VRZ Low indicated that buyers were regaining control after the failed breakdown.
The subsequent bullish candles strengthened the reversal and supported continuation toward higher price levels.
A predefined stop-loss and target helped maintain a disciplined 1:2 risk-reward framework throughout the trade.
✅ Identify the VRZ Low before evaluating a potential bullish BOF.
✅ Monitor how price reacts after testing the support zone.
✅ Look for a clear recovery and reclaim of the VRZ Low.
✅ Analyze follow-through buying before confirming bullish momentum.
✅ Maintain predefined risk and reward levels throughout the setup.
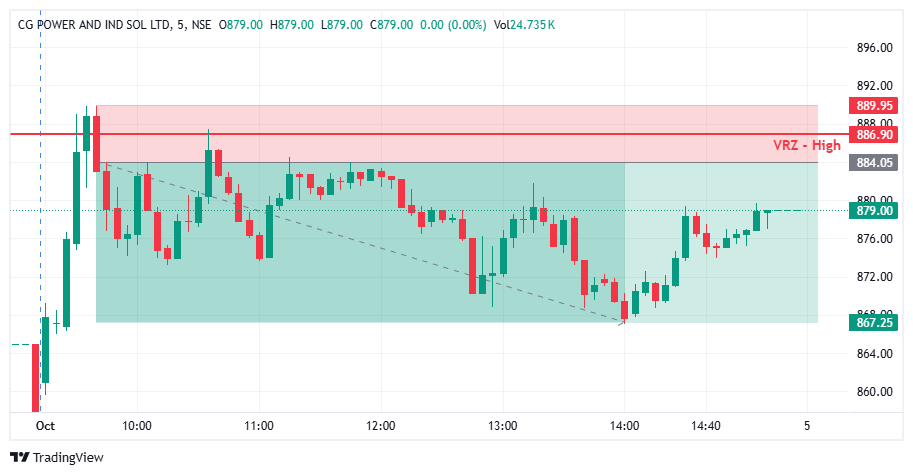

🔺 CGPOWER approached the VRZ High, where buyers attempted to push price above the resistance zone.
⚠️ The breakout failed to sustain as price rejected the higher levels around ₹886.90.
🔴 The rejection confirmed the Breakout Failure (BOF) structure and created a bearish reversal setup.
🔻 Sellers stepped in after the failed breakout and pushed CGPOWER lower from the VRZ High.
📊 The rejection from ₹886.90 highlighted increasing selling pressure.
🎯 The setup ultimately delivered a 1.90% bearish move with a 1:3 Risk-Reward.
🟢 Buyers: Attempted to sustain the breakout above the VRZ High.
🟡 Breakout Traders: Came under pressure as price failed to hold above resistance.
🔴 Sellers: Regained control and initiated the downside reversal.
🎭 The initial move toward the VRZ High created bullish expectations.
⚠️ However, the inability to sustain above resistance weakened the breakout.
📉 The rejection shifted short-term momentum toward sellers and supported the bearish reversal.
🎯 The key confirmation came when CGPOWER rejected the ₹886.90 VRZ High and moved back below the breakout area.
🔄 The failed breakout indicated weakening buying pressure.
⚡ Continued downside price action validated the bearish BOF structure.
🔸 🚫 Failed Breakouts Can Trap Buyers
When price fails to sustain above resistance, breakout positions can come under pressure.
🔹 🎯 VRZ High Rejection
The ₹886.90 zone provided an important technical reference for identifying the reversal.
🛡️ Defined Risk Supports Trade Discipline
The VRZ High offered a clear reference for managing trade risk.
⚡ 📉 Bearish Follow-Through
The rejection was followed by sustained downside momentum, strengthening the reversal structure.
📉 Following the VRZ High rejection, CGPOWER developed a weaker intraday price structure.
🔴 Sellers gained control as price moved away from the resistance zone.
🚀 The developing downside structure supported the continuation of the bearish move.
🔥 Selling pressure strengthened after the breakout failure.
📉 CGPOWER moved lower from the VRZ High and extended the bearish reversal.
🏆 The setup delivered a 1.90% downside move with 1:3 RR.
🔸 The setup became actionable after CGPOWER failed to sustain the breakout above the ₹886.90 VRZ High.
📉 Sellers reclaimed control and drove price lower from the rejection zone.
⚖️ The confirmed BOF structure provided a defined-risk intraday setup with a 1:3 Risk-Reward opportunity.
