
Select a trading day to view all Scanner results, chart evidence, and market explanations.
4 Scanners Available
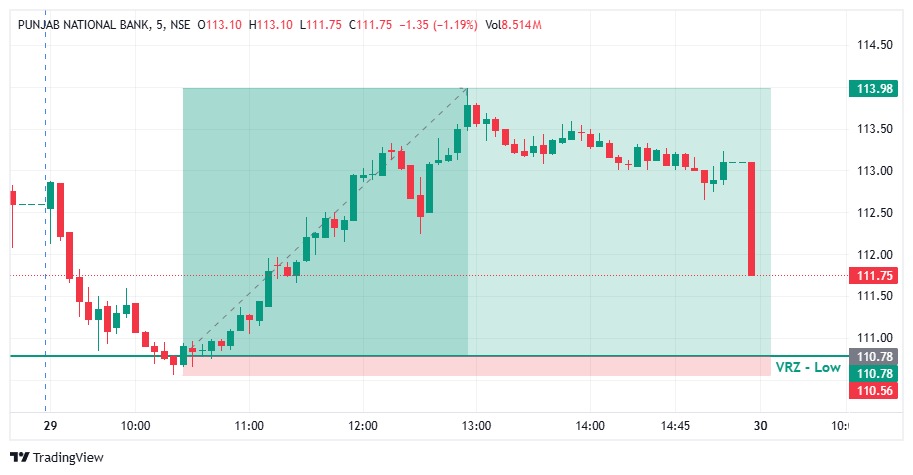

🔎 PNB faded after an early pop and slid steadily through the opening hour.
⚠️ Price kept moving toward the ₹110.78 VRZ Low, where a breakdown looked likely.
🎯 The VRZ Low became the key technical reference for spotting a potential bullish Breakout Failure.
📉 Price dipped below the ₹110.78 VRZ Low and touched the ₹110.56 area, showing a clear attempt by sellers to extend the downside.
🪤 The move below support was shallow and could not hold.
🔄 Buyers stepped in right at the lows, forming the first base for a bullish reversal.
🎯 Price closed back above the ₹110.78 VRZ Low, confirming a Bullish Breakout Failure structure.
⚡ The failed breakdown showed that sellers had lost control below support.
📈 Once the level was reclaimed, short-term momentum shifted decisively toward the buyers.
📈 After the VRZ Low rejection, PNB climbed steadily with higher lows and strong green candles.
⚡ Buyers pushed price out of the breakdown zone and into a broader bullish recovery.
💥 The rally peaked near ₹113.98, a 2.89% price expansion that confirmed the successful BOF outcome.
🔍 The chart shows an early sell-off, a brief break of the ₹110.78 VRZ Low, and a sharp recovery from the support area.
🟢 The reclaim of the zone was the key confirmation for the bullish BOF structure.
📈 Price then travelled up to the ₹113.98 area, showing how quickly momentum can turn after a trapped breakdown.
🎯 The shift from breakdown pressure to bullish expansion was the defining technical event of this setup.
🔎 The main signal was the failed breakdown below the ₹110.78 VRZ Low.
⚡ Sellers pushed price under support, but the move lacked sustained follow-through.
🟢 The reclaim of the VRZ Low signalled a change in short-term price structure.
📈 Buyers then drove the recovery to higher levels, producing the reported 2.89% move.
🟢 VRZ Low: ₹110.78 served as the primary support reference.
⚠️ Breakdown Failure: Sellers could not hold price below the support zone.
🛡️ Buyer Defense: Buyers responded strongly near the ₹110.56 low.
🔄 Bullish Reclaim: Price recovered back above the key level.
📊 Momentum Shift: Short-term momentum turned bullish after the failed breakdown.
🚀 Upside Expansion: Price advanced toward the ₹113.98 area.
🏆 Trade Outcome: 2.89% upside with 1:14 RR.
🎯 The ₹110.78 VRZ Low, with the ₹110.56 swing low just below it, gave a very tight and clearly defined risk reference for the bullish BOF setup.
⚖️ A small, defined risk against a much larger upside move produced the 1:14 Risk-to-Reward outcome.
🧠 Structured position sizing, predefined invalidation levels, and disciplined execution matter when trading Breakout Failure setups.

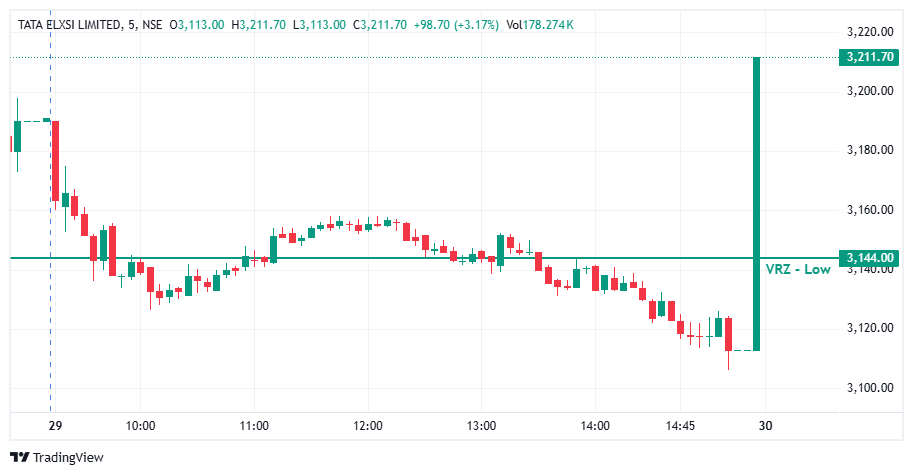

📉 TATAELXSI traded below the ₹3,144.00 VRZ Low for most of the session, creating a bearish breakdown structure. ⚠️ However, sellers failed to extend the downside move decisively. 🔎 Price gradually weakened toward the ₹3,110–₹3,120 area before a powerful late-session recovery completely changed the structure.
🔻 The initial breakdown kept price below ₹3,144 for a large portion of the session. 📊 Several recovery attempts struggled to reclaim the key level, allowing the bearish structure to remain intact temporarily. 🔄 However, the final move produced a dramatic shift as buyers reclaimed the VRZ Low with exceptional momentum.
🎯 The bearish setup required price to remain below ₹3,144.00 and continue showing downside acceptance. 🚫 Instead, buyers launched a sharp recovery from around ₹3,110. 🟢 Price reclaimed the VRZ Low and immediately expanded higher, invalidating the bearish continuation thesis.
⚡ The strongest confirmation came from the final explosive bullish candle. 🟢 Price moved from approximately ₹3,110 to ₹3,211.70, decisively clearing the ₹3,144.00 VRZ Low. 🚀 The size and speed of the move showed a major shift in short-term momentum, with buyers taking control after the prolonged weakness.
🎯 The bearish setup required sustained acceptance below ₹3,144.00. 🚫 Once buyers decisively reclaimed the VRZ Low, the bearish thesis lost validity. ⚠️ Continuing to hold a bearish view after the reclaim would expose the trade to sharp upside risk. 🧭 The reclaim + strong acceptance + bullish follow-through provided the key reversal confirmation.
🔒 This setup highlights why a breakdown should not automatically be treated as guaranteed bearish continuation. 👀 Traders need to monitor whether sellers can maintain control below the VRZ level. 🚨 Once ₹3,144 was decisively reclaimed with strong momentum, the bearish setup required immediate reassessment.
🧩 After spending most of the session below ₹3,144, traders could easily become anchored to the bearish structure. ⚠️ However, the sudden reclaim demonstrated how quickly market conditions can change. 🧠 The key lesson is to avoid becoming emotionally attached to the original direction and instead react to confirmed changes in price structure.
📍 ₹3,144.00 was the critical decision level. 🔻 The prolonged trading below the VRZ Low initially supported the bearish thesis, but 🔄 the powerful reclaim completely changed the setup. 🚀 The late-session expansion toward ₹3,211.70 demonstrates how a failed breakdown can transform into a strong bullish reversal.
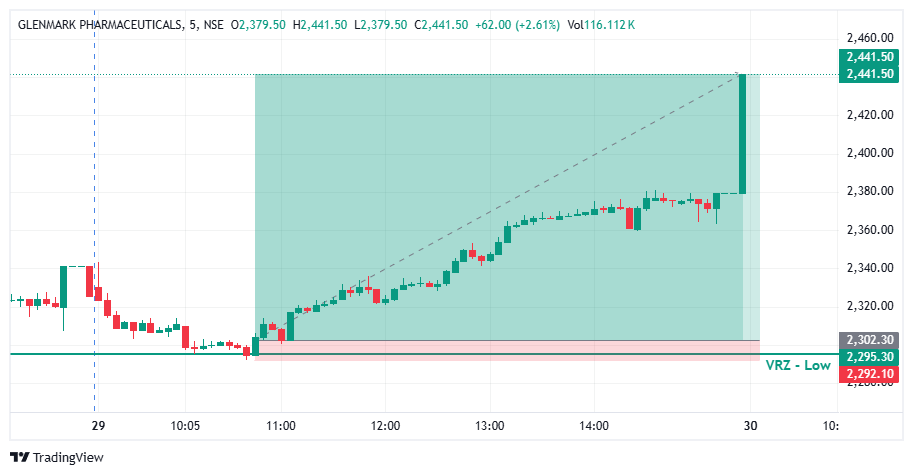

🔎 GLENMARK faded after an early spike and drifted lower through the morning session.
⚠️ Price kept sliding toward the ₹2,295.30 VRZ Low, where a breakdown looked likely.
🎯 The VRZ Low became the key technical reference for spotting a potential bullish Breakout Failure.
📉 Price dipped below the ₹2,295.30 VRZ Low and touched the ₹2,292.10 area, showing a clear attempt by sellers to extend the downside.
🪤 The move below support was small and could not hold.
🔄 Buyers stepped in right at the lows, forming the first base for a bullish reversal.
🎯 Price closed back above the ₹2,295.30 VRZ Low and moved into the ₹2,302.30 area, confirming a Bullish Breakout Failure structure.
⚡ The failed breakdown showed that sellers had lost control below support.
📈 Once the level was reclaimed, short-term momentum shifted decisively toward the buyers.
📈 After the VRZ Low rejection, GLENMARK climbed steadily with higher lows and consistent green candles.
⚡ Price held above the reclaimed zone and worked its way higher through the afternoon session.
💥 A strong late-session breakout candle pushed price to ₹2,441.50, a 6.05% price expansion that confirmed the successful BOF outcome.
🔍 The chart shows a gradual sell-off into support, a brief break of the ₹2,295.30 VRZ Low, and a long, steady recovery from the support area.
🟢 The reclaim of the zone was the key confirmation for the bullish BOF structure.
📈 Price then travelled all the way to the ₹2,441.50 area, showing how far a trapped breakdown can run.
🎯 The shift from breakdown pressure to sustained bullish expansion was the defining technical event of this setup.
🔎 The main signal was the failed breakdown below the ₹2,295.30 VRZ Low.
⚡ Sellers pushed price under support, but the move lacked sustained follow-through.
🟢 The reclaim of the VRZ Low signalled a change in short-term price structure.
📈 Buyers then drove the recovery to much higher levels, producing the reported 6.05% move.
🟢 VRZ Low: ₹2,295.30 served as the primary support reference.
⚠️ Breakdown Failure: Sellers could not hold price below the support zone.
🛡️ Buyer Defense: Buyers responded strongly near the ₹2,292.10 low.
🔄 Bullish Reclaim: Price recovered back above the key level.
📊 Momentum Shift: Short-term momentum turned bullish after the failed breakdown.
🚀 Upside Expansion: Price advanced toward the ₹2,441.50 area.
🏆 Trade Outcome: 6.05% upside with 1:13 RR.
🎯 The ₹2,295.30 VRZ Low, with the ₹2,292.10 swing low just below it, gave a very tight and clearly defined risk reference for the bullish BOF setup.
⚖️ A small, defined risk against a much larger upside move produced the 1:13 Risk-to-Reward outcome.
🧠 Structured position sizing, predefined invalidation levels, and disciplined execution matter when trading Breakout Failure setups.
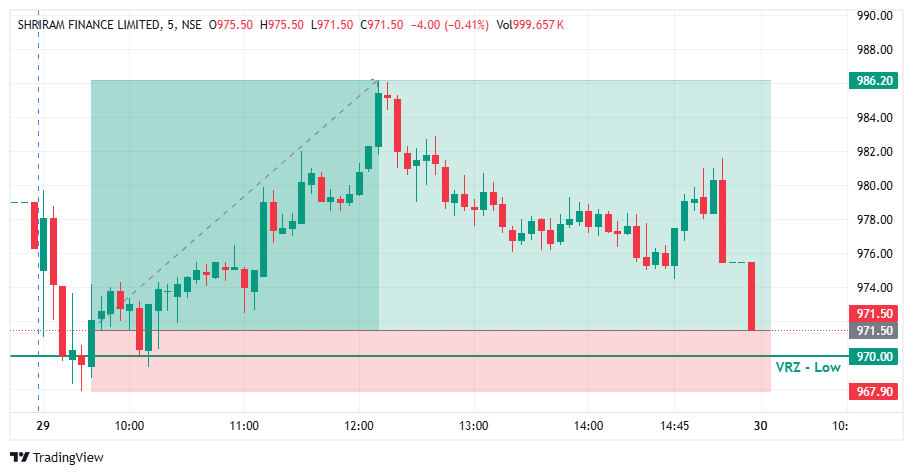

🔎 SHRIRAMFIN opened with a gap-down move and saw steady selling pressure in the opening minutes.
⚠️ Price slid toward the ₹970.00 VRZ Low, where a breakdown looked likely.
🎯 The VRZ Low became the key technical reference for spotting a potential bullish Breakout Failure.
📉 Price dipped below the ₹970.00 VRZ Low and reached the ₹967.90 area, showing a clear attempt by sellers to extend the downside.
🪤 The move below support could not hold, and follow-through selling faded quickly.
🔄 Buyers stepped in near the lows, forming the first base for a bullish reversal.
🎯 Price closed back above the ₹970.00 VRZ Low, confirming a Bullish Breakout Failure structure.
⚡ The failed breakdown showed that sellers had lost control below support.
📈 Once the level was reclaimed, short-term momentum shifted decisively toward the buyers.
📈 After the VRZ Low rejection, SHRIRAMFIN climbed steadily with higher lows and stronger green candles.
⚡ Buyers pushed price out of the breakdown zone and into a broader bullish recovery.
💥 The rally peaked near ₹986.20, a 1.51% price expansion that confirmed the successful BOF outcome.
🔍 The chart shows a sharp opening sell-off, a brief break of the ₹970.00 VRZ Low, and a strong recovery from the support area.
🟢 The reclaim of the zone was the key confirmation for the bullish BOF structure.
📈 Price then travelled up to the ₹986.20 area, showing how quickly momentum can turn after a trapped breakdown.
🎯 The shift from breakdown pressure to bullish expansion was the defining technical event of this setup.
🔎 The main signal was the failed breakdown below the ₹970.00 VRZ Low.
⚡ Sellers pushed price under support, but the move lacked sustained follow-through.
🟢 The reclaim of the VRZ Low signalled a change in short-term price structure.
📈 Buyers then drove the recovery to higher levels, producing the reported 1.51% move.
🟢 VRZ Low: ₹970.00 served as the primary support reference.
⚠️ Breakdown Failure: Sellers could not hold price below the support zone.
🛡️ Buyer Defense: Buyers responded strongly near the ₹967.90 low.
🔄 Bullish Reclaim: Price recovered back above the key level.
📊 Momentum Shift: Short-term momentum turned bullish after the failed breakdown.
🚀 Upside Expansion: Price advanced toward the ₹986.20 area.
🏆 Trade Outcome: 1.51% upside with 1:4 RR.
🎯 The ₹970.00 VRZ Low, with the ₹967.90 swing low nearby, gave a tight and clearly defined risk reference for the bullish BOF setup.
⚖️ A small, defined risk against a larger upside move produced the 1:4 Risk-to-Reward outcome.
🧠 Structured position sizing, predefined invalidation levels, and disciplined execution matter when trading Breakout Failure setups.

📈 Track sector-wise BOF signals and monitor market activity at a glance.
🔍 Select any sector to discover triggered VRZ High & VRZ Low stocks.
⚡ Spot active BOF zones and quickly identify potential trading opportunities.