
Select a trading day to view all Scanner results, chart evidence, and market explanations.
6 Scanners Available
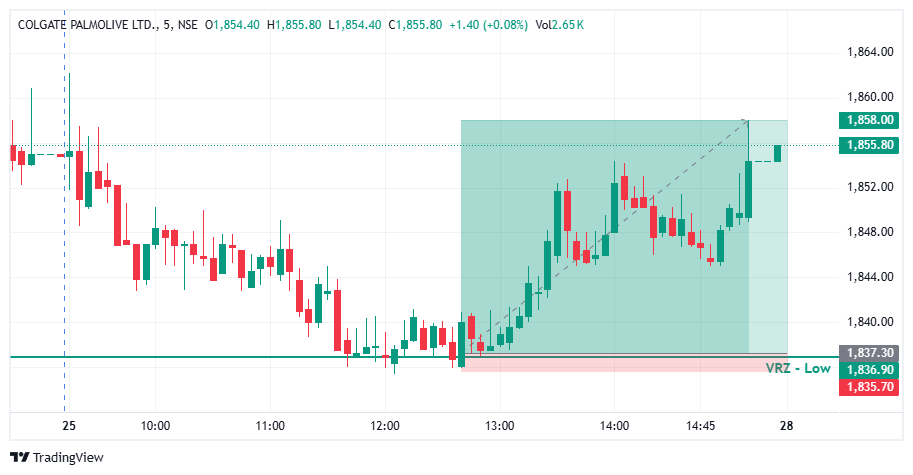

📊 COLPAL drifted lower through the morning session and pushed directly into the important ₹1,836.90 VRZ Low support zone.
⚠️ Price action near this level showed an attempt to break down and extend the decline further.
🎯 The VRZ Low became a critical technical reference for spotting a potential bullish reversal.
🚨 Price pierced the ₹1,836.90 VRZ Low, briefly dropping into the marked support area near ₹1,835.70.
🪤 However, sellers failed to secure acceptance below the zone, signalling exhausted bearish momentum.
🔺 Fresh buying interest surfaced at the lows, creating the first signs of a failed breakdown.
🎯 The sharp rejection from the VRZ Low matured into a clean Bullish Breakdown Failure (BOF) structure.
⚡ As price reclaimed the support zone, buyers began taking back control of the short-term market structure.
📈 The failed breakdown marked a clear handover of momentum from sellers to buyers.
🔺 Following the VRZ Low reclaim, COLPAL held a steady higher-low sequence across the afternoon.
📊 Progressive higher levels formed as bullish momentum expanded step by step on the 5-minute chart.
💥 The advance eventually stretched to the ₹1,858.00 price area, confirming the successful bullish BOF setup.
📈 The reversal produced an impressive 1.13% upside move from the VRZ Low rejection area.
⚡ The sharp price expansion highlighted the strength of the failed breakdown and subsequent bullish momentum.
🏆 With disciplined risk management, the trade achieved an exceptional 1:13 Risk-to-Reward ratio.
🔎 The decisive technical development here was the inability of sellers to hold price below the ₹1,836.90 VRZ Low.
⚡ The rejection showed bearish momentum fading at support, opening the door for buyers to step in.
📈 Once price recovered above the VRZ Low, demand strengthened and an orderly uptrend developed.
🔄 This mix of support rejection, failed breakdown and sustained buying formed a textbook bullish BOF structure.
📍 VRZ Low: ₹1,836.90 acted as the key support reference.
🔻 Breakdown Test: Sellers pressed below the zone but could not sustain the move.
🚨 Rejection: Strong buying interest appeared right at the VRZ Low.
🔄 BOF Confirmation: Price reclaimed the support area, confirming the failure.
🐂 Momentum Shift: Buyers assumed control as bullish momentum built.
🎯 Upside Target: Price advanced toward the ₹1,858.00 area.
🏆 Trade Result: 1.13% upside with 1:13 RR.
🎯 A clearly defined VRZ Low gave the bullish BOF setup a structured technical reference point.
⚖️ The exceptional 1:13 Risk-to-Reward outcome demonstrates the importance of identifying setups where potential reward substantially exceeds defined risk.
🧠 Proper position sizing, predefined stop levels and disciplined execution remain essential for consistency.

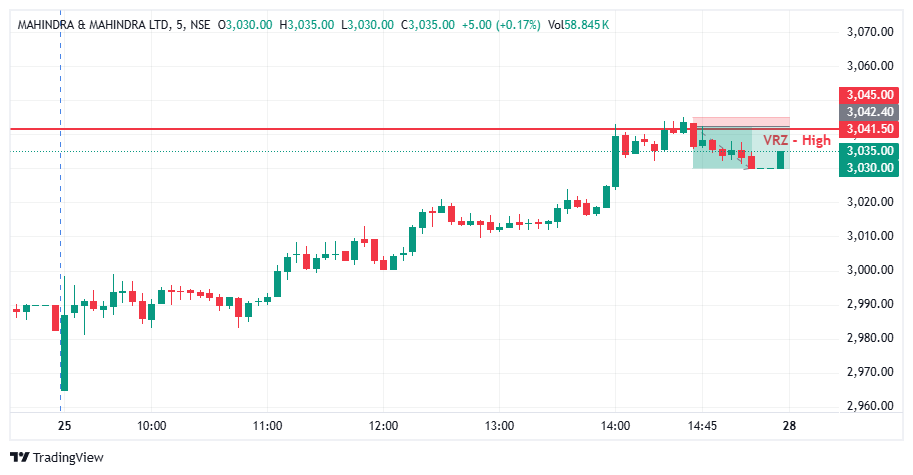

📊 M&M traded with strong bullish momentum through the session before approaching the important ₹3,041.50 VRZ High resistance zone.
⚠️ Price action near this level showed an attempt to sustain higher prices and continue the upward move.
🎯 The VRZ High became a critical technical reference for identifying a potential bearish reversal.
🚨 Price tested the ₹3,041.50 VRZ High, briefly pushing toward ₹3,045.
🪤 However, buyers failed to maintain acceptance above the marked zone, indicating weakening bullish momentum.
🔻 Selling pressure emerged near the resistance, creating the initial signs of a failed breakout.
🎯 The rejection from the VRZ High developed into a clear Bearish Breakout Failure (BOF) structure.
⚡ As price moved back below the resistance zone, sellers began regaining control of the short-term market structure.
📉 The failed breakout signaled a shift in momentum from buyers to sellers.
🔻 Following the VRZ High rejection, M&M eased lower through the closing candles of the session.
📊 Price slipped back toward the ₹3,030–3,035 zone as bearish pressure gradually expanded.
💥 The move confirmed the successful, if measured, bearish BOF setup.
📉 The reversal generated a 0.41% downside move from the VRZ High rejection area.
⚡ The tight, controlled expansion highlighted precision entry near resistance rather than a large trend move.
🏆 With disciplined risk management, the trade achieved an impressive 1:5 Risk-to-Reward ratio.
🔎 The key technical development in this setup was the inability of buyers to sustain price above the ₹3,041.50 VRZ High.
⚡ The rejection indicated that bullish momentum weakened near resistance, allowing sellers to take control.
📉 Once price moved back below the VRZ High, bearish pressure took hold, even if the follow-through stayed shallow.
🔄 This combination of resistance rejection, failed breakout, and controlled selling formed a clean bearish BOF structure.
📍 VRZ High: ₹3,041.50 served as the key resistance reference.
🔺 Breakout Test: Buyers pushed toward the zone but failed to sustain the breakout.
🚨 Rejection: Selling pressure appeared right around the VRZ High.
🔄 BOF Confirmation: Price slipped back below the resistance area, confirming the failure.
🐻 Momentum Shift: Sellers took control as bearish pressure built.
🎯 Downside Target: Price eased toward the ₹3,030 area.
🏆 Trade Result: 0.41% downside with 1:5 RR.
🎯 A clearly defined VRZ High gave the bearish BOF setup a tight, structured technical reference.
⚖️ The 1:5 Risk-to-Reward outcome shows how a small, well-placed stop can deliver an efficient reward.
🧠 Proper position sizing, predefined risk levels, and disciplined execution remain essential for consistent trading.
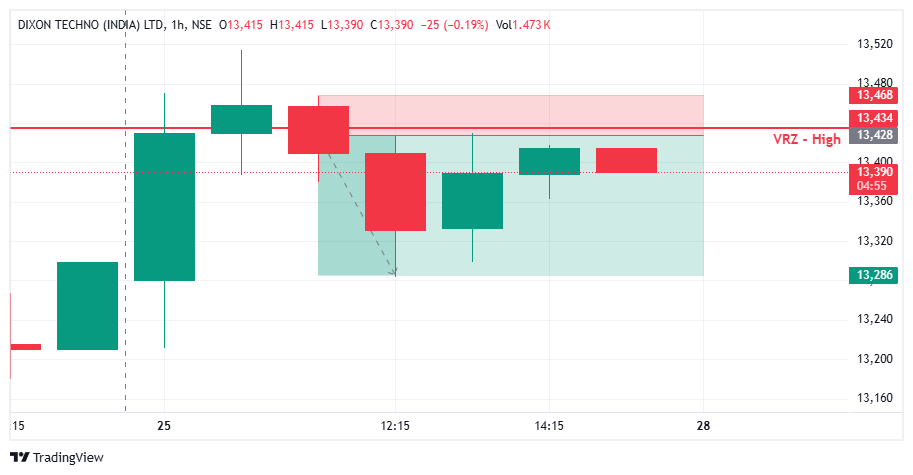

📈 Dixon Technologies approached the identified VRZ High around ₹13,428, creating a key resistance reference for the trading setup.
🚀 Buyers pushed price toward and above the resistance zone, indicating an attempt to establish a bullish breakout.
🟢 The initial upward movement suggested that buyers were testing higher price levels.
⚠️ However, the breakout failed to maintain sustained acceptance above the VRZ High.
🔻 Selling pressure emerged as price moved back toward the resistance area, signaling that the bullish breakout attempt was losing strength.
📊 This shift in price behavior established the conditions for a potential Bearish Breakout Failure (BOF) setup.
🔻 After testing the VRZ High, price failed to sustain its upward breakout.
📉 A bearish candle followed the breakout attempt, reflecting selling pressure near the resistance zone.
🔄 Price moved back below the VRZ High, indicating that buyers were unable to maintain control above resistance.
🎯 The rejection provided bearish BOF confirmation and established a potential downside trading opportunity.
💥 Following the failed breakout, DIXON delivered a 1.06% downside move, achieving the planned 1:3 risk-reward outcome.
🏆 The setup demonstrates how a failed breakout can transition into a bearish price movement when resistance holds.
🔍 VRZ High Resistance: ₹13,428 served as the key reference level for identifying the breakout failure.
📈 Breakout Attempt: Buyers pushed price into the resistance region, attempting to extend the bullish move.
🔻 Rejection: Price failed to sustain the breakout and returned toward the VRZ High.
📊 Bearish Confirmation: The move back below the resistance area strengthened the bearish BOF setup.
🎯 Trade Outcome: The subsequent price decline resulted in a 1.06% downside move and 1:3 RR achievement.
Many traders may have expected:
🚀 The breakout above resistance to continue.
📈 Buyers to push DIXON toward higher price levels.
🟢 The resistance break to develop into a sustained bullish move.
However, price action changed the scenario.
⚠️ The breakout failed to sustain above the VRZ High.
😮 Breakout buyers faced a reversal in price momentum.
🔻 Sellers regained influence around the resistance zone.
📉 The move back below the key level supported bearish continuation.
💭 This transition from bullish breakout expectations to selling pressure contributed to the successful downside trade.
🟢 Buyers initially attempted to sustain the breakout above the VRZ High.
🔴 Sellers responded around the resistance region and challenged the upward move.
⚖️ The inability to maintain acceptance above resistance shifted the balance toward sellers.
📉 Breakout buyers may have exited positions as price moved lower.
🐻 Fresh selling participation supported the bearish price movement.
🎯 The failed breakout created a structured opportunity to monitor downside continuation.
Price moving above resistance does not always confirm a valid breakout. Sustained acceptance around the VRZ High helps assess breakout strength.
Failure to hold above a key resistance zone can increase selling pressure and support a bearish BOF setup.
When a breakout reverses, buyers who entered above resistance may face pressure, adding momentum to the downside move.
Predefined entry, stop-loss, and target levels help maintain a disciplined approach while managing BOF trade risk.
🔸 Identify the VRZ High before assessing a potential breakout failure.
📌 Observe whether price can sustain acceptance above the resistance zone.
⚠️ Track bearish rejection and the move back below the key VRZ level.
🛡️ Consider a predefined stop-loss above the failed breakout area.
📐 Maintain a clear risk-reward structure throughout the trade.

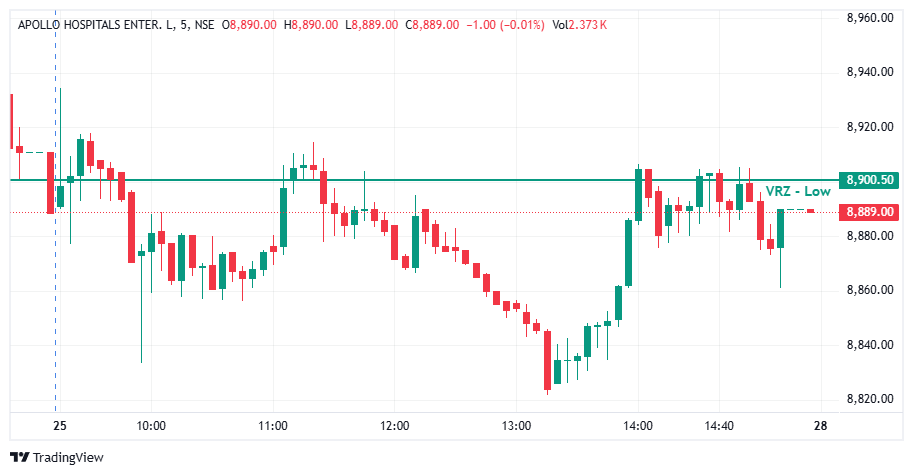

📉 APOLLOHOSP spent most of the session trading below the ₹8,900.50 VRZ Low, keeping the bullish BOF setup under pressure. ⚠️ During the afternoon, buyers staged a strong recovery and pushed price back toward the key reversal zone. 🔎 However, the late reclaim failed to produce sustained acceptance above ₹8,900.50.
📊 The first half of the session remained weak, with price declining toward the ₹8,820–₹8,840 area. 🔄 A sharp recovery later in the session brought price back above the VRZ Low. 🚨 However, after reaching around ₹8,900–₹8,910, price struggled to maintain the breakout and began consolidating around the key level.
🎯 The bullish BOF required price to reclaim ₹8,900.50 and sustain above it. 🟢 Buyers successfully pushed through the level during the afternoon recovery, but 🚫 the reclaim lacked consistent follow-through. 🔴 Multiple candles around the zone showed hesitation, and the final weakness brought price back below the VRZ Low.
⚡ The afternoon recovery produced strong bullish candles and briefly improved momentum. 🟢 Price moved from the lower ₹8,830–₹8,850 region toward the ₹8,900.50 VRZ Low. ⚠️ However, the momentum slowed once price reached the reversal zone. 🔻 Repeated red candles near the top and the closing move toward ₹8,889.00 showed that buyers could not maintain complete control above the key level.
🎯 The bullish BOF required a sustained hold above ₹8,900.50 after the reclaim. 🟢 Although the level was briefly recovered, 🚫 the move lacked strong continuation and eventually slipped back below the VRZ Low. ⚠️ Waiting for sustained acceptance and bullish follow-through would have provided stronger confirmation before treating the reversal as valid.
🔒 A late-session reclaim should not automatically be treated as a confirmed reversal. ⚠️ When price struggles to hold above the VRZ Low after a breakout, the bullish thesis needs to be reassessed. 🛑 Monitoring the reclaimed level as an immediate risk reference helps avoid holding a reversal setup after the acceptance fails.
🧩 The sharp afternoon recovery could create confidence that the bullish BOF was confirmed. 👀 However, traders still needed to watch whether buyers could sustain price above ₹8,900.50. ⚠️ The repeated hesitation around the level showed that the reclaim was not yet fully validated. 🎯 Reclaim + sustained acceptance + follow-through remains more reliable than reacting to the first breakout.
📍 ₹8,900.50 acted as the main decision zone throughout the setup. 🔄 APOLLOHOSP eventually recovered back to the VRZ Low, but the late breakout failed to hold convincingly. 📊 The move demonstrates how a strong recovery can still turn into a BOF failure when price cannot sustain acceptance above the key reversal level.
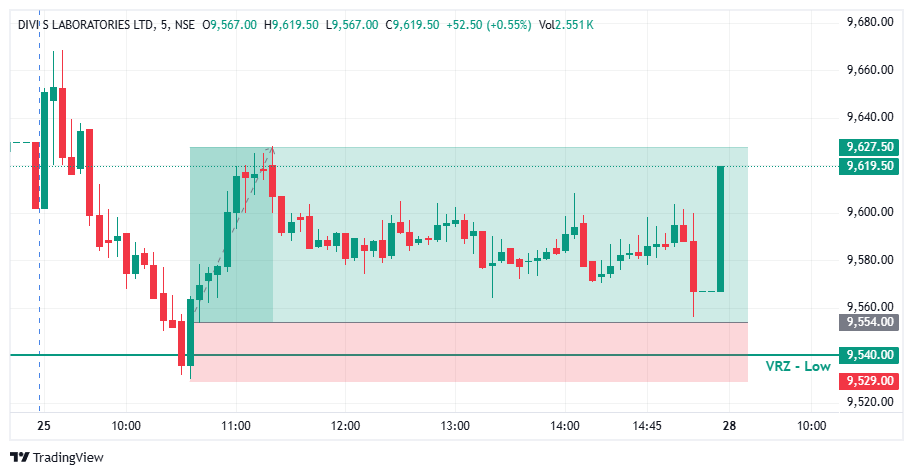

📊 DIVISLAB experienced initial selling pressure before moving toward the important ₹9,540.00 VRZ Low support reference.
⚠️ The bearish price movement brought the stock into a key support area, where a potential breakdown failure could develop.
🎯 The VRZ Low became an important technical level for monitoring a possible bullish reversal and price recovery.
🔻 Price moved toward and below the ₹9,540.00 VRZ Low, showing an attempt by sellers to extend the downside movement.
🪤 However, the breakdown failed to sustain, and selling pressure weakened near the support region.
🔄 Buyers stepped in around the lower zone, creating the foundation for a potential Bullish Breakout Failure setup.
🎯 The recovery above the VRZ Low developed into a Bullish Breakout Failure (BOF) structure.
⚡ As price reclaimed the key support reference, short-term momentum began shifting toward buyers.
📈 The failed breakdown indicated that sellers could not maintain sustained control below the VRZ Low.
📈 Following the VRZ Low rejection, DIVISLAB recovered from the lower price area and moved toward higher levels.
⚡ The bullish price action developed into an upward expansion, with buyers pushing the stock away from the support zone.
💥 The move extended toward the ₹9,627.50 area, producing the reported 0.77% price move.
🔎 The setup featured a downside test near the VRZ Low, followed by a recovery and upward price expansion.
🟢 The reclaim of the support reference became an important part of the bullish BOF structure.
📈 The transition from selling pressure to bullish recovery highlighted a potential short-term momentum shift.
🎯 The ₹9,540.00 VRZ Low remained the central technical reference for the setup.
🔎 The key technical development in this setup was the failed breakdown around the ₹9,540.00 VRZ Low.
⚡ Sellers attempted to extend the downside move, but the price recovered from the support region.
📈 The reclaim of the VRZ Low supported the bullish BOF structure and was followed by an upward price expansion.
🔄 The combination of support rejection, failed breakdown, and bullish price action formed the basis of this successful BOF setup.
🟢 VRZ Low: ₹9,540.00 served as the key support reference.
⚠️ Breakdown Failure: Sellers failed to sustain pressure below the lower zone.
🛡️ Buyer Defense: Buyers supported the price near the VRZ Low.
🔄 Bullish Reclaim: Price recovered above the marked support reference.
📊 Momentum Shift: Bullish price action developed after the failed breakdown.
🚀 Upside Expansion: Price moved toward the ₹9,627.50 area.
🏆 Trade Outcome: 0.77% move with 1:3 RR.
🎯 The VRZ Low provided an important technical reference for evaluating the bullish BOF setup.
⚖️ The 1:3 Risk-to-Reward outcome reflects the reported relationship between potential reward and defined trade risk.
🧠 Proper position sizing, predefined invalidation levels, and disciplined execution remain essential when trading Breakout Failure setups.
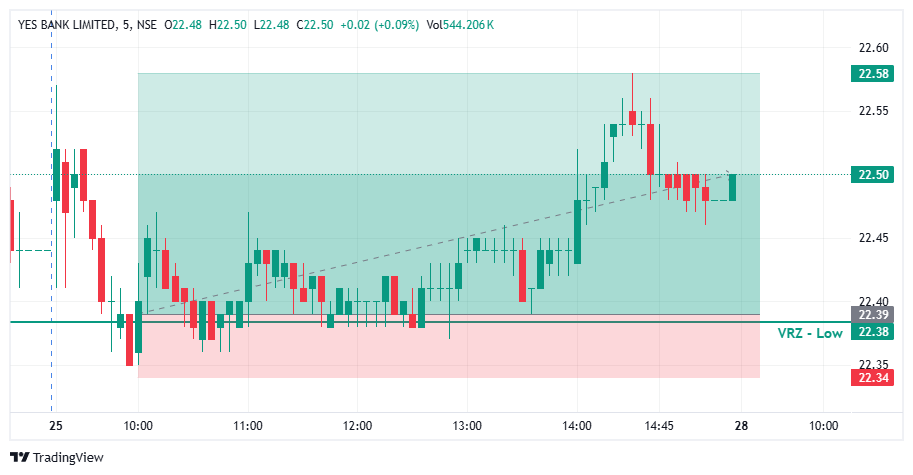

🔻 YESBANK tested the VRZ Low, where sellers attempted to push price below the support zone.
🚨 The breakdown failed to sustain as price reclaimed the ₹22.38 VRZ Low.
🟢 This recovery confirmed the Breakdown Failure (BOF) structure and created a potential bullish reversal setup.
🟢 Buyers stepped in after the failed breakdown and gradually pushed YESBANK higher.
📊 Price action above the VRZ Low showed improving buying participation.
🚀 The setup delivered a 0.85% bullish move with a 1:4 Risk-Reward.
🔴 Sellers: Attempted to extend the breakdown below the VRZ Low.
🟡 Breakdown Traders: Came under pressure as price reclaimed the support zone.
🟢 Buyers: Regained control and developed the bullish reversal.
🎭 The initial move toward the VRZ Low created bearish expectations.
⚠️ Failure to sustain below support weakened the downside momentum.
📈 The reclaim of the VRZ Low shifted price action toward a bullish structure.
🎯 The key confirmation came when YESBANK reclaimed and sustained above ₹22.38.
🔄 The failed breakdown indicated weakening selling pressure.
⚡ Continued upside price action provided confirmation of the bullish BOF structure.
🔸 🚫 Failed Breakdowns Can Trap Sellers
A quick recovery above support can put breakdown positions under pressure.
🔹 🎯 VRZ Low Reclaim
The ₹22.38 zone acted as an important technical reference for the reversal.
🛡️ Defined Risk Supports Trade Discipline
The VRZ Low provided a clear level for managing trade risk.
⚡ 📈 Bullish Follow-Through
Sustained buying after the rejection supported the developing upside momentum.
📈 Following the VRZ Low rejection, YESBANK developed a stronger intraday price structure.
🟢 Buyers maintained control as price moved progressively higher.
🚀 The improving structure supported the continuation of bullish momentum.
🔥 Buying pressure strengthened following the breakdown failure.
📈 YESBANK extended the move higher from the VRZ Low.
🏆 The setup ultimately delivered a 0.85% upside move with 1:4 RR.
🔸 The setup became actionable after YESBANK failed to sustain below the ₹22.38 VRZ Low.
📈 Buyers reclaimed the support zone and established bullish control.
⚖️ The confirmed BOF structure provided a defined-risk intraday setup with a 1:4 Risk-Reward opportunity.