
Select a trading day to view all Scanner results, chart evidence, and market explanations.
4 Scanners Available
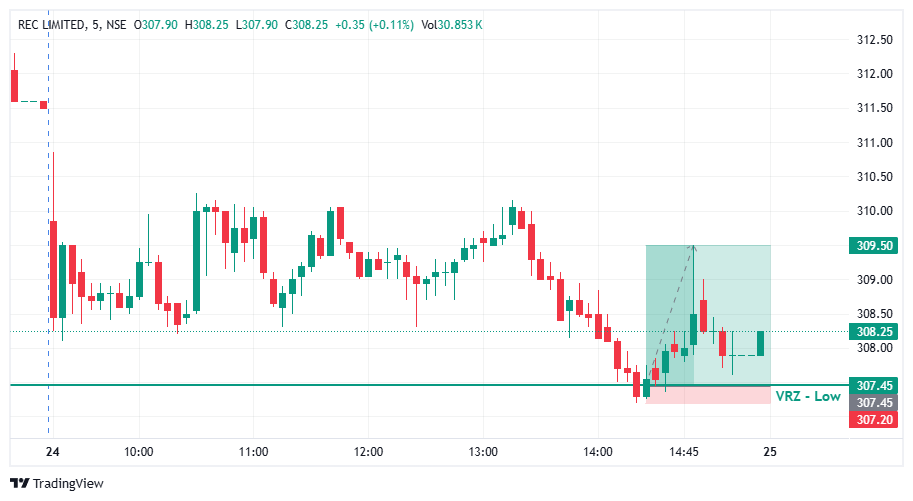

🔻 RECLTD moved toward the VRZ Low, where sellers attempted to extend the downside below the support zone.
🚨 The breakdown failed to sustain as price rejected the lower levels around ₹307.45.
🟢 This recovery confirmed the Breakdown Failure (BOF) structure and created a bullish intraday setup.
🟢 Buyers stepped in after the failed breakdown and pushed RECLTD back above the VRZ Low.
📊 The recovery from ₹307.45 showed improving buying participation.
🚀 The setup ultimately delivered a 0.67% bullish move with a strong 1:8 Risk-Reward.
🔴 Sellers: Attempted to sustain the breakdown below the VRZ Low.
🟡 Breakdown Traders: Came under pressure as price failed to hold below support.
🟢 Buyers: Regained control and initiated the bullish reversal.
🎭 The initial move toward the VRZ Low created bearish expectations.
⚠️ However, sellers failed to sustain price below the support zone.
📈 The rejection shifted momentum toward buyers and supported the bullish reversal.
🎯 The key confirmation came when RECLTD rejected the lower levels around the ₹307.45 VRZ Low.
🔄 The failed breakdown indicated weakening bearish momentum.
⚡ Continued upside movement provided follow-through for the bullish BOF setup.
🔻 🚨 Breakdown Failure Creates a Trap
When price moves below support but fails to sustain the breakdown, sellers can become trapped as price recovers.
🎯 🔄 VRZ Low Rejection Signals Recovery
The rejection around the VRZ Low indicated a shift toward renewed buying interest.
🛡️ 📍 Clear Risk Reference
The VRZ Low offered a defined technical level for structured risk management.
🚀 📈 Bullish Follow-Through Confirms Momentum
Sustained upside movement after the rejection strengthened the bullish BOF structure.
📈 Following the failed breakdown, RECLTD began developing a stronger intraday bullish structure.
🟢 Buyers maintained control as price moved away from the VRZ Low.
🚀 The improving price structure supported the continuation of bullish momentum.
🔥 Buying pressure strengthened following the breakdown failure.
📈 RECLTD moved higher from the VRZ Low and extended the bullish reversal.
🏆 The trade ultimately delivered a 0.67% upside move with a 1:8 RR.
🔸 The setup became actionable after RECLTD failed to sustain below the ₹307.45 VRZ Low.
📈 Buyers regained control and pushed the price higher.
⚖️ The confirmed BOF structure provided a defined-risk intraday setup with a 1:8 Risk-Reward opportunity.

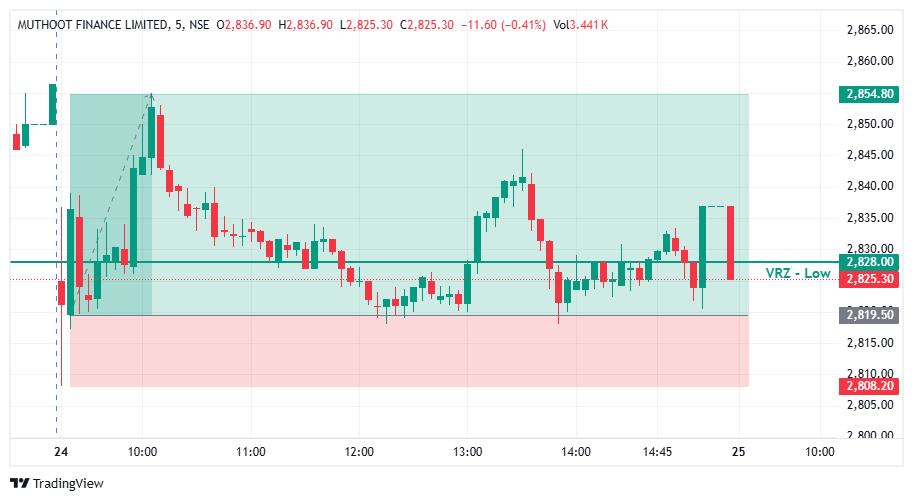

📊 MUTHOOTFIN experienced intraday price fluctuations before moving toward the important ₹2,828.00 VRZ Low.
⚠️ The price action around the support reference showed repeated interactions with the lower zone, creating the possibility of a breakdown and reversal.
🎯 The VRZ Low became a key technical level for monitoring a potential bullish Breakout Failure setup.
🔻 Price moved around the ₹2,828.00 VRZ Low, testing the support area during the trading session.
🪤 Sellers attempted to push price lower, but the bearish movement failed to develop into sustained downside continuation.
🔄 Buyers began supporting the price near the lower zone, creating the foundation for a potential bullish reversal.
🎯 The recovery and reclaim of the VRZ Low developed into a Bullish Breakout Failure (BOF) structure.
⚡ As price moved back above the key support reference, bullish momentum started strengthening.
📈 The failed breakdown indicated that sellers were unable to maintain control below the VRZ Low, supporting the subsequent upside movement.
📈 Following the VRZ Low rejection, MUTHOOTFIN developed a stronger bullish price structure.
⚡ Buyers pushed price higher from the support region, creating an upward expansion during the session.
💥 The bullish movement eventually delivered a 1.25% upside move, confirming the successful BOF trade outcome.
🔎 The chart shows multiple intraday tests around the VRZ Low, followed by price movement toward higher levels.
🟢 The support reclaim became an important technical development in the bullish setup.
📈 The shift from breakdown pressure to bullish recovery demonstrated how a failed move below support can lead to a momentum reversal.
🎯 The ₹2,828.00 VRZ Low remained the central reference for evaluating the setup.
🔎 The key technical development in this setup was the failed breakdown around the ₹2,828.00 VRZ Low.
⚡ Sellers were unable to sustain downside pressure below the support reference, while buyers regained control of the short-term price action.
📈 The reclaim of the VRZ Low supported the bullish BOF structure and contributed to the subsequent upside movement.
🔄 The combination of support rejection, failed breakdown, and bullish momentum created the successful Breakout Failure opportunity.
🟢 VRZ Low: ₹2,828.00 served as the key support reference.
⚠️ Breakdown Failure: Sellers failed to sustain pressure below the lower zone.
🛡️ Buyer Defense: Buyers stepped in near the VRZ Low support.
🔄 Bullish Reclaim: Price recovered above the marked support level.
📊 Momentum Reversal: Buyers gained short-term control following the failed breakdown.
🚀 Upside Expansion: Bullish momentum strengthened after the VRZ Low reclaim.
🏆 Trade Performance: 1.25% upside with 1:3 RR achieved.
🎯 A defined VRZ Low provided an important technical reference for evaluating the bullish BOF setup.
⚖️ The 1:3 Risk-to-Reward outcome highlights the relationship between planned risk and potential reward in the trade.
🧠 Proper position sizing, predefined invalidation levels, and disciplined execution remain essential when trading Breakout Failure setups.

📡 Scan BOF activity across sectors with real-time market signals.
🔍 Drill into each sector to find triggered VRZ High & VRZ Low instruments.
⚡ Track emerging setups and monitor where BOF activity is building.
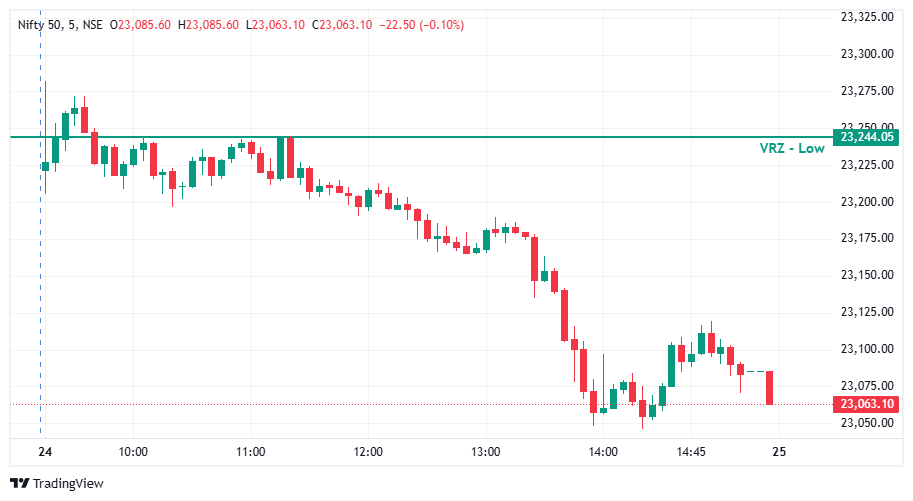

📉 NIFTY 50 moved below the 23,244.05 VRZ Low during the early session, creating the conditions for a potential bullish BOF reversal. ⚠️ However, buyers failed to generate a decisive recovery back above the key level. 🔻 Price remained below the VRZ Low and gradually developed a weaker intraday structure.
🔎 After the initial breakdown, NIFTY repeatedly attempted to recover but remained below 23,244.05. 📊 Each recovery phase failed to produce sustained acceptance above the VRZ Low. 🔻 The formation of lower highs and progressively lower levels indicated that sellers were maintaining control.
🎯 A valid bullish BOF required NIFTY to reclaim 23,244.05 and hold above it. 🚫 That confirmation never materialized. 🔴 Instead, price continued to face selling pressure below the zone and gradually extended the downside move. ❌ Without a sustained reclaim, the bullish reversal thesis remained invalid.
📉 The 5-minute candles showed persistent bearish pressure as the session progressed. 🟢 Short recovery attempts appeared around the lower levels, but buyers could not generate enough momentum to challenge the VRZ Low. ⚡ Selling intensified around the afternoon session, with NIFTY falling toward the 23,050–23,075 area before closing near 23,063.10.
🎯 The bullish BOF required a confirmed reclaim above 23,244.05. 🚫 Since NIFTY failed to regain and sustain the level, the setup remained unconfirmed. ⚠️ A premature bullish entry would have faced continued downside pressure. 🧭 Waiting for reclaim + acceptance + bullish follow-through would have provided stronger trade validation.
🔒 When the VRZ Low continues to reject price, the bullish thesis should be reassessed rather than assumed. ⚠️ Avoiding an entry before confirmation can reduce exposure to a failed reversal. 🛑 The key focus should remain on the invalidation level and actual price acceptance around the VRZ.
🧩 A breakdown below the VRZ Low does not automatically mean a bullish reversal will follow. 👀 Traders need to observe whether buyers can actually reclaim the broken level. ⚠️ Repeated failed recoveries indicate that bullish conviction is not developing. 🎯 Reclaim + acceptance + follow-through should confirm the reversal instead of anticipating it.
📍 23,244.05 remained the critical decision level throughout the setup. 🔻 NIFTY failed to reclaim this VRZ Low, while the broader intraday structure continued to weaken. 📊 The price action demonstrates the importance of confirmation when trading a bullish BOF after a breakdown.
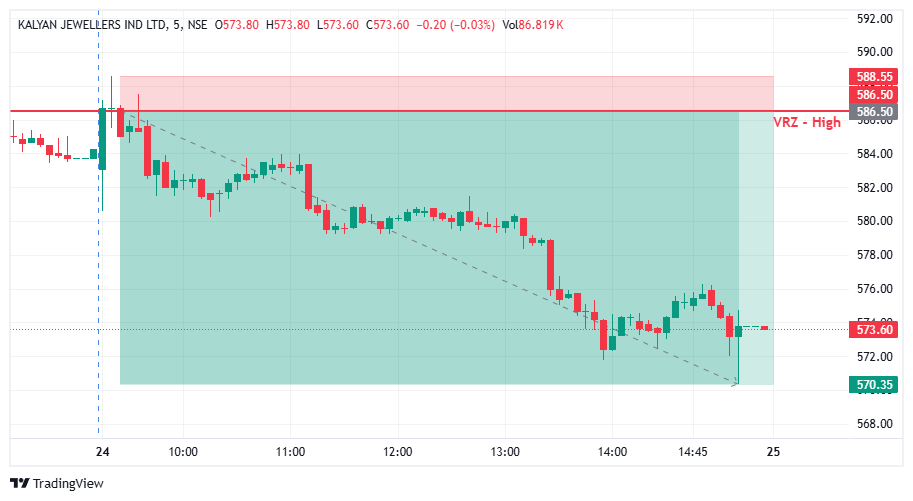

📊 KALYANKJIL opened with an upward movement and tested the important ₹586.50 VRZ High resistance zone.
⚠️ The initial price action showed an attempt by buyers to sustain higher levels near the marked resistance.
🎯 The VRZ High became a key technical reference for identifying a potential bearish breakout failure and reversal.
🚨 Price tested the ₹586.50 VRZ High, but buyers failed to sustain the upward movement above the resistance area.
🪤 The inability to maintain higher prices indicated weakening bullish momentum near the marked zone.
🔻 Selling pressure emerged as price moved away from the VRZ High, creating the foundation for a bearish BOF setup.
🎯 The rejection from the VRZ High developed into a Bearish Breakout Failure (BOF) structure.
⚡ As price moved lower from the resistance zone, sellers began gaining control of the short-term market structure.
📉 The failed breakout created a shift in momentum, supporting the development of a sustained downside move.
🔻 Following the VRZ High rejection, KALYANKJIL continued to move lower through the trading session.
📊 The price action formed a broader bearish structure, with selling pressure extending across multiple intraday candles.
💥 The downside movement eventually reached the ₹570.35 area, reflecting a significant price expansion from the resistance zone.
📉 The successful BOF setup generated a 2.75% downside move following the VRZ High rejection.
⚡ The sustained bearish momentum demonstrated the potential impact of a failed breakout near an important resistance level.
🏆 With disciplined risk management, the trade achieved an impressive 1:8 Risk-to-Reward ratio.
🔎 The key technical development in this setup was the failure to sustain higher prices near the ₹586.50 VRZ High.
⚡ Buyers attempted to maintain upward momentum, but the price action subsequently moved away from the resistance zone.
📉 The bearish movement strengthened as sellers gained short-term control, driving price toward lower levels.
🔄 The combination of resistance rejection, failed breakout, and sustained selling pressure formed the basis of this successful BOF setup.
🔹 VRZ High: ₹586.50 acted as the primary resistance reference.
🔹 Breakout Attempt: Buyers tested the resistance zone but failed to sustain higher levels.
🔹 Rejection: Selling pressure developed around the VRZ High.
🔹 Bearish Confirmation: Price moved away from the resistance area.
🔹 Momentum Shift: Sellers gained short-term control of the price structure.
🔹 Downside Price Area: ₹570.35.
🔹 Trade Outcome: 2.75% downside with 1:8 RR.
🎯 The VRZ High provided a defined technical reference for evaluating the bearish BOF setup.
⚖️ The 1:8 Risk-to-Reward outcome highlights the relationship between planned risk and potential reward in this trade.
🧠 Position sizing, predefined invalidation levels, and disciplined execution remain important when trading Breakout Failure setups.
🔥 KALYANKJIL experienced a failed breakout near the ₹586.50 VRZ High, followed by a strong bearish reversal.
📉 The setup delivered a 2.75% downside move with 1:8 RR, highlighting the potential of VRZ-based Breakout Failure analysis for identifying intraday momentum shifts.
🏆 Failed Breakout + VRZ High Rejection + Bearish Momentum = Successful KALYANKJIL BOF Trade.