
Select a trading day to view all Scanner results, chart evidence, and market explanations.
3 Scanners Available
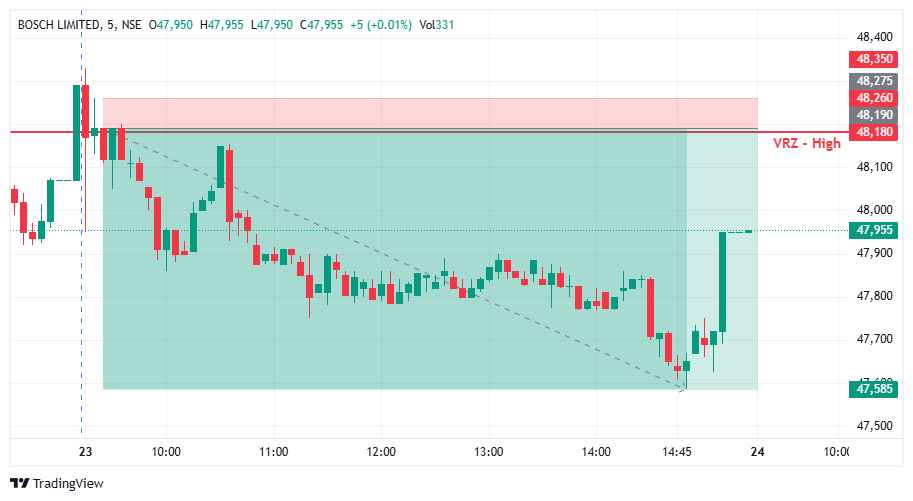

🟢 BOSCH moved toward the VRZ High, where buyers attempted to sustain price above the resistance zone.
⚠️ The breakout failed to hold as price faced rejection around the ₹48,180 VRZ High.
🔴 The rejection confirmed a Breakout Failure (BOF) structure and opened a potential bearish reversal setup.
🔴 Selling pressure increased after the failed breakout.
📊 Price moved lower from the ₹48,180 VRZ High, indicating weakening bullish momentum.
💥 The setup eventually delivered a 1.26% bearish move with a strong 1:8 Risk-Reward.
🟢 Buyers: Attempted to push BOSCH above the VRZ High.
🟡 Breakout Traders: Came under pressure as price failed to sustain the breakout.
🔴 Sellers: Regained control following the rejection and drove price lower.
🎭 The initial breakout attempt created bullish expectations around the resistance zone.
⚠️ Failure to sustain above the VRZ High weakened the breakout structure.
📉 The rejection shifted momentum toward sellers and supported the bearish move.
🎯 The key confirmation came when BOSCH failed to sustain above ₹48,180.
🔄 The failed breakout indicated that buying momentum was losing strength.
⚡ Continued downside price action provided follow-through for the bearish BOF setup.
🔸 🚫 Failed Breakout Indicates Rejection
Failure to sustain above resistance can invalidate the breakout structure.
🔹 🎯 VRZ High Acts as a Key Reference
The ₹48,180 zone provided a clear technical level for monitoring the reversal.
🛡️ Defined Risk Supports Trade Discipline
The VRZ High offered a structured reference for managing risk.
⚡ 📉 Bearish Follow-Through Matters
Continued downside movement strengthened the developing bearish structure.
📉 After the VRZ High rejection, BOSCH developed a sustained bearish intraday structure.
🔴 Sellers maintained control as price gradually moved lower.
📌 The lower price structure supported continued downside momentum.
🔥 Selling pressure expanded following the breakout failure.
📉 BOSCH extended the move lower from the VRZ High and eventually delivered a 1.26% downside move.
🏆 The setup produced a strong 1:8 Risk-Reward outcome.
🔸 The setup became actionable after BOSCH failed to sustain above the ₹48,180 VRZ High.
📉 The bearish reversal developed as sellers regained control.
⚖️ The confirmed BOF structure provided a defined-risk intraday setup with a 1:8 RR opportunity.

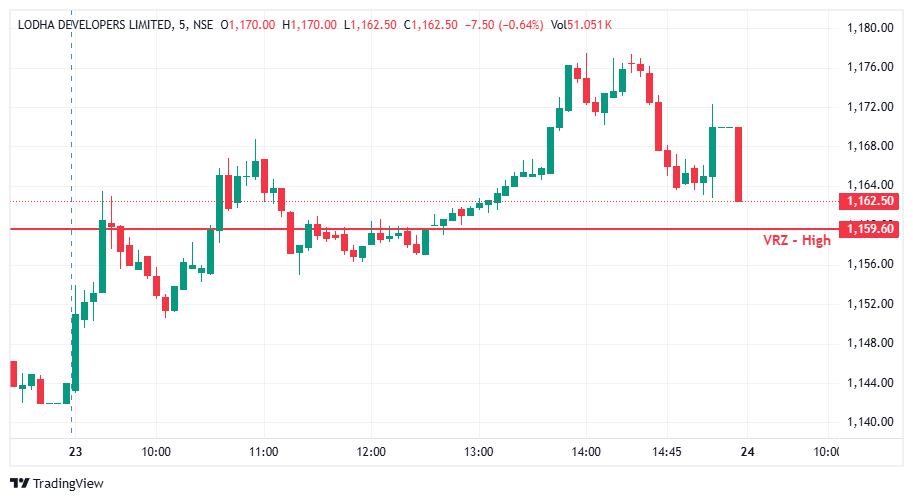

LODHA pushed steadily higher through the session, clearing the VRZ High (₹1,159.60) with strong bullish candles as buyers took control of the trend.
Once price extended well above the zone and began stalling near the highs, the Logical Trading System (LTS) flagged a valid BOF Sell setup, anticipating exhaustion and a reversal back toward the zone.
Although the setup met every predefined condition at entry, the expected downside follow-through never fully materialized before the stop was hit.
Price action into the entry showed repeated attempts to push higher, with each pullback shallow and quickly bought up — a sign that bullish momentum was still intact rather than fading.
The broader intraday structure remained one of higher highs and higher lows, leaving little room for a sustained short-side move to develop cleanly.
This reflected persistent buying pressure rather than genuine distribution at the top.
The BOF Sell trade was activated once price showed signs of stalling near the session highs after the extended rally.
Initially, the setup respected the trading rules on entry.
Soon after, instead of reversing lower, price pushed marginally higher, brushing the predefined stop level before the eventual sharp reversal occurred.
The stop loss was triggered just ahead of the larger drop, and the trade was closed for a controlled loss due to disciplined risk management.
The trade failed because price extended just beyond the stop threshold before the anticipated reversal actually played out, stopping the trade out prematurely.
🔻 Strong bullish momentum persisted after entry.
🔻 Shallow pullbacks throughout the uptrend.
🔻 No clear lower high formed before the stop was hit.
🔻 Buyers continued absorbing selling pressure.
🔻 Late reversal came only after the stop had already triggered.
These signals reduced the probability of a clean BOF Sell reversal at the time of entry.
This chart demonstrates a failed Breakout Failure (BOF) reversal where the exhaustion signal arrived a few candles too early.
🔴 Price broke out and extended above the VRZ High.
🟡 A stalling pattern formed near the highs, triggering the sell.
🟠 Price pushed slightly further before reversing.
⚫ Stop loss was hit just before the larger drop unfolded.
This type of price action often occurs when a trend has strong underlying momentum that takes one extra push to exhaust.
⚠️ Not every BOF setup times the exact top or bottom.
📊 Confirmation candles matter, but momentum can override them briefly.
🛡️ Extended trends often need more than one stall to reverse.
🎯 Strict stop-loss discipline prevents a small loss from becoming a large one.
📈 Consistency comes from following the process — not from winning every trade.
This was a valid BOF execution according to the Logical Trading System (LTS).
Experienced traders recognize that:
✅ Every strategy has losing trades.
✅ Process-driven execution is more important than individual outcomes.
✅ Risk management protects long-term profitability.
✅ Emotional discipline separates professionals from impulsive traders.
Professional trading is built on preserving capital.
✔️ Entry followed predefined BOF rules.
✔️ Risk was defined before execution.
✔️ Stop loss protected trading capital.
✔️ Capital remains available for the next high-probability opportunity.
Controlled losses are an essential part of sustainable trading.
📈 Long-term trading success comes from consistently executing high-quality setups while keeping losses small and allowing winning trades to compound.
🛡️ Professional traders never judge their performance based on a single trade — they judge it by disciplined execution over hundreds of trades.
⚠️ This LODHA BOF Failure demonstrates that a strong breakout can take longer to exhaust than expected. Confirmation, patience, and respecting the stop are essential when trading against strong momentum.
🌍 Markets continuously reward discipline, patience, and effective risk management.
💪 Follow your trading plan, protect your capital, and let consistency — not emotions — guide every decision.
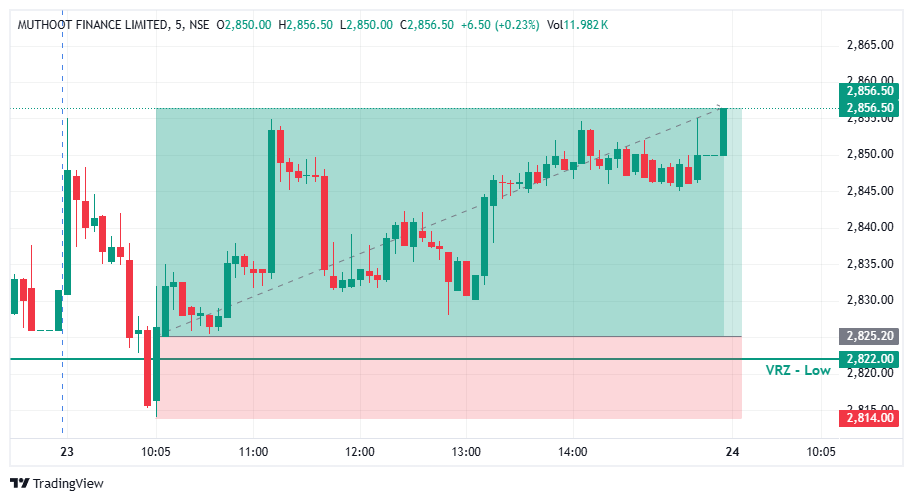

📊 MUTHOOTFIN slipped early in the session and pushed directly into the important ₹2,822.00 VRZ Low support zone.
⚠️ Price action near this level showed an attempt to break down and extend the decline further.
🎯 The VRZ Low became a critical technical reference for spotting a potential bullish reversal.
🚧 Breakdown Attempt Loses Strength
🚨 Price pierced the ₹2,822.00 VRZ Low, briefly dropping into the marked support area near ₹2,814.
🪤 However, sellers failed to secure acceptance below the zone, signalling exhausted bearish momentum.
🔺 Fresh buying interest surfaced at the lows, creating the first signs of a failed breakdown.
🎯 The sharp rejection from the VRZ Low matured into a clean Bullish Breakdown Failure (BOF) structure.
⚡ As price reclaimed the support zone, buyers began taking back control of the short-term market structure.
📈 The failed breakdown marked a clear handover of momentum from sellers to buyers.
🔺 Following the VRZ Low reclaim, MUTHOOTFIN held a steady higher-low sequence across the trading day.
📊 Progressive higher levels formed as bullish momentum expanded step by step on the 5-minute chart.
💥 The advance eventually stretched to the ₹2,856.50 price area, confirming the successful bullish BOF setup.
📈 The reversal produced a solid 1.11% upside move from the VRZ Low rejection area.
⚡ The controlled, trend-driven expansion underlined the quality of the failed breakdown structure.
🏆 With disciplined risk management, the trade delivered a healthy 1:3 Risk-to-Reward ratio.
🔎 The decisive technical development here was the inability of sellers to hold price below the ₹2,822.00 VRZ Low.
⚡ The rejection showed bearish momentum fading at support, opening the door for buyers to step in.
📈 Once price recovered above the VRZ Low, demand strengthened and an orderly uptrend developed.
🔄 This mix of support rejection, failed breakdown and sustained buying formed a textbook bullish BOF structure.
📍 VRZ Low: ₹2,822.00 acted as the key support reference.
🔻 Breakdown Test: Sellers pressed below the zone but could not sustain the move.
🚨 Rejection: Strong buying interest appeared right at the VRZ Low.
🔄 BOF Confirmation: Price reclaimed the support area, confirming the failure.
🐂 Momentum Shift: Buyers assumed control as bullish momentum built.
🎯 Upside Target: Price advanced toward the ₹2,856.50 area.
🏆 Trade Result: 1.11% upside with 1:3 RR.
🎯 A clearly defined VRZ Low gave the bullish BOF setup a structured technical reference point.
⚖️ The 1:3 Risk-to-Reward outcome reflects the value of entries where the invalidation level sits close to the zone.
🧠 Proper position sizing, predefined stop levels and disciplined execution remain essential for consistency.