
Select a trading day to view all Scanner results, chart evidence, and market explanations.
4 Scanners Available
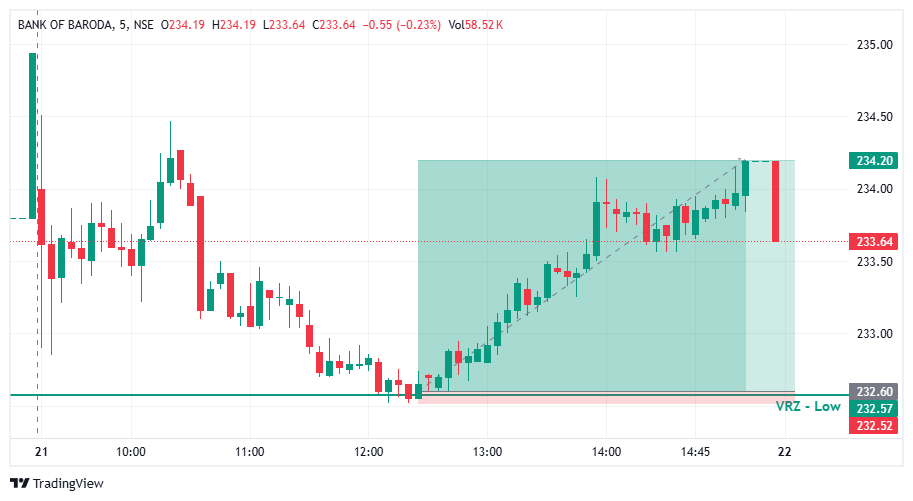

🔻 BANKBARODA tested the VRZ Low, where sellers attempted to push the price below the support zone.
🚨 The breakdown failed to sustain as price rejected the lower levels around ₹232.57.
🟢 This recovery confirmed the Breakdown Failure (BOF) setup and created a bullish intraday opportunity.
🟢 Buyers stepped in after the failed breakdown and gradually pushed BANKBARODA higher.
📊 The recovery from the ₹232.57 VRZ Low showed improving buying participation.
🚀 The setup ultimately delivered a 0.69% bullish move with an exceptional 1:20 Risk-Reward.
🔴 Sellers: Attempted to extend the breakdown below the VRZ Low.
🟡 Breakdown Traders: Came under pressure as price failed to sustain below support.
🟢 Buyers: Regained control and drove the bullish recovery.
🎭 The initial move toward the VRZ Low created bearish expectations.
⚠️ However, sellers failed to sustain price below the support zone.
📈 The rejection shifted momentum toward buyers and supported the bullish reversal.
🎯 The key confirmation came when BANKBARODA rejected the lower levels and reclaimed the VRZ Low area.
🔄 The failed breakdown indicated that bearish momentum was losing strength.
⚡ Continued upside movement provided confirmation for the bullish BOF setup.
🔸 🚫 Failed Breakdowns Can Trap Sellers
When price fails to sustain below support, bearish positions can come under pressure.
🔹 🎯 VRZ Low Rejection Matters
The rejection near the VRZ Low highlighted renewed buying interest.
🛡️ Defined Risk Supports Trade Discipline
The VRZ Low provided a clear reference point for managing trade risk.
⚡ 📈 Follow-Through Strengthens the Setup
Continued upside movement after the rejection supported the bullish reversal structure.
📈 Following the failed breakdown, BANKBARODA began developing a stronger intraday bullish structure.
🟢 Buyers maintained control as price moved progressively higher from the VRZ Low.
🚀 The improving structure supported the continuation of bullish momentum.
🔥 Buying pressure strengthened following the breakdown failure.
📈 BANKBARODA continued moving higher from the VRZ Low and extended the bullish reversal.
🏆 The trade ultimately delivered a 0.69% upside move with a 1:20 RR.
🔸 The setup became actionable after BANKBARODA failed to sustain below the ₹232.57 VRZ Low.
📈 Buyers regained control and pushed the price higher.
⚖️ The confirmed BOF structure provided a disciplined intraday setup with defined risk and a 1:20 Risk-Reward opportunity.

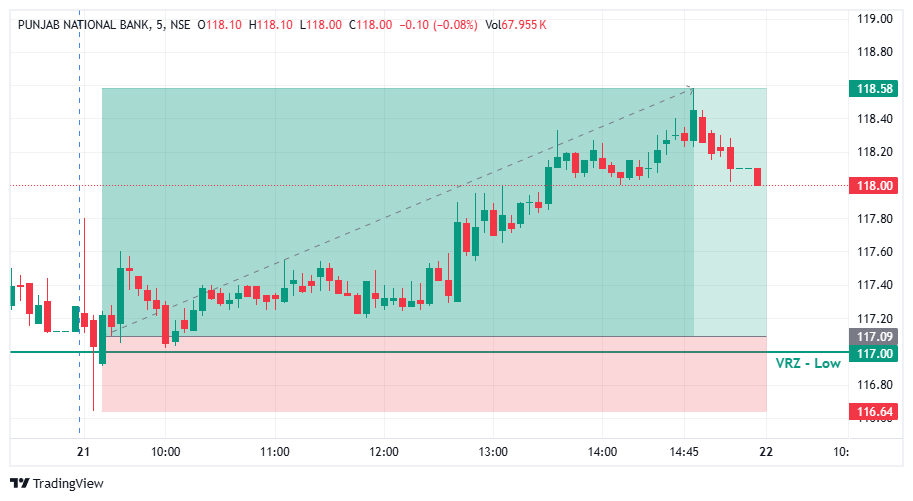

📊 PNB drifted lower in the early session and pushed directly into the important ₹117.00 VRZ Low support zone.
⚠️ Price action near this level showed an attempt to break down and extend the decline further.
🎯 The VRZ Low became a critical technical reference for spotting a potential bullish reversal.
🚨 Price probed the ₹117.00 VRZ Low, dipping briefly into the marked support area.
🪤 However, sellers failed to secure acceptance below the zone, signalling exhausted bearish momentum.
🔺 Fresh buying interest surfaced at the lows, creating the first signs of a failed breakdown.
🎯 The sharp rejection from the VRZ Low matured into a clean Bullish Breakdown Failure (BOF) structure.
⚡ As price reclaimed the support zone, buyers began taking back control of the short-term market structure.
📈 The failed breakdown marked a clear handover of momentum from sellers to buyers.
🔺 Following the VRZ Low reclaim, PNB held a steady higher-low sequence across the trading day.
📊 Progressive higher levels formed as bullish momentum expanded step by step on the 5-minute chart.
💥 The advance eventually stretched to the ₹118.58 price area, confirming the successful bullish BOF setup.
📈 The reversal produced a solid 1.27% upside move from the VRZ Low rejection area.
⚡ The controlled, trend-driven expansion underlined the quality of the failed breakdown structure.
🏆 With disciplined risk management, the trade delivered a healthy 1:3 Risk-to-Reward ratio.
🔎 The decisive technical development here was the inability of sellers to hold price below the ₹117.00 VRZ Low.
⚡ The rejection showed bearish momentum fading at support, opening the door for buyers to step in.
📈 Once price recovered above the VRZ Low, demand strengthened and an orderly uptrend developed.
🔄 This mix of support rejection, failed breakdown and sustained buying formed a textbook bullish BOF structure.
📍 VRZ Low: ₹117.00 acted as the key support reference.
🔻 Breakdown Test: Sellers pressed below the zone but could not sustain the move.
🚨 Rejection: Strong buying interest appeared right at the VRZ Low.
🔄 BOF Confirmation: Price reclaimed the support area, confirming the failure.
🐂 Momentum Shift: Buyers assumed control as bullish momentum built.
🎯 Upside Target: Price advanced toward the ₹118.58 area.
🏆 Trade Result: 1.27% upside with 1:3 RR.
🎯 A clearly defined VRZ Low gave the bullish BOF setup a structured technical reference point.
⚖️ The 1:3 Risk-to-Reward outcome reflects the value of entries where the invalidation level sits close to the zone.
🧠 Proper position sizing, predefined stop levels and disciplined execution remain essential for consistency.

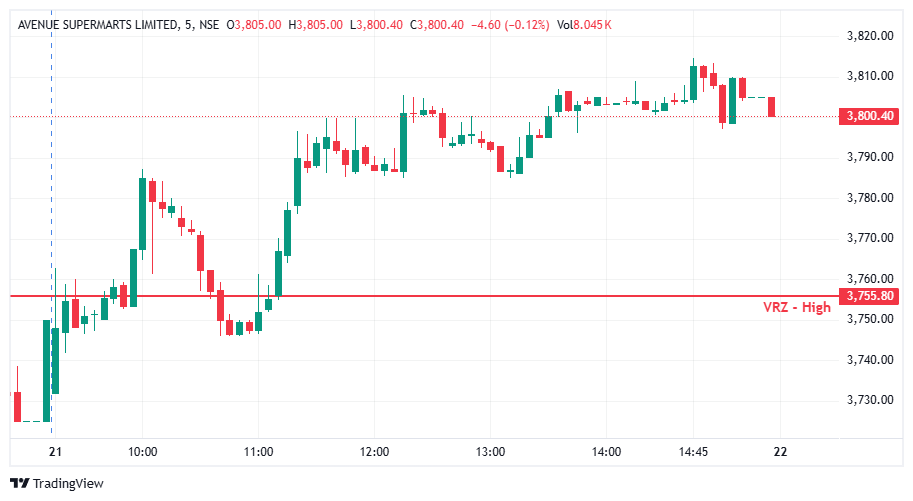

📈 DMART moved above the ₹3,755.80 VRZ High, creating a potential bearish BOF opportunity. ⚠️ However, the expected rejection failed to develop as sellers could not push price back below the key zone. 🟢 Buyers maintained control above the VRZ High and gradually expanded the upside move.
🔎 After crossing ₹3,755.80, price initially showed some hesitation and consolidation. 📊 Instead of producing a sustained breakdown below the VRZ High, buyers continued to defend higher levels. 🚀 The formation of higher highs and higher lows gradually strengthened the bullish intraday structure.
🎯 The bearish BOF required a failed breakout followed by a decisive move back below ₹3,755.80. 🚫 That confirmation never appeared. 🟢 Price continued holding above the VRZ High and eventually accelerated toward the ₹3,810 area, invalidating the bearish reversal thesis.
🟢 Bullish candles continued to appear after the VRZ High breakout, showing sustained buyer participation. ⚡ Short consolidation phases were followed by fresh upside expansion. 📈 The afternoon move toward ₹3,810 demonstrated that buyers were able to maintain momentum instead of allowing sellers to create a reversal.
🎯 The bearish BOF required a rejection and sustained move back below ₹3,755.80. 🚫 Since price remained above the level, the bearish setup lacked confirmation. ⚠️ Entering short without a breakdown below the VRZ High would have exposed the trade to continued upside risk. 🧭 Waiting for rejection + breakdown + bearish follow-through would have provided stronger validation.
🔒 A breakout should not automatically be treated as a reversal opportunity. ⚠️ When price continues accepting above the VRZ High, the bearish thesis needs to be reassessed quickly. 🛑 Avoiding premature short entries and respecting the failed-reversal condition helps protect capital when bullish momentum remains strong.
🧩 The key psychological trap was expecting every move above a VRZ High to fail. 👀 Traders needed to observe whether sellers could actually force price back below ₹3,755.80. 🟢 Instead, buyers repeatedly maintained higher levels, showing stronger conviction. 🎯 The lesson is to react to confirmed rejection rather than anticipate it.
📍 ₹3,755.80 was the critical decision level for this DMART setup. 📈 Price broke above the VRZ High and successfully maintained acceptance instead of producing a bearish failure. ⚡ The sustained hold above the zone allowed bullish momentum to continue toward ₹3,810, demonstrating why confirmation is essential before entering a BOF reversal.
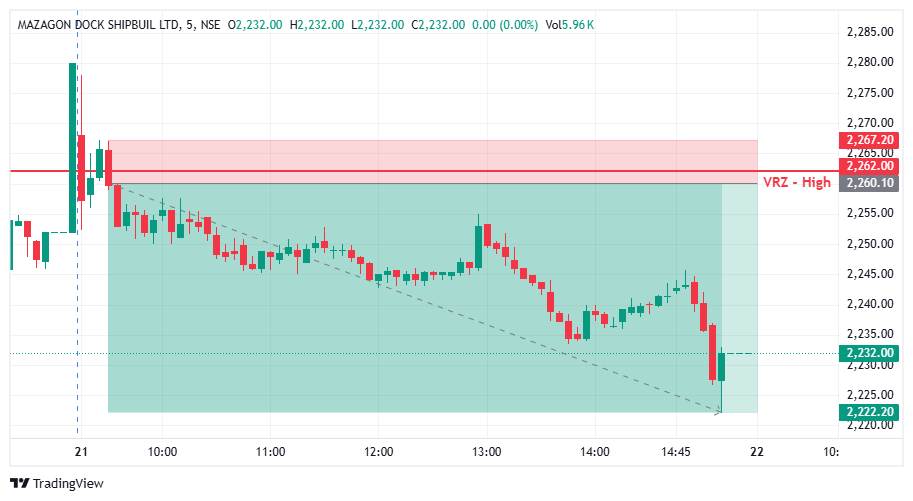

🔹 MAZDOCK pushed into the VRZ High during the opening session, where buyers attempted to force a breakout above the key resistance zone.
⚠️ The breakout failed to sustain as price was rejected sharply and slipped back below the VRZ High, signalling weakening bullish momentum.
🔻 This rejection confirmed the Breakout Failure (BOF) setup and created a high-probability bearish intraday opportunity.
📉 After losing the VRZ High, sellers took control and price began stair-stepping lower throughout the session.
🔴 Price continued trading below the resistance zone, confirming sustained bearish strength.
🎯 The confirmed BOF setup delivered a 1.68% bearish move with an excellent 1:5 Risk-Reward.
🔴 Sellers: Defended the VRZ High aggressively and dictated the trend for the rest of the day.
🟡 Breakout Traders: Were trapped as price collapsed back below the resistance zone.
🟢 Buyers: Lost momentum after failing to hold above the VRZ High, with every intraday pullback getting sold into.
🎭 The initial breakout attempt attracted bullish traders expecting continuation above ₹2,260.
🚨 As price rejected the VRZ High, trapped buyers were forced to exit, adding fresh supply to the market.
📉 This shift in sentiment accelerated the bearish decline and strengthened selling momentum into the close.
🌈 Failed Breakouts Often Open the Door to Bearish Opportunities
A breakout that cannot hold above resistance frequently results in sharp bearish reversals.
✅ Confirmation Improves Trade Quality
The rejection below the VRZ High confirmed seller strength before entry.
🎯 Structured Risk Enhances Consistency
Using the VRZ High as the invalidation level supported disciplined trade execution.
🚀 Trade with Confirmed Momentum
Following confirmed price action improves the probability of successful BOF trades.
📊 Once price lost the VRZ High, the stock started forming lower highs and lower lows along a clean descending structure.
🔻 The bearish market structure remained intact, and even the midday bounce failed well below the zone, allowing sellers to maintain control through the final hour.
🔸 The trade became actionable after price rejected the VRZ High and confirmed the failed breakout.
📉 Sellers controlled the session, producing a clean bearish intraday trend.
🏆 The setup delivered a 1.68% bearish move with a strong 1:5 Risk-Reward.
⚖️ Disciplined execution and structured risk management helped maximize the trade opportunity.