
Select a trading day to view all Scanner results, chart evidence, and market explanations.
2 Scanners Available
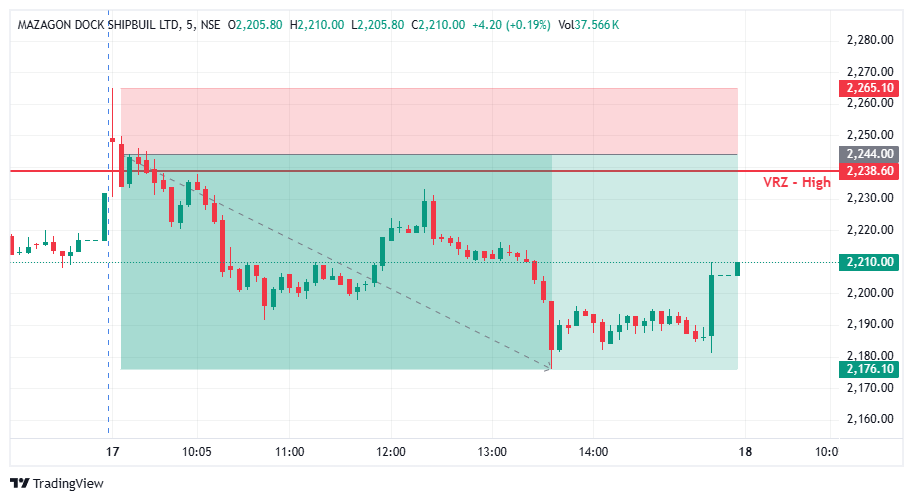

🟢 MAZDOCK moved towards the VRZ High, where buyers attempted to push the price above the resistance zone.
⚠️ The breakout failed to sustain as price faced rejection around the ₹2,238.60 VRZ High.
🔴 This rejection confirmed the Breakout Failure (BOF) setup and created a bearish intraday opportunity.
🔴 Sellers stepped in following the failed breakout and pushed MAZDOCK lower from the VRZ High.
📊 The rejection near ₹2,238.60 showed weakening buying pressure and increasing seller participation.
💥 The setup eventually delivered a strong 3.03% bearish move with a 1:3 Risk-Reward.
🟢 Buyers: Attempted to extend the breakout above the VRZ High.
🟡 Breakout Traders: Came under pressure as the breakout failed to sustain.
🔴 Sellers: Regained control and drove the price lower.
🎭 The initial move toward the VRZ High created bullish expectations.
⚠️ However, the inability to sustain above resistance weakened the breakout momentum.
📉 The rejection shifted market control toward sellers and supported the downside reversal.
🎯 The key confirmation came when MAZDOCK failed to sustain above the ₹2,238.60 VRZ High.
🔄 The failed breakout indicated that bullish momentum was losing strength.
⚡ Continued downside movement provided follow-through for the bearish BOF setup.
🔸 🚫 Failed Breakouts Can Trap Buyers
When price fails to sustain above resistance, breakout positions can come under pressure.
🔹 🎯 VRZ High Rejection Matters
The rejection around the VRZ High highlighted increasing selling participation.
🛡️ Defined Risk Supports Trade Discipline
The VRZ High provided a clear reference point for managing trade risk.
⚡ 📉 Follow-Through Strengthens the Setup
Continued downside movement after the rejection supported the bearish reversal structure.
📉 Following the failed breakout, MAZDOCK developed a clear bearish intraday structure.
🔴 Sellers maintained control as price moved progressively lower from the VRZ High.
📌 The developing downside structure supported the continuation of bearish momentum.
🔥 Selling pressure increased after the breakout failure.
📉 MAZDOCK continued moving lower from the VRZ High and extended the bearish reversal.
🏆 The trade ultimately delivered a 3.03% downside move with a 1:3 RR.
🔸 The setup became actionable after MAZDOCK failed to sustain above the ₹2,238.60 VRZ High.
📉 Sellers regained control and pushed the price lower.
⚖️ The confirmed BOF structure provided a disciplined intraday setup with defined risk and a 1:3 Risk-Reward opportunity.

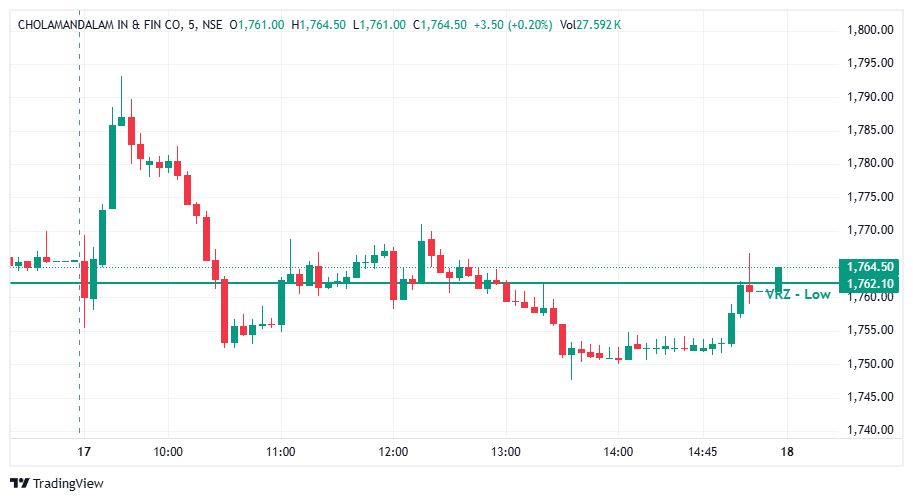

CHOLAFIN showed high volatility during the opening session, with price initially moving sharply around the ₹1,762.10 VRZ Low. 📊 After the early recovery, the stock struggled to maintain bullish momentum and gradually shifted into a weaker intraday structure.
The initial move back above the VRZ Low created the possibility of a bullish BOF. 🔄 However, the reclaim did not develop into sustained upside momentum. Price eventually slipped back below ₹1,762.10, showing that buyers were unable to maintain control around the key reversal zone.
The bullish BOF required a decisive reclaim of the VRZ Low followed by sustained acceptance above the level. ⚠️ Instead, after several attempts around the zone, price eventually broke below ₹1,762.10 and continued lower. This failure to hold the reclaimed zone weakened the bullish reversal thesis.
Following the rejection, CHOLAFIN developed a gradual sequence of lower highs and lower lows. 🐻 Selling pressure increased during the afternoon session, with price moving toward the ₹1,750–₹1,752 area before attempting a late recovery.
The chart displayed strong two-way volatility during the session. ⚡ Although bullish candles appeared during recovery attempts, they lacked sustained follow-through. Later bearish candles pushed price back below the VRZ Low, confirming weakness in the earlier reversal structure.
A successful BOF requires more than simply moving back above the VRZ Low. 🎯 The reclaim needs acceptance + follow-through + momentum. In this setup, the stock failed to maintain that bullish structure and eventually returned below the key level.
Entering a long position solely on the first reclaim of ₹1,762.10 could expose the trade to a false reversal. 🚨 The subsequent failure to hold the zone demonstrated why confirmation is important before treating the BOF as a valid bullish setup.
Once price failed to sustain above the VRZ Low, the bullish BOF thesis required reassessment. 🔐 Respecting the invalidation level and avoiding an unconfirmed continuation entry can help limit unnecessary risk during volatile intraday conditions.
The first strong recovery can create confidence that the breakdown has failed. 🧠 But traders need to distinguish between a temporary reclaim and genuine acceptance above the reversal zone. CHOLAFIN demonstrated how quickly an initial bullish recovery can lose momentum when buyers fail to defend the key level.
This CHOLAFIN setup highlights an important BOF principle: the reclaim is only the beginning of the confirmation process. 📚 Without sustained acceptance and bullish follow-through above ₹1,762.10, the reversal remains vulnerable to failure.
The ₹1,762.10 VRZ Low remained the key decision level throughout the setup. 🎯 The inability to sustain bullish momentum above the zone eventually allowed bearish price action to dominate the afternoon session. 📉