
Select a trading day to view all Scanner results, chart evidence, and market explanations.
4 Scanners Available
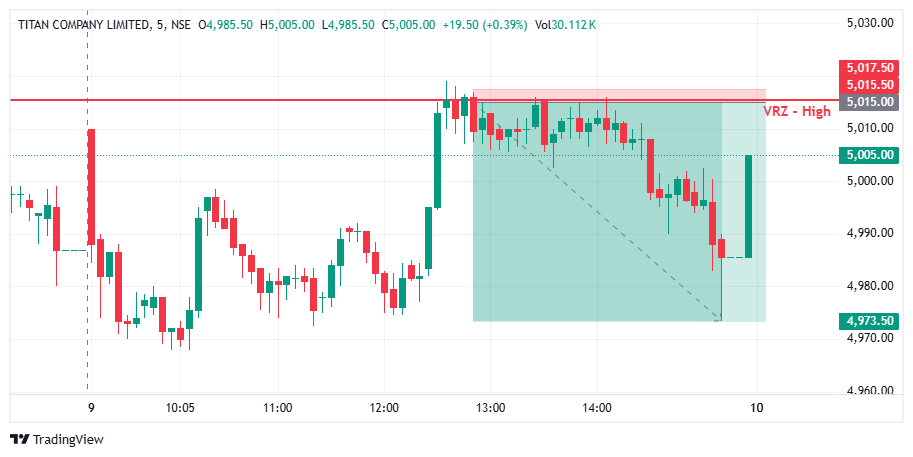

🟢 TITAN moved steadily towards the VRZ High, where buyers attempted to push the price above the key resistance zone.
⚠️ However, the breakout failed to sustain at higher levels as the price faced strong rejection near the VRZ High.
🔴 This inability to maintain the breakout confirmed the Breakout Failure (BOF) setup and created a clear bearish intraday opportunity.
🔴 Strong selling pressure emerged shortly after the failed breakout near the important resistance zone.
📊 TITAN started moving lower from the ₹5,015.50 VRZ High, indicating that buyer control was gradually weakening.
💥 The setup eventually delivered a 0.83% bearish move with an impressive 1:16 Risk-Reward, highlighting the strength of the reversal.
🟢 Buyers: Attempted to extend the breakout above the VRZ High, expecting further upside continuation.
🟡 Breakout Traders: Came under pressure as the price failed to sustain above the resistance and quickly reversed lower.
🔴 Sellers: Regained market control and pushed TITAN into a strong bearish reversal with continued downside momentum.
🎭 The initial upward move toward the resistance zone created bullish expectations among breakout traders.
⚠️ However, the failure to sustain above the VRZ High weakened buyer confidence and changed the short-term market sentiment.
📉 The rejection shifted control toward sellers and supported a stronger downside reversal from the resistance area.
🎯 The key confirmation came when TITAN failed to sustain above the ₹5,015.50 VRZ High despite the initial breakout attempt.
🔄 The failed breakout indicated that buying pressure was losing strength and sellers were becoming increasingly active.
⚡ Continued bearish follow-through after the rejection validated the BOF setup and strengthened the downside trade opportunity.
🔸 🚫 Failed Breakouts Can Trap Buyers
When price fails to sustain above a major resistance level, breakout buyers can quickly become trapped as selling pressure increases.
🔹 🎯 VRZ High Rejection Is Important
The rejection near the VRZ High highlighted increasing seller participation and provided an important clue for the bearish reversal.
🛡️ Defined Risk Improves Trade Discipline
The VRZ High offered a clear technical reference for managing risk while maintaining disciplined trade execution.
⚡ Momentum Supports the Reversal
Once sellers regained control, the increasing downside momentum helped the bearish move develop with stronger and more consistent follow-through.
📉 After the failed breakout, TITAN began developing a weaker intraday price structure with sellers gaining control.
🔴 Sellers continued dominating the price action as TITAN moved further away from the ₹5,015.50 VRZ High.
🚀 The developing bearish structure supported continued downside momentum and reinforced the validity of the BOF reversal.
🔥 Selling pressure increased significantly following the failed breakout and rejection from the resistance zone.
📉 TITAN continued moving lower from the VRZ High, confirming that the bearish reversal was gaining strength.
🏆 The trade ultimately delivered a 0.83% downside move with a strong 1:16 RR, demonstrating an efficient risk-to-reward opportunity.
🔸 The setup became actionable after TITAN failed to sustain above the ₹5,015.50 VRZ High and showed clear rejection at resistance.
📉 Sellers regained control as price moved lower from the resistance zone, creating a structured bearish intraday opportunity.
⚖️ The confirmed BOF structure provided a disciplined trade setup with defined risk and an impressive 1:16 Risk-Reward opportunity.

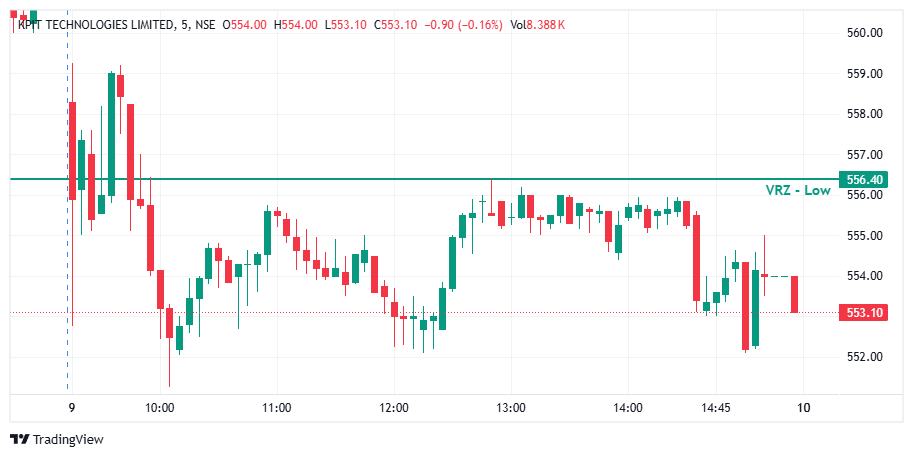

📉 KPITTECH moved below the ₹556.40 VRZ Low during the session, creating the conditions for a potential bullish BOF reversal. ⚠️ However, the recovery failed to produce a decisive reclaim of the reversal zone. 🔻 Price remained mostly below ₹556.40, indicating that sellers continued to control the short-term structure.
🔎 After the initial breakdown, price attempted several recoveries toward the VRZ Low. 🚫 None of these moves established sustained acceptance above ₹556.40. 🧱 The repeated inability to reclaim the key level kept the price structure weak and prevented the bullish BOF from receiving proper confirmation.
🎯 A valid bullish BOF required KPITTECH to reclaim and hold above ₹556.40. ⚠️ Although buyers made multiple attempts to recover, the moves lacked sufficient follow-through. 🔴 Selling pressure repeatedly appeared around the higher levels, keeping the stock below the VRZ Low and weakening the expected reversal.
🟢 Several short-term bullish candles appeared during the recovery phases, but they failed to create sustained upside momentum. 📊 Price repeatedly consolidated beneath the VRZ Low instead of breaking through it. 🔻 The late-session weakness further showed that buyers were unable to maintain control after the recovery attempts.
🎯 The bullish BOF required a decisive reclaim of ₹556.40 before entry confirmation. 🚫 Since price failed to sustain above the level, the reversal remained unconfirmed. ⚠️ Entering before confirmation would have increased downside exposure as the structure continued to remain weak. 🧭 Waiting for reclaim + acceptance + bullish follow-through would have provided stronger trade validation.
🔒 When the VRZ Low continues to act as resistance, the bullish BOF thesis should be reassessed. ⚠️ Avoiding premature entries can help reduce exposure to a failed reversal. 🛑 Respecting the setup invalidation and waiting for clear confirmation keeps capital protection ahead of prediction.
🧩 A breakdown does not automatically mean that a bullish reversal will follow. 👀 Traders should focus on whether buyers can actually reclaim the VRZ Low and sustain acceptance above it. ⚠️ Repeated failed reclaims indicate weakening buyer conviction. 🎯 Rejection + reclaim + acceptance should provide the confirmation before treating the BOF as a valid reversal.
📍 The ₹556.40 VRZ Low was the critical decision point in this KPITTECH setup. 🔻 Since price could not reclaim the level convincingly, the expected bullish BOF failed to develop. 📊 The setup highlights the importance of waiting for confirmation rather than anticipating a reversal simply because price has moved below a reversal zone.
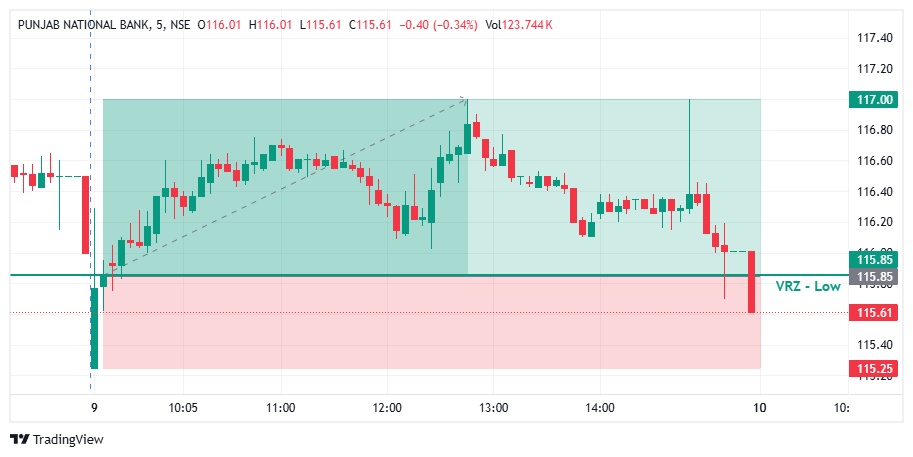

🔻 PNB tested the VRZ Low, where sellers attempted to push the price below the important support zone.
🚨 However, the breakdown failed to sustain as the price quickly recovered from the lower levels.
🟢 This recovery indicated a Breakdown Failure (BOF) and created a bullish intraday trading opportunity.
🟢 Buyers stepped in after the failed breakdown and pushed PNB back above the key support area.
📊 The recovery from the ₹115.85 VRZ Low showed improving buying participation.
🚀 The setup eventually delivered a 0.99% bullish move with a 1:2 Risk-Reward.
🔴 Sellers: Attempted to extend the breakdown below the VRZ Low.
🟡 Breakdown Traders: Faced pressure as the price recovered from the lower levels.
🟢 Buyers: Regained control and pushed the price higher.
🎭 The initial move below the support zone created bearish expectations.
⚠️ However, the inability to sustain the breakdown weakened seller confidence.
📈 The recovery shifted market control toward buyers and supported the bullish reversal.
🎯 The important confirmation came when PNB recovered from the breakdown area and moved back above the ₹115.85 VRZ Low.
🔄 The failed breakdown signaled that selling pressure was losing strength.
⚡ Continued bullish momentum validated the BOF setup.
🔸 🚫 Failed Breakdowns Can Trap Sellers
When price fails to sustain below support and quickly recovers, bearish positions can come under pressure.
🔹 🎯 VRZ Low Recovery Is Important
The recovery around the VRZ Low highlighted renewed buyer participation.
🛡️ Defined Risk Improves Trade Discipline
The VRZ zone provided a clear reference for managing trade risk.
⚡ Momentum Supports the Reversal
Once buyers regained control, the bullish move developed with positive follow-through.
📈 After the failed breakdown, PNB started developing a stronger intraday bullish structure.
🟢 Buyers maintained control as the price moved away from the VRZ Low.
🚀 The improving structure supported the continuation of the upside move.
🔥 Buying pressure increased following the breakdown failure.
📈 Price continued moving higher from the VRZ Low and strengthened the bullish reversal.
🏆 The trade ultimately delivered a 0.99% upside move with a 1:2 RR.
🔸 The setup became actionable after PNB failed to sustain below the ₹115.85 VRZ Low.
📈 Buyers regained control and pushed the price higher from the support zone.
⚖️ The confirmed BOF structure provided a disciplined intraday setup with defined risk and a clear 1:2 Risk-Reward opportunity.
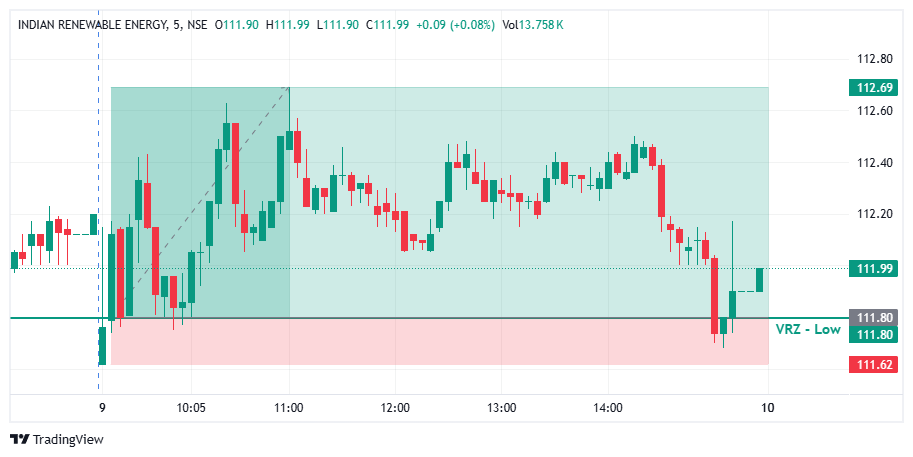

📊 IREDA traded within a broad intraday range before gradually moving toward the ₹111.80 VRZ Low.
⚠️ Selling pressure increased as price approached this important support zone, bringing the possibility of a bearish breakdown into focus.
🔎 The VRZ Low became the key reference level for identifying whether sellers could sustain the downside move.
🔻 Price moved below the ₹111.80 VRZ Low, showing an initial attempt by sellers to push the stock lower.
⚠️ However, the breakdown failed to sustain as bearish momentum weakened around the support area.
🔄 Buyers stepped in near the VRZ Low and helped push price back above the marked level.
🎯 The recovery above ₹111.80 transformed the failed breakdown into a potential Bullish Breakout Failure setup.
📈 This reclaim indicated that sellers were unable to maintain control below the support zone.
⚡ The shift in price action created a stronger short-term bullish structure and improved upside momentum.
⚡ Following the VRZ Low rejection, IREDA continued to recover from the breakdown area.
🟢 Buyers gradually strengthened their presence, supporting the upward price movement during the session.
💥 The bullish reversal eventually produced a 0.80% upside move, confirming the effectiveness of the BOF setup.
💰 The setup delivered an impressive 1:5 RR, showing how a controlled risk level combined with a meaningful price expansion can create an attractive trade outcome.
📊 The successful move was supported by the VRZ Low rejection, failed breakdown, and bullish price recovery.
🏆 This made the setup a clear example of a successful intraday Breakout Failure.
🔎 The main strength of this setup came from the failed breakdown below the VRZ Low followed by a decisive reclaim.
⚡ When bearish momentum failed to continue, the price recovery indicated that buyers were regaining control.
📈 The subsequent bullish movement confirmed the reversal and carried IREDA higher from the support zone.
🔹 VRZ Low: ₹111.80 acted as the primary support reference.
🔹 Breakdown Attempt: Sellers pushed price below the zone.
🔹 Failure: Bearish momentum could not sustain the breakdown.
🔹 Reclaim: Buyers recovered price above the VRZ Low.
🔹 Momentum: Bullish pressure strengthened after the reversal.
🔹 Outcome: 0.80% upside with 1:5 RR.
🧩 The setup demonstrates the importance of clearly defining the VRZ level and trade risk before entering a BOF opportunity.
🎯 A failed breakdown can offer a favorable setup when the invalidation level is clearly identified and the potential reward substantially exceeds the defined risk.
⚠️ As with any trading setup, disciplined position sizing and risk management remain essential.
📈 Price Move: 0.80% Upside
💰 Risk-to-Reward: 1:5 RR
🎯 Setup: Bullish BOF at VRZ Low
🟢 Key Level: ₹111.80
🏆 Result: Successful Breakout Failure Setup
