
Select a trading day to view all Scanner results, chart evidence, and market explanations.
4 Scanners Available
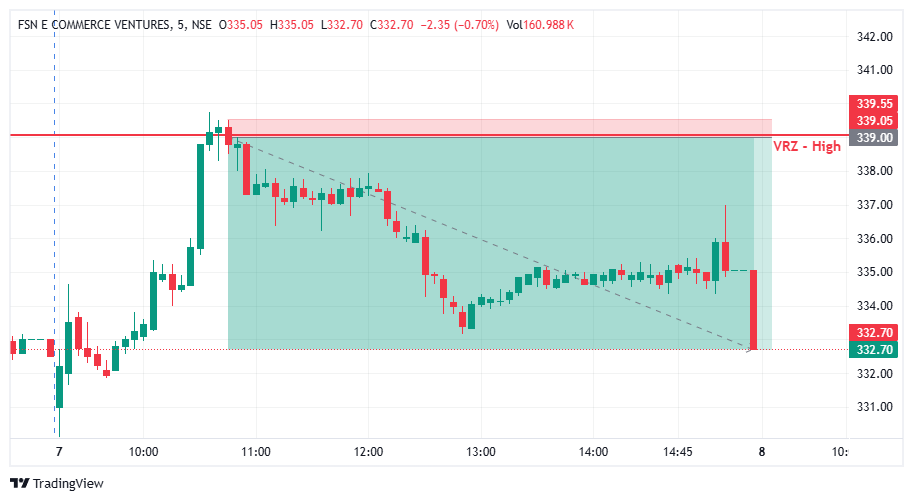

🔺 NYKAA tested the VRZ High, where buyers attempted to sustain a strong breakout above the key resistance zone.
🚨 The breakout failed to hold as price quickly moved back below the important resistance level.
🔻 This sharp rejection confirmed the bearish BOF setup and created a clear intraday downside opportunity.
🔴 After the failed breakout, sellers gradually gained stronger control over the price action.
📊 Price remained below the ₹339.05 VRZ High, showing continued weakness and fading bullish momentum.
🎯 The setup delivered a 1.86% bearish move with an impressive 1:11 Risk-Reward through strong downside follow-through.
🟢 Buyers: Attempted to push and sustain price above the important VRZ High resistance.
🟡 Breakout Traders: Faced increasing pressure when the breakout failed to sustain above the zone.
🔴 Sellers: Regained firm control after the rejection and pushed price steadily lower.
🎭 The initial breakout attempt created strong bullish expectations among market participants.
⚠️ However, the inability to sustain above resistance gradually weakened buyer confidence.
📉 As selling pressure increased, market sentiment shifted clearly from bullish expectations to bearish control.
🎯 The key confirmation came when NYKAA failed to hold above the ₹339.05 VRZ High.
🔄 Price moved decisively back below the resistance zone, validating the failed breakout structure.
⚡ Continued downside price action and selling pressure further strengthened the bearish BOF confirmation.
🚫 Failed Breakouts Can Trap Buyers
A breakout without strong and sustained follow-through can quickly reverse market direction and trap bullish traders.
🎯 Resistance Rejection Is a Key Signal
The sharp rejection near the VRZ High highlighted weakening buyer strength and growing seller participation.
🛡️ Defined Risk Supports Better Execution
The VRZ High provided a clear invalidation level for disciplined risk management and trade planning.
⚡ Follow-Through Strengthens the Setup
Continued selling after confirmation helped extend the downside move and improve the overall trade outcome.
📉 Following the rejection, NYKAA developed a weaker intraday structure with increasing downside pressure.
🔻 Sellers continued to maintain control below the VRZ High and prevented buyers from regaining momentum.
🐻 The developing bearish structure supported the continuation of sustained downside movement.
⚡ Selling pressure increased noticeably after the BOF confirmation near the resistance zone.
📉 Price moved steadily away from the VRZ High as sellers maintained strong control throughout the move.
🏆 The trade ultimately produced a 1.86% downside move with an exceptional 1:11 RR.
🔸 The setup became actionable after NYKAA clearly failed to sustain the breakout above ₹339.05.
📉 The strong rejection provided additional confirmation of increasing seller control and bearish momentum.
⚖️ The BOF structure offered a disciplined intraday opportunity with clearly defined risk and strong reward potential.
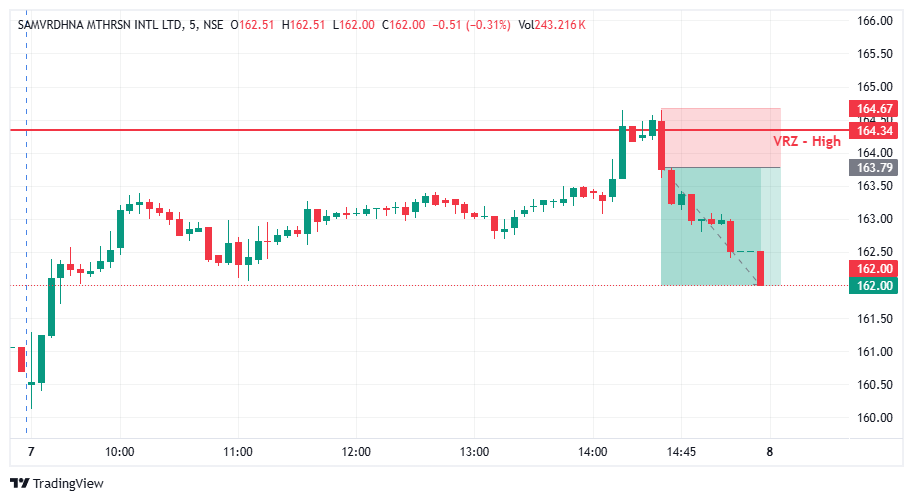

Price pushed above the ₹164.34 VRZ High and reached the ₹164.67 area, showing an initial attempt by buyers to take control. However, the breakout lacked sustained follow-through and quickly showed signs of weakness.
The breakout could not hold above the resistance zone, and price sharply moved back below the VRZ High. This failure transformed the bullish breakout attempt into a bearish Breakout Failure setup.
After the rejection, consecutive bearish candles appeared on the 5-minute chart, showing that sellers were gaining control. The increasing downside pressure helped push MOTHERSON progressively lower from the resistance area.
Traders who entered during the breakout above VRZ High were caught on the wrong side as price reversed. Their trapped positions, combined with fresh selling, added strength to the bearish move.
The ₹164.34 VRZ High became the key battle zone between buyers and sellers. Buyers attempted to sustain prices above the level, but sellers successfully defended the zone and forced price back into the previous range.
Following the rejection, MOTHERSON started forming a series of lower price movements on the 5-minute chart. This developing bearish structure confirmed that momentum had shifted away from the breakout buyers.
As selling momentum continued, price moved toward the marked downside target area around ₹162.00. The clean movement away from VRZ High created a favorable risk-to-reward opportunity for the bearish BOF trade.
The setup offered a structured short-trade opportunity with clearly defined risk around the breakout rejection zone. The controlled risk combined with the downside potential resulted in an effective 1:2 Risk-Reward setup.
🎯 Clear VRZ High rejection showed that buyers could not sustain the breakout.
⚠️ Failed breakout above resistance created the initial bearish reversal signal.
🔒 Breakout buyers became trapped as price returned below the key zone.
📉 Bearish candle structure strengthened as sellers continued to dominate.
⚡ Sustained selling momentum carried price toward the downside objective.
💰 1:2 Risk-Reward execution provided a balanced trade structure with defined risk.
🔥 This MOTHERSON setup demonstrates the importance of identifying failed breakouts at key VRZ levels. When price breaks resistance but cannot sustain the move, trapped buyers and renewed selling pressure can create a powerful momentum shift toward the downside.
MOTHERSON delivered a 1.09% bearish move following the VRZ High Breakout Failure, successfully achieving a 1:2 RR outcome. 📉🏆 The move highlights how a failed resistance breakout can quickly turn into a strong downside opportunity when selling momentum confirms the reversal.

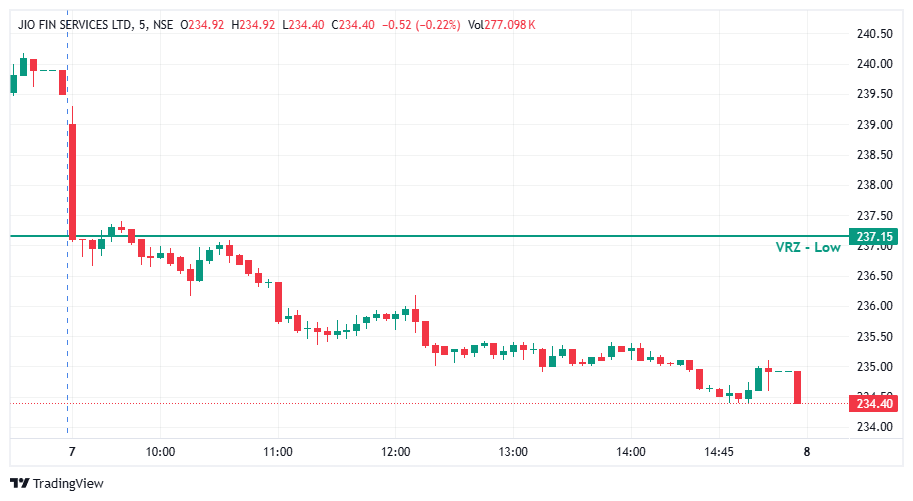

The stock opened with strong volatility and quickly broke below the ₹237.15 VRZ Low. Instead of showing a strong recovery after the breakdown, price remained weak below the reversal zone, keeping the overall intraday structure bearish. Continued selling pressure further reduced the probability of a successful bullish reversal.
Price failed to reclaim and sustain above the ₹237.15 VRZ Low despite multiple recovery attempts. The repeated lower highs, weak pullbacks, and gradual decline indicated that sellers were consistently maintaining control after the initial breakdown. The structure continued to favor bearish price action rather than a meaningful reversal.
The bullish BOF setup required a decisive reclaim of the VRZ Low with strong price acceptance above the level. However, the recovery attempt remained weak and failed to establish sustained acceptance above ₹237.15. This lack of confirmation invalidated the expected bullish reversal and allowed the bearish structure to continue.
Bearish candles dominated the price movement below the VRZ Low, reflecting persistent selling pressure throughout the setup. Although a few green candles appeared during the recovery attempts, they lacked sufficient volume, strength, and follow-through. The inability to build strong bullish momentum confirmed the weakness of the reversal attempt.
The setup became invalid because the required VRZ Low reclaim did not occur with convincing momentum and sustained price acceptance. Entering a bullish position without proper confirmation would have exposed the trade to continued downside risk. Waiting for a clear reclaim and confirmation would have provided a more disciplined approach.
Once the VRZ Low reclaim failed, the bullish BOF thesis had to be treated with increased caution. Respecting the predefined invalidation level and avoiding an unconfirmed bullish entry would help protect trading capital. Capital preservation should remain the priority whenever the expected reversal structure fails to develop.
A BOF setup is not confirmed simply because price moves near or briefly reacts from the reversal zone. Traders must wait for reclaim + acceptance + momentum confirmation before committing to the reversal. Avoiding premature entries can help reduce emotional decisions and prevent unnecessary losses during failed setups.
The JIOFIN setup demonstrates that a breakdown alone does not create a bullish BOF. A successful reversal requires a strong reclaim of the VRZ Low followed by sustained acceptance and bullish momentum. Without a sustained reclaim of ₹237.15, the expected reversal remained invalid and bearish price action continued to dominate.
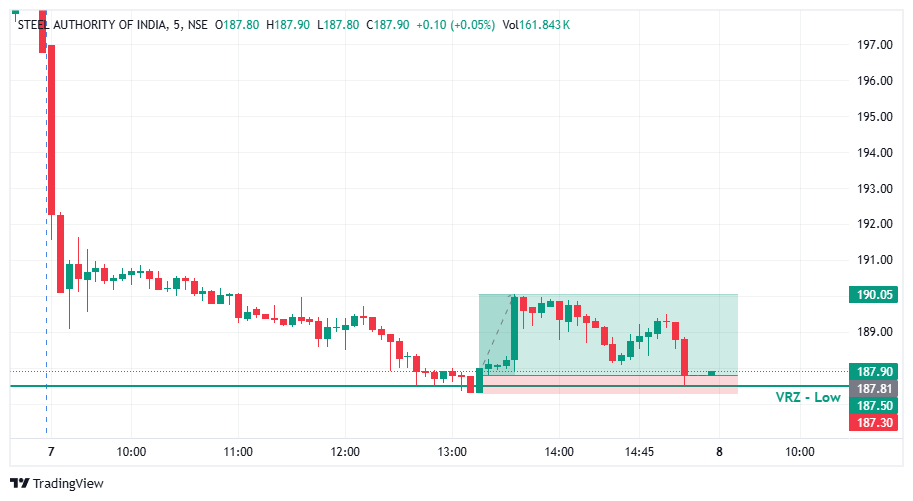

🔻 SAIL tested the VRZ Low, where sellers attempted to push price below the support zone.
🚨 The breakdown failed to sustain as price quickly recovered above the VRZ Low.
🟢 This recovery confirmed the Breakdown Failure (BOF) setup and created a bullish intraday opportunity.
🟢 Buyers stepped in after the failed breakdown and pushed price back above the key support level.
📊 The recovery from the ₹187.61 VRZ Low showed improving buying participation.
🚀 The setup eventually delivered a 1.19% bullish move with a strong 1:4 Risk-Reward.
🔴 Sellers: Attempted to extend the breakdown below the VRZ Low.
🟡 Breakdown Traders: Faced pressure as price quickly reclaimed the support zone.
🟢 Buyers: Regained control and initiated the bullish reversal.
🎭 The initial move below support created bearish expectations.
⚠️ However, the inability to sustain below the VRZ Low weakened seller confidence.
📈 The quick recovery shifted market control toward buyers and supported the upside reversal.
🎯 The important confirmation came when SAIL reclaimed and sustained above ₹187.61.
🔄 The failed breakdown signaled that selling pressure was losing strength.
⚡ Continued bullish follow-through validated the BOF setup.
🔸 🚫 Failed Breakdowns Can Trap Sellers
When price quickly reclaims support, bearish positions can come under pressure.
🔹 🎯 Support Reclaim Is Important
Moving back above the VRZ Low highlighted renewed buyer strength.
🛡️ Defined Risk Improves Trade Discipline
The VRZ Low provided a clear reference for managing risk.
⚡ Momentum Supports the Reversal
Once buyers regained control, the bullish move developed with stronger follow-through.
📈 After reclaiming the VRZ Low, SAIL began developing a more positive intraday structure.
🟢 Buyers maintained control as price moved away from the support zone.
🚀 The improving structure supported the continuation of bullish momentum.
🔥 Buying pressure increased following the failed breakdown.
📈 Price continued moving higher from the VRZ Low and strengthened the reversal.
🏆 The trade ultimately produced a 1.19% upside move with a 1:4 RR.
🔸 The setup became actionable after SAIL failed to sustain below the ₹187.61 VRZ Low.
📈 Buyers reclaimed the support zone and maintained bullish control.
⚖️ The confirmed BOF structure provided a disciplined intraday setup with defined risk.
