
Select a trading day to view all Scanner results, chart evidence, and market explanations.
6 Scanners Available
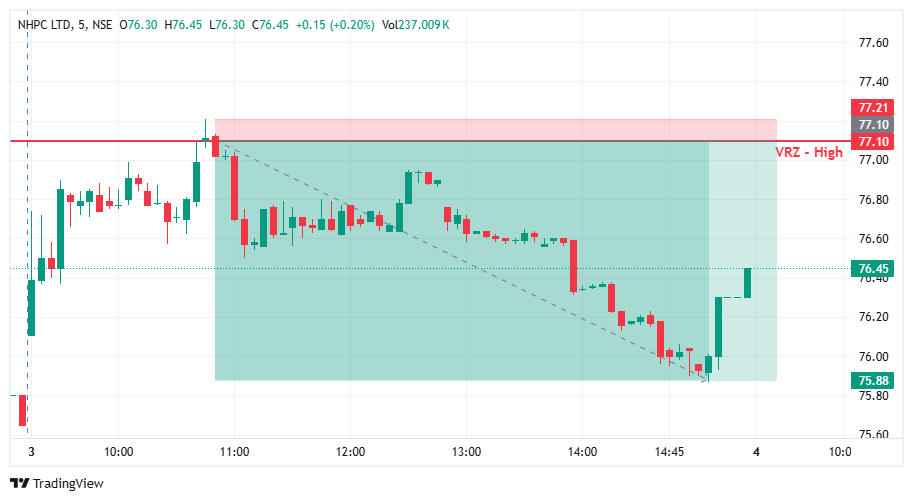

📈 NHPC briefly moved above the ₹77.10 VRZ High, creating the possibility of a bullish breakout continuation.
🔄 The breakout failed as price quickly slipped back below the resistance zone, signaling weakness.
📉 Sellers regained control, driving the stock progressively lower and confirming the bearish reversal.
😎 Buyers entering above the VRZ High expected the breakout to continue toward higher levels.
🔁 As price failed to sustain above the zone, breakout buyers became trapped and faced increasing downside pressure.
💪 The shift in sentiment strengthened selling momentum and supported the bearish BOF structure.
📍 The ₹77.10 VRZ High served as the primary reference level for the bearish BOF setup.
🛡️ The failed breakout established a clearly defined risk area around the resistance zone for structured trade management.
⚖️ Strong downside potential combined with controlled risk ultimately produced an impressive 1:11 Risk-to-Reward ratio.
🚨 Following the VRZ High rejection, NHPC developed sustained bearish momentum across the trading session.
📊 Selling pressure continued to build as price moved steadily lower, eventually reaching the ₹75.88 area.
🔥 The extended decline transformed the failed breakout into a highly successful bearish BOF opportunity.
💵 NHPC delivered a strong 1.58% bearish move following the VRZ High rejection.
🎯 The setup achieved an impressive 1:11 Risk-to-Reward ratio, highlighting the trade's substantial reward potential.
🏆 This result demonstrates how identifying failed breakouts near key VRZ resistance can create powerful downside opportunities.
🛡️ A breakout above resistance does not always result in bullish continuation when buyers fail to maintain control.
⚖️ The NHPC setup shows how a well-defined BOF structure can combine controlled risk with significant reward potential.
💡 Combining VRZ levels, breakout-failure confirmation, and price-action analysis can help identify high-potential reversal setups.
🌟 NHPC delivered a strong example of a Bearish BOF at the VRZ High, with the failed breakout setting the stage for a sustained decline.
🔍 The move above ₹77.10 failed, sellers regained control, and price continued toward the lower levels of the session.
🚀 With a 1.58% move and exceptional 1:11 RR, NHPC stands out as a powerful example of successful BOF-based intraday trading.

🔸 VRZ High: ₹77.10 — Major resistance area that set the stage for the breakout failure.
🟣 Setup: Bearish BOF — Failed breakout followed by a decisive bearish reversal.
⏱️ Time Frame: 5 Minutes — Intraday chart showcasing the complete setup development.
🔻 Move: 1.58% — Strong downside momentum after the VRZ High rejection.
🏅 Risk-to-Reward: 1:11 RR — Highly favorable reward potential relative to the defined risk.
🚀 Result: Successful Bearish BOF Setup — Clear VRZ High rejection triggered a powerful downside move.
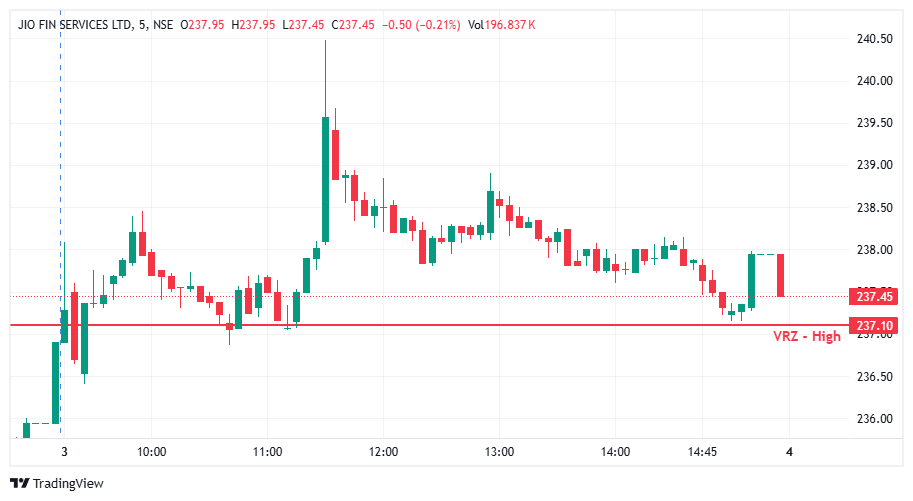

📈 JIOFIN traded above the ₹237.10 VRZ High for most of the session, showing that buyers were able to maintain control around the marked resistance zone.
🔄 Later in the session, price gradually moved back toward the VRZ High and tested the ₹237.10 area.
⚠️ This created the possibility of a bearish Breakout Failure (BOF) if price could break below the zone and establish sustained weakness.
❌ However, the expected bearish confirmation did not develop.
🟢 Instead, buyers defended the VRZ area and pushed price back toward the ₹238 region.
🚫 The potential BOF therefore failed to confirm.
The intraday structure provided several important clues:
🟢 Price remained largely above the VRZ High.
📈 Buyers maintained acceptance above ₹237.10.
🔻 A late-session decline brought price back toward the zone.
⚠️ The downside move lacked sustained continuation below ₹237.10.
🔄 Buyers responded around the reversal area.
📍 Price remained above the key ₹237.10 VRZ High.
The inability to establish sustained weakness below the VRZ kept the bearish BOF scenario invalid.
The potential bearish BOF scenario developed when JIOFIN returned toward the ₹237.10 VRZ High after trading at higher levels.
A confirmed setup would have required a clear rejection and sustained price acceptance below the VRZ.
Instead, the decline slowed near the zone and buyers managed to defend the level.
Price subsequently recovered toward ₹237.90–₹238.00, preventing the bearish BOF structure from becoming valid.
Therefore, the setup was invalidated without a confirmed short entry. ❌
The primary reason was the lack of decisive bearish follow-through below the ₹237.10 VRZ High.
❌ No sustained breakdown below ₹237.10.
❌ Sellers failed to maintain downside momentum.
🟢 Buyers defended the VRZ area.
📈 Price recovered after testing the zone.
⚠️ The broader structure remained above the reversal level.
🔄 The late decline did not transform into a confirmed bearish reversal.
These conditions weakened the probability of a successful bearish BOF setup.
The price action highlights an important BOF failure scenario.
📈 JIOFIN established strength above the VRZ High.
🔻 Price later retraced toward ₹237.10.
🟡 The VRZ became a key decision area.
🟢 Buyers absorbed the selling pressure around the zone.
🚀 Price recovered toward ₹238.
⚠️ The final red candle closed around ₹237.45, still above the ₹237.10 VRZ High.
This shows why a pullback toward the VRZ should not automatically be treated as a confirmed breakout failure.
🎯 Zone interaction is not confirmation.
A BOF requires a validated failure of the breakout structure.
🛡️ Respect the VRZ level.
The ₹237.10 zone remained an important reference throughout the setup.
🔍 Follow-through matters.
A bearish setup needs sustained selling below the reversal zone.
📊 Price acceptance provides the clue.
Holding above the VRZ suggests that buyers continue to have an advantage.
🚫 Avoid forced entries.
When confirmation is absent, staying out protects trading capital.
This JIOFIN setup demonstrates a crucial principle of Breakout Failure trading:
A potential BOF is only a possibility until price confirms it.
The stock returned toward the ₹237.10 VRZ High, creating an opportunity for a potential bearish reversal. However, sellers could not establish sustained control below the zone.
Instead, buyers defended the level and price recovered.
Disciplined traders focus on confirmation rather than prediction, allowing invalid setups to pass without forcing a trade.
Risk control remains a critical part of systematic BOF trading.
✔️ The ₹237.10 VRZ High served as the key reference level.
✔️ The bearish setup required confirmation below the zone.
✔️ No premature short position was required.
✔️ The invalidation prevented unnecessary exposure.
✔️ Capital remained protected for stronger confirmed opportunities.
Controlled decision-making is an important part of long-term trading consistency.
🌍 JIOFIN's price action shows how quickly a potential BOF can lose validity when the market refuses to confirm the expected reversal.
⚠️ The stock tested the ₹237.10 VRZ High, but sellers failed to produce sustained acceptance below the level.
🟢 Buyers defended the zone and pushed price back toward ₹238, keeping the bearish BOF scenario invalid.
🎯 The key lesson is simple: identify the zone, monitor the reaction, and rely on confirmation before treating a breakout as a failure.
🛡️ Strong trading discipline means recognizing invalid setups just as clearly as successful ones.
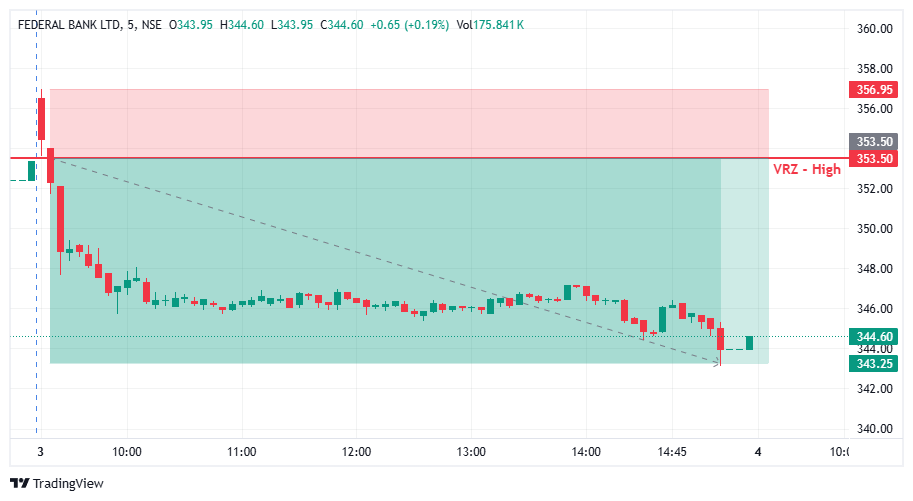

📈 FEDERAL BANK initially tested the ₹353.50 VRZ High, creating a potential breakout scenario.
🔄 However, buyers failed to maintain prices above the resistance zone, resulting in a sharp rejection.
📉 Price then moved lower and continued trading below the VRZ High, confirming the bearish reversal.
😎 Buyers entering above the VRZ High expected further upside.
🔁 When price failed to hold the breakout and moved back below the level, the failed breakout trapped buyers.
💪 Sellers gained momentum as the breakout failure encouraged further downside movement.
📍 The ₹353.50 VRZ High acted as the key reference level for the bearish BOF setup.
🛡️ The rejection provided a structured risk zone above the failed breakout area.
⚖️ With defined risk and strong downside potential, the setup achieved a 1:3 Risk-to-Reward.
🚨 After rejecting the VRZ High, FEDERAL BANK maintained a bearish price structure.
📊 Selling pressure continued throughout the session, pushing the stock toward the ₹343.25 region.
🔥 The sustained decline transformed the failed breakout into a successful bearish BOF move.
💵 FEDERAL BANK delivered a strong 2.90% bearish move from the BOF setup.
🎯 The trade achieved a 1:3 Risk-to-Reward ratio.
🏆 This setup demonstrates the potential of identifying failed breakouts near key VRZ resistance levels.
🛡️ A breakout above resistance does not always lead to continuation.
⚖️ When buyers fail to sustain the breakout and price returns below the VRZ High, the setup can quickly shift in favor of sellers.
💡 FEDERAL BANK highlights how VRZ levels, breakout failure, price action, and disciplined risk management can combine to create a structured intraday opportunity.
🌟 FEDERAL BANK delivered a strong example of a Bearish BOF at VRZ High.
🔍 The breakout attempt above ₹353.50 failed, sellers took control, and price continued lower.
🚀 With a 2.90% move and 1:3 RR, this setup stands out as a successful BOF trading example.
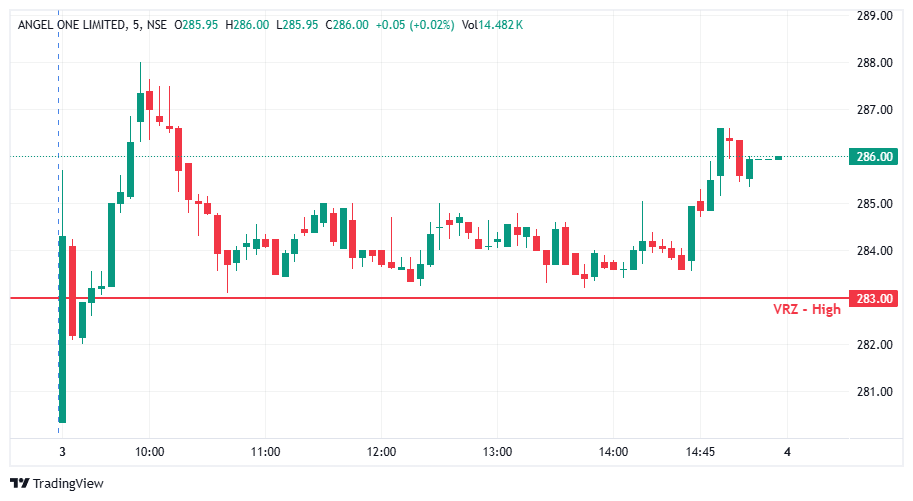

ANGELONE opened with volatile price action around the ₹283.00 VRZ High.
Price initially moved above the reversal zone and later experienced a pullback, creating the possibility of a bearish BOF setup.
However, sellers failed to establish sustained downside momentum below the key zone. Price stabilized above ₹283.00 and gradually regained bullish strength.
📈 Buyers maintained price above the VRZ High.
⚠️ The pullback lacked strong bearish continuation.
🔄 Price consolidated around ₹283–₹285.
🟢 Higher levels were gradually reclaimed.
🚀 Strong buying emerged later in the session.
The developing structure weakened the bearish BOF expectation.
The potential short setup depended on a clear rejection from the ₹283.00 VRZ High followed by sustained bearish continuation.
Instead, price remained supported above the reversal zone.
As sellers failed to push price decisively lower, the bearish thesis lost strength. The later bullish expansion toward ₹286+ confirmed that buyers had regained control.
The main failure was the absence of sustained selling pressure below the VRZ High.
❌ Weak bearish follow-through.
⚠️ Price continued holding above ₹283.00.
🔄 Consolidation developed instead of a strong reversal.
📈 Buyers gradually created higher levels.
🚀 Late-session bullish momentum invalidated the bearish expectation.
📈 Price initially pushed above the VRZ High.
🔻 Sellers attempted to generate a reversal.
⚠️ The decline failed to develop into a sustained bearish move.
🔄 Price consolidated around the reversal zone.
🟢 Buyers eventually produced a strong upward expansion.
📊 The move toward ₹286 showed that the expected bearish reversal had lost its edge.
⚠️ A rejection near VRZ High alone does not confirm a bearish BOF.
📍 Sustained movement below the reversal zone is important for bearish confirmation.
🔍 Consolidation above VRZ High can indicate that buyers are still defending the breakout.
🎯 Waiting for confirmation helps avoid premature short entries.
🛡️ Risk control remains essential whenever the expected reversal fails.
🎯 Not every breakout above resistance will result in a successful failure.
📊 Traders must allow price action to confirm the reversal.
🚫 Avoid forcing a short bias when sellers cannot sustain control.
🧘 Professional execution means accepting invalidation and moving on without emotional decisions.
🛡️ Define the invalidation level before entering.
📌 Use the VRZ High as the primary structural reference.
⛔ Exit when the expected bearish continuation fails.
💰 Controlled losses protect capital for stronger future setups.
🌍 The ANGELONE BOF Failure highlights an important BOF principle: a breakout rejection needs sustained bearish confirmation to become a valid reversal.
⚠️ In this setup, sellers could not establish convincing downside momentum below the ₹283.00 VRZ High.
📈 Price instead stabilized above the zone and later accelerated higher, showing renewed buyer strength.
💪 Follow confirmed price action, respect risk, and never force a reversal that the market has not confirmed.
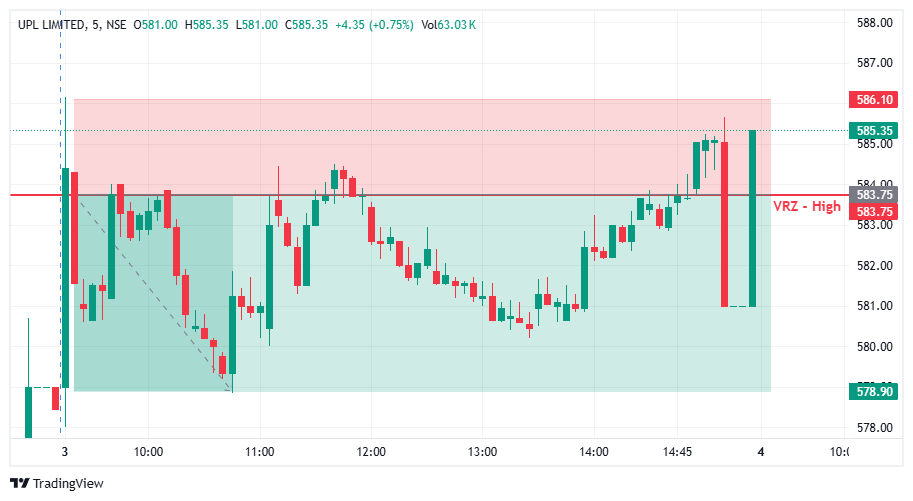

🔺 UPL moved higher and approached the ₹583.75 VRZ High.
⚠️ Buyers attempted to push price above the key resistance, but the breakout failed to sustain.
🔴 Strong selling pressure emerged near the VRZ High, forcing price back below the resistance.
📉 Subsequent candles showed increasing bearish momentum as sellers gained control.
🔄 The failed breakout trapped late buyers and created the conditions for a bearish reversal.
🎯 Price continued lower toward the ₹578.90 downside area.
🚀 The successful BOF setup delivered a 0.83% bearish move with a 1:2 RR.
🔎 Price gradually advanced toward the VRZ High after earlier consolidation.
🟢 Buyers attempted to establish control above ₹583.75.
⚠️ The breakout lacked sustained buying follow-through.
🔴 Sellers responded with a sharp rejection from the resistance zone.
📉 Price slipped lower as bearish pressure increased.
🔄 The rejection confirmed the Breakout Failure structure.
🎯 Continued selling pressure carried UPL toward the projected downside objective.
Initially, traders could have expected:
🟢 A confirmed breakout above ₹583.75.
📈 Further upside continuation.
🐂 Buyers to remain in control.
But the market quickly changed the narrative.
⚠️ The breakout failed to hold.
😰 Breakout buyers became trapped near the resistance.
🔴 Sellers stepped in aggressively around the VRZ High.
🔄 Trapped buyers began exiting as price moved lower.
📉 Fresh selling pressure accelerated the bearish reversal.
🟢 Buyers pushed toward the ₹583.75 VRZ High.
🔴 Sellers strongly defended the resistance zone.
⚖️ Price struggled to sustain higher levels.
⚠️ Failure to hold above the VRZ High weakened the bullish breakout.
🔄 Price reversed back below the key level.
📉 Sellers gradually took control and extended the downside move.
🎯 The bearish momentum carried UPL toward ₹578.90.
🎯 VRZ High Rejection
The ₹583.75 VRZ High acted as a strong resistance area where sellers emerged.
⚡ Breakout Lost Momentum
Buyers failed to maintain sustained strength above the key zone.
🚨 Bearish Reversal Confirmed
Price moved back below the VRZ High, confirming the failed breakout.
📉 Sellers Took Control
Follow-through selling created a clear bearish price structure.
🔒 Defined Risk
The ₹586.10 area provided a clear invalidation reference above the failed breakout.
💰 Strong Reward-to-Risk
The successful BOF setup delivered a 0.83% downside move with a 1:2 RR.
📈 Before Rejection: Buyers pushed UPL toward the VRZ High.
⚠️ At the Zone: Price attempted a breakout above ₹583.75, but failed.
🔴 After Rejection: Sellers regained control and pushed price lower.
📉 Confirmation: Bearish candles reinforced the reversal.
🎯 Final Move: Price declined toward the ₹578.90 downside objective.
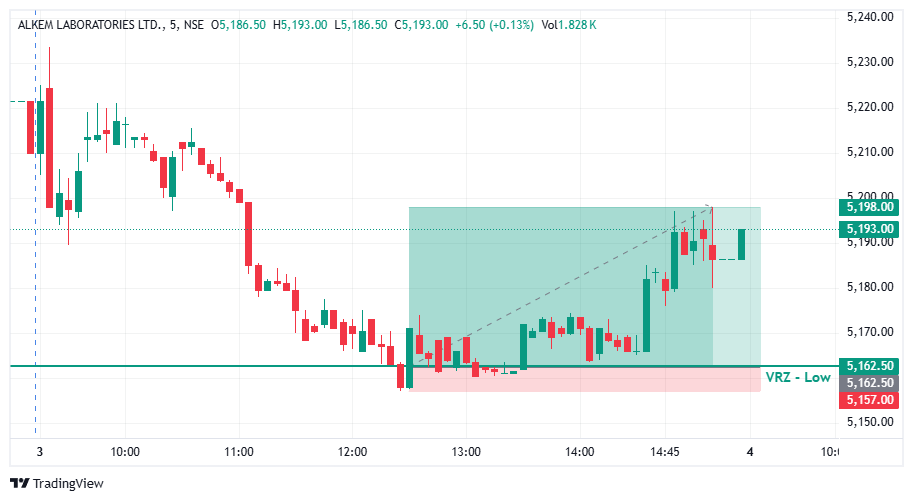

📉 ALKEM experienced a prolonged intraday decline before reaching the ₹5,162.50 VRZ Low.
🔄 Price briefly broke below the zone, but the breakdown lacked follow-through as buyers stepped in.
📈 The subsequent recovery above the VRZ Low shifted momentum from sellers to buyers.
😰 Sellers entering below the VRZ Low expected continued downside.
🔁 When price reclaimed the level, the failed breakdown created pressure on those short positions.
💪 Fresh buying momentum then supported the bullish reversal and pushed ALKEM toward higher levels.
📍 The ₹5,162.50 VRZ Low provided the key reference level for the bullish BOF setup.
🛡️ The risk zone was clearly defined below the reversal area, with the chart showing ₹5,157 as the downside reference.
📊 This structured setup created an attractive 1:6 Risk-to-Reward opportunity.
🚀 After reclaiming the VRZ Low, ALKEM began forming stronger bullish price action.
🔥 Buying momentum accelerated during the later part of the session, taking price toward the ₹5,198 target zone.
🏆 The failed breakdown successfully transformed into a strong intraday bullish move.
💵 ALKEM Laboratories delivered a 0.69% bullish move from the BOF setup.
🎯 The trade achieved an impressive 1:6 Risk-to-Reward ratio.
📈 This result highlights the potential of combining VRZ levels, breakout failure, price-action confirmation, and disciplined risk management.
🛡️ A breakdown below a key support zone does not always lead to further downside.
⚖️ When sellers fail to sustain the breakdown and price reclaims the VRZ Low, the failed move can create a powerful reversal opportunity.
💡 The ALKEM setup demonstrates how a well-structured BOF can offer a defined risk area with significant reward potential.
🌟 ALKEM Laboratories delivered a textbook example of a Bullish BOF at VRZ Low.
🔍 The breakdown below ₹5,162.50 failed, buyers reclaimed the level, and momentum shifted strongly to the upside.
🥇 With a 0.69% move and 1:6 RR, this setup stands out as a successful example of BOF-based intraday price action.
