
Select a trading day to view all Scanner results, chart evidence, and market explanations.
7 Scanners Available
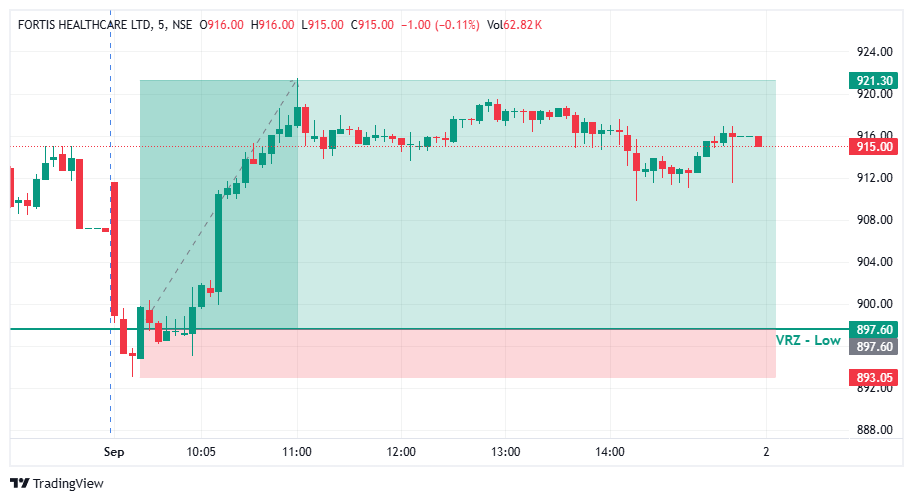

📉 FORTIS Healthcare initially experienced strong selling pressure, pushing price below the ₹897.60 VRZ Low.
🔄 After the breakdown, buyers stepped in and absorbed the selling pressure, resulting in a sharp recovery.
📈 Price then reclaimed the VRZ Low and continued forming higher price levels, confirming the strength of the bullish reversal.
😰 Sellers who entered during the breakdown expected further downside below the VRZ Low.
🔁 When price quickly recovered above the level, the failed breakdown put pressure on those short positions.
💪 At the same time, fresh buying momentum developed above the reclaimed VRZ Low, helping accelerate the bullish move.
📍 The ₹897.60 VRZ Low acted as the key reference level for the BOF setup.
🛡️ The chart structure provided a defined risk area below the reversal zone while allowing the trade to participate in the upside momentum.
📊 This combination of a clear reversal level and controlled risk created an attractive risk-to-reward opportunity.
🚀 Following the VRZ Low rejection, FORTIS Healthcare moved steadily higher.
🔥 Strong bullish candles pushed price toward the ₹915–₹920 region, demonstrating continued buying interest.
🏆 The sustained recovery transformed the initial failed breakdown into a successful bullish intraday BOF move.
💵 FORTIS Healthcare delivered a 2.64% price move following the bullish BOF setup.
🎯 The trade achieved an impressive 1:5 Risk-to-Reward (RR) outcome.
📈 The result highlights how a failed breakdown near a key VRZ Low can create significant upside potential when supported by strong price-action momentum.
🛡️ The BOF setup offered a structured approach by defining the VRZ Low as the primary reference level.
⚖️ Maintaining disciplined risk management is essential because not every breakout failure develops into a successful reversal.
📚 The FORTIS Healthcare setup demonstrates the importance of combining price structure, breakout failure, confirmation, and risk-to-reward planning.
🌟 FORTIS Healthcare provided a strong example of a Bullish Breakout Failure at VRZ Low.
🔍 The breakdown below ₹897.60 failed, buyers reclaimed the level, and bullish momentum carried the stock toward higher prices.
🚀 With a 2.64% move and 1:5 RR, this BOF setup demonstrates the potential of structured VRZ-based price-action analysis.
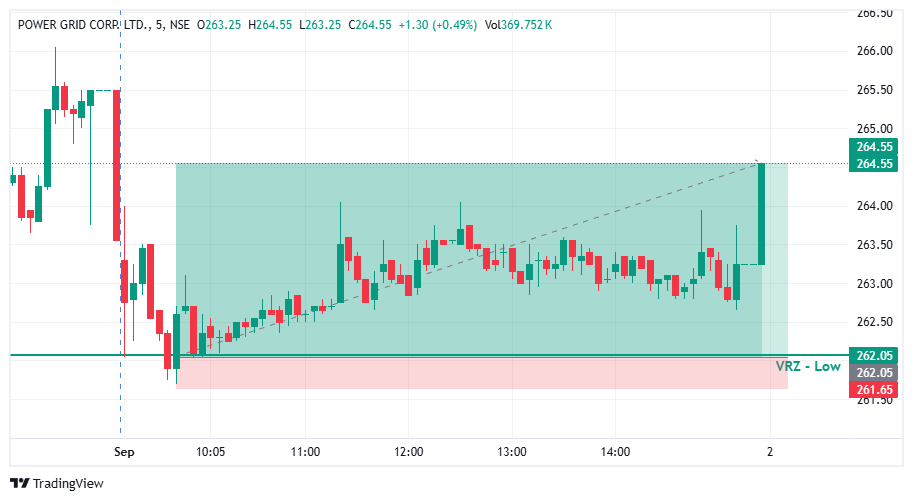

🔻 POWERGRID initially faced selling pressure and moved toward the ₹262.05 VRZ Low.
⚠️ Sellers pushed price below the key support area, creating a potential bearish breakdown.
🔄 The breakdown failed as buyers defended the VRZ Low and reclaimed the support zone.
🟢 Buying pressure gradually increased after the rejection.
📈 Price formed a series of higher highs and higher lows, confirming improving bullish momentum.
🎯 The recovery eventually pushed POWERGRID toward the ₹264.55 upside area.
🚀 The successful BOF setup delivered a 0.95% bullish move with an impressive 1:6 RR.
🔎 Price stabilized around the VRZ Low after the initial decline.
🔴 Sellers attempted to maintain control below ₹262.05.
⚠️ The breakdown failed to attract sustained selling pressure.
🟢 Buyers reclaimed the key VRZ Low and started building a stronger price structure.
📈 Subsequent candles showed gradual accumulation and improving momentum.
⚡ The bullish structure remained intact as price moved toward higher levels.
🎯 POWERGRID ultimately reached the projected upside zone around ₹264.55.
Initially, traders could have expected:
🔴 A confirmed breakdown below ₹262.05.
📉 Further downside continuation.
🐻 Sellers to remain in control.
But the market quickly changed the narrative.
⚠️ The breakdown failed to sustain.
😰 Breakdown sellers became trapped below the VRZ Low.
🟢 Buyers reclaimed the key support area.
🔄 Trapped sellers were forced to exit as price recovered.
📈 Fresh buying pressure strengthened the bullish reversal.
🚀 The failed breakdown transformed into a successful bullish BOF setup.
🔴 Sellers attempted to break ₹262.05 support.
🟢 Buyers strongly defended the VRZ Low.
⚖️ Price consolidated around the zone as both sides battled for control.
⚠️ Sellers failed to sustain the breakdown.
🔄 The reclaim of the VRZ Low shifted momentum toward buyers.
📈 Buyers gradually strengthened their control and pushed price higher.
🎯 The sustained recovery carried POWERGRID toward the ₹264.55 upside area.
🎯 VRZ Low Held Firm
The ₹262.05 VRZ Low acted as a strong support area where buyers stepped in.
⚡ Breakdown Lost Momentum
Sellers failed to maintain price below the key support.
🚨 Bullish Reclaim Confirmed
Price recovered above the VRZ Low, confirming the failed breakdown.
📈 Bullish Structure Developed
Higher highs and higher lows demonstrated improving buyer control.
🔒 Defined Risk
The ₹261.65 area provided a clear risk-control reference below the setup.
💰 Strong Reward-to-Risk
The successful BOF setup delivered a 0.95% bullish move with a 1:6 RR.
🔴 Initial Phase: Sellers pushed POWERGRID toward the VRZ Low.
⚠️ Breakdown Attempt: Price moved below ₹262.05, but sellers failed to sustain control.
🟢 Reclaim: Buyers recovered above the VRZ Low and changed the market structure.
📊 Confirmation: Higher highs and higher lows reinforced the bullish setup.
🚀 Final Phase: Price advanced toward the ₹264.55 upside objective.

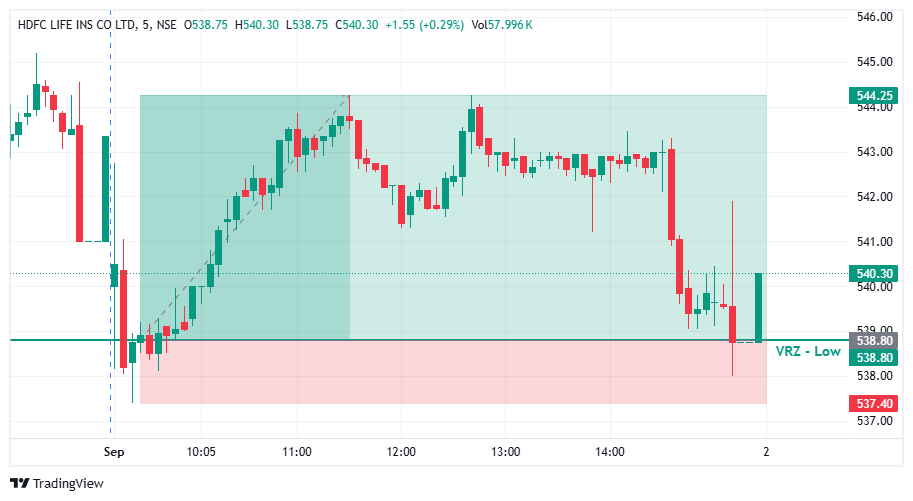

🔻 HDFCLIFE initially moved lower and tested the ₹538.80 VRZ Low.
⚠️ Sellers pushed price below the key support area, creating a potential bearish breakdown.
🔄 The breakdown failed as buyers quickly reclaimed the VRZ Low.
🟢 Strong buying interest emerged around the support zone, shifting momentum back toward the upside.
📈 Price developed a bullish structure and moved higher toward the ₹544.25 upside objective.
🎯 The successful BOF setup delivered a 1.01% bullish outcome with a solid 1:4 RR.
🔎 Price approached the VRZ Low after an extended period of price movement.
🔴 Sellers attempted to establish control below ₹538.80.
⚠️ The breakdown failed to attract sustained selling pressure.
🟢 Buyers defended the zone and pushed price back above the VRZ Low.
🔄 The reclaim confirmed the Breakout Failure setup.
📊 Buying momentum strengthened as price moved toward higher levels.
🚀 HDFCLIFE eventually advanced toward the projected ₹544.25 target area.
Initially, traders could have expected:
🔴 A confirmed breakdown below ₹538.80.
📉 Further downside continuation.
🐻 Sellers to remain in control.
But the market quickly changed the narrative.
⚠️ The breakdown failed to sustain.
😰 Breakdown sellers became trapped below the VRZ Low.
🟢 Buyers reclaimed the key support level.
🔄 Trapped sellers were forced to exit as price moved higher.
📈 Fresh buying pressure strengthened the bullish reversal.
🚀 The failed breakdown transformed into a successful bullish BOF setup.
🔴 Sellers attempted to push HDFCLIFE below ₹538.80.
🟢 Buyers strongly defended the VRZ Low.
⚖️ The battle intensified around the key support zone.
⚠️ Failure to sustain below support weakened the bearish breakdown.
🔄 Price reclaimed the VRZ Low and confirmed bullish intent.
📈 Buyers gradually took control and pushed price higher.
🎯 The sustained reversal carried HDFCLIFE toward the upside objective.
🎯 VRZ Low Held Firm
The ₹538.80 VRZ Low acted as a strong demand zone where buyers stepped in.
⚡ Breakdown Lost Momentum
Sellers failed to maintain price below the key support.
🚨 Bullish Reclaim Confirmed
Price recovered above the VRZ Low, confirming the failed breakdown.
📈 Buyers Took Control
The subsequent bullish price action showed strengthening buying momentum.
🔒 Defined Invalidation
The ₹537.40 area provided a clear risk-control reference below the failed breakdown.
💰 Strong Reward-to-Risk
The successful BOF setup delivered a 1.01% upside outcome with a 1:4 RR.
🔴 Before Rejection: Sellers pushed HDFCLIFE toward the VRZ Low.
⚠️ At the Zone: Price broke below ₹538.80, but the breakdown failed.
🟢 After Rejection: Buyers reclaimed the VRZ Low and reversed the bearish momentum.
📈 Confirmation: Bullish candles supported the recovery toward higher levels.
🎯 Final Move: Price advanced toward the ₹544.25 upside objective.
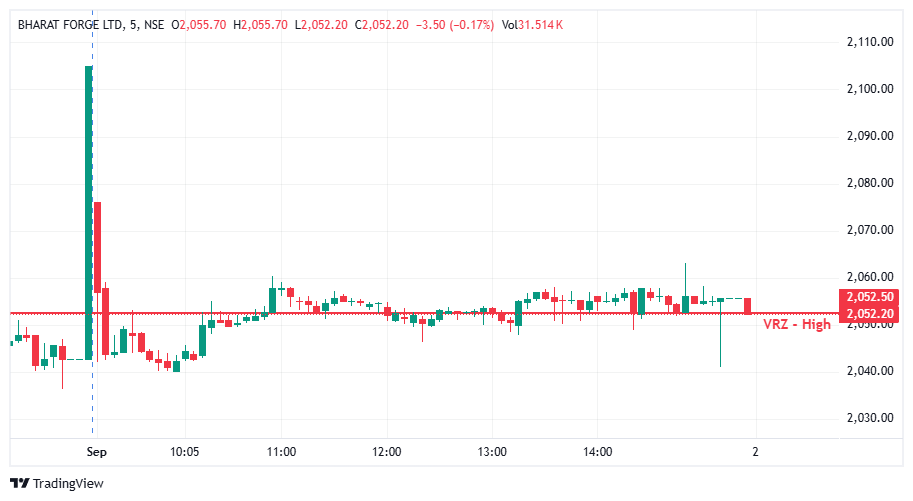

BHARATFORG traded around the ₹2,052.50 VRZ High for most of the session.
Price briefly moved above the reversal zone, creating the conditions for a potential bearish Breakout Failure setup. However, sellers were unable to generate strong downside continuation after the rejection.
Instead, price continued consolidating around the VRZ High, keeping the bearish reversal under pressure.
📈 Buyers repeatedly defended the area around ₹2,052.50.
⚠️ The breakout rejection lacked strong bearish expansion.
🔄 Price remained range-bound around the VRZ High.
📉 Sellers failed to establish a clear lower-low structure.
🟢 The absence of sustained selling reduced the probability of a successful BOF short.
The bearish BOF setup was considered after price moved above the ₹2,052.50 VRZ High and showed signs of rejection.
However, the expected downside move did not develop with sufficient strength.
Price continued to hold close to the reversal zone instead of accelerating lower. Without decisive bearish follow-through, the BOF setup lost momentum and eventually failed.
This highlights why a breakout rejection alone should not be treated as confirmation of a bearish reversal.
The setup failed primarily because sellers could not sustain control after the breakout rejection.
The stock remained close to the VRZ High, while repeated attempts to push lower lacked meaningful continuation.
❌ Weak selling pressure after the rejection.
⚠️ Price repeatedly held near the VRZ High.
🔄 No decisive bearish breakdown followed.
📊 Consolidation replaced the expected reversal move.
🟢 Buyers continued defending the ₹2,052.50 area.
The chart shows a breakout attempt followed by an unsuccessful bearish reversal.
🚀 Price pushed above the VRZ High.
🔻 Sellers attempted to reject the breakout.
⚠️ The rejection failed to produce sustained downside momentum.
🔄 Price consolidated around ₹2,052–₹2,055.
📌 The lack of strong bearish continuation weakened the BOF thesis.
⚠️ A rejection above VRZ High does not automatically confirm a bearish BOF.
📊 Strong downside follow-through is essential after the rejection.
🔍 Continued consolidation near the reversal zone can signal indecision rather than reversal.
🎯 Waiting for confirmation helps avoid low-quality short entries.
🛡️ Risk management remains essential when price refuses to follow the expected direction.
A failed BOF is part of systematic trading.
✅ Not every rejection develops into a reversal.
✅ The market can remain indecisive even after a breakout failure.
✅ Traders should avoid forcing a bearish view when follow-through is missing.
✅ Discipline means accepting when the setup loses its edge.
🛡️ Define risk before entering the trade.
📍 Use the VRZ High as a key reference for setup validation.
🚫 Avoid holding a short position simply because a rejection occurred.
📉 Exit when the expected bearish momentum fails to materialize.
💰 Protecting capital keeps traders ready for the next high-quality setup.
🌍 BHARATFORG demonstrated why breakout rejection and breakout failure are not the same as confirmed reversal.
⚠️ Although price moved around the ₹2,052.50 VRZ High, sellers failed to produce sustained downside momentum.
📊 The continued consolidation near the reversal zone weakened the bearish BOF setup.
🛡️ Professional trading requires patience, confirmation, and disciplined risk management rather than anticipating every reversal.
💪 Trust the setup, wait for confirmation, and let price action validate the trade.
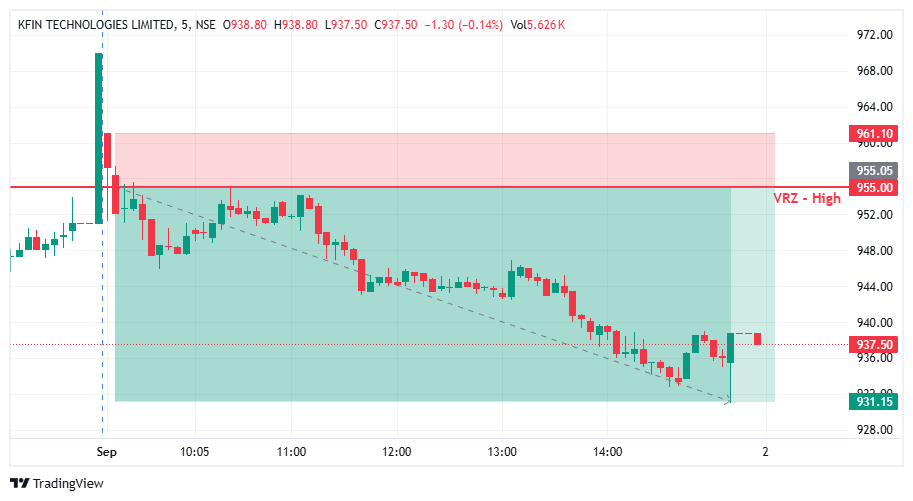

📈 The KFINTECH price action approached the ₹955 VRZ High, creating a key resistance zone where sellers could defend the level.
🔍 The BOF setup identified the failure around VRZ High, as price struggled to sustain bullish momentum above the resistance area.
📉 This rejection created a strong bearish opportunity as selling pressure started building below the VRZ High.
📍 After testing the ₹955 resistance, KFINTECH failed to maintain strength above the VRZ High.
🔻 The rejection shifted the short-term market structure in favor of sellers, with consecutive bearish candles driving price lower.
⚡ The failure to sustain the breakout became the key signal behind the bearish BOF setup.
📐 The setup offered a clearly defined risk zone around the ₹955 VRZ High, while the upside invalidation level was marked near ₹961.10.
📉 As selling pressure increased, the downside objective extended toward ₹931.15, creating a favorable risk-to-reward structure.
🛡️ Risk: ₹955 → ₹961.10
🎯 Downside Target: ₹931.15
🏆 Risk-to-Reward: 1:4
🔻 Following the VRZ High rejection, KFINTECH continued to form a bearish intraday structure.
📉 Price gradually moved lower from the ₹955 zone, with sellers maintaining control across multiple candles.
🔥 The decline eventually reached the ₹931.15 area, producing a 2.50% bearish move from the setup level.
🔹 Clear rejection from VRZ High ₹955
🔻 Failure to sustain the bullish breakout
📉 Increasing bearish price momentum
⚡ Strong downside continuation after the rejection
🛡️ Clearly defined stop-loss and target levels
🏆 Attractive 1:4 risk-to-reward opportunity
📐 A structured BOF setup allows traders to define the invalidation point before entering the trade.
🛑 For KFINTECH, the ₹961.10 level provided a clear risk reference, while the move toward ₹931.15 delivered substantial downside potential.
🏆 This resulted in a strong 1:4 RR outcome while keeping the trade structure clearly defined.
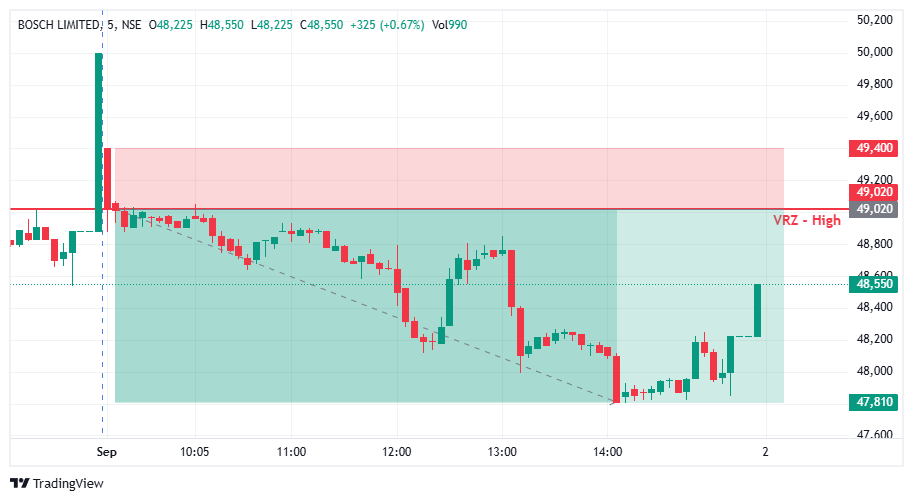

🔺 BOSCHLTD initially moved higher and approached the ₹49,020 VRZ High.
⚠️ Buyers attempted to sustain price around the key resistance, but the bullish breakout failed to develop.
🔴 Selling pressure emerged near the VRZ High, pushing price back below the resistance zone.
📉 Subsequent candles showed increasing bearish pressure as sellers gradually gained control.
🔄 The failed breakout trapped buyers near the resistance and created the conditions for a bearish reversal.
🎯 Price continued lower from the VRZ High and eventually reached the ₹47,810 downside zone.
🚀 The successful BOF setup delivered a 2.47% bearish outcome with a 1:3 RR.
🔎 Price consolidated near the ₹49,020 VRZ High after the initial bullish attempt.
🟢 Buyers tried to hold higher levels around the resistance.
⚠️ The breakout failed to attract sustained buying follow-through.
🔴 Sellers gradually increased their pressure below the VRZ High.
📉 Price developed a clear bearish structure with lower highs and lower lows.
🔄 As momentum shifted, selling pressure accelerated throughout the session.
🎯 BOSCHLTD eventually moved toward the ₹47,810 downside objective.
Initially, traders could have expected:
🟢 A confirmed breakout above ₹49,020.
📈 Further upside continuation.
🐂 Buyers to remain in control.
But the market quickly changed the narrative.
⚠️ The breakout failed to sustain.
😰 Buyers who entered near the resistance became trapped.
🔴 Sellers stepped in as price slipped below the VRZ High.
🔄 Trapped buyers began exiting their positions.
📉 Fresh selling pressure strengthened the bearish momentum.
🚀 The failed breakout ultimately transformed into a successful bearish BOF setup.
🟢 Buyers attempted to establish control around ₹49,020.
🔴 Sellers strongly defended the VRZ High.
⚖️ Price struggled to maintain bullish momentum above the key zone.
⚠️ Failure to sustain higher prices weakened the breakout attempt.
🔄 Price moved lower and confirmed the Breakout Failure.
📉 Sellers gradually took control and extended the downside.
🚀 The combination of trapped buyers and fresh selling pressure drove BOSCHLTD toward the downside target.
🎯 VRZ High Rejection
The ₹49,020 VRZ High acted as a key resistance area where sellers emerged.
⚡ Breakout Lost Momentum
Buyers failed to maintain sustained strength around the resistance.
🚨 Bearish Rejection Confirmed
Price moved back below the VRZ High, confirming the failed breakout.
📉 Sellers Took Command
Continued bearish price action established stronger downside momentum.
🔒 Defined Invalidation
The ₹49,400 area provided a clear reference above the failed breakout zone.
💰 Controlled Risk, Strong Reward
The successful BOF setup delivered a 2.47% downside outcome with a 1:3 RR.
📈 Before Rejection: Buyers pushed BOSCHLTD toward the VRZ High.
⚠️ At the Zone: Price tested the ₹49,020 resistance, but the breakout failed.
🔴 After Rejection: Sellers regained control and pushed price lower.
📉 Confirmation: Lower highs and lower lows reinforced the bearish structure.
🎯 Final Move: Price declined toward the ₹47,810 downside objective.

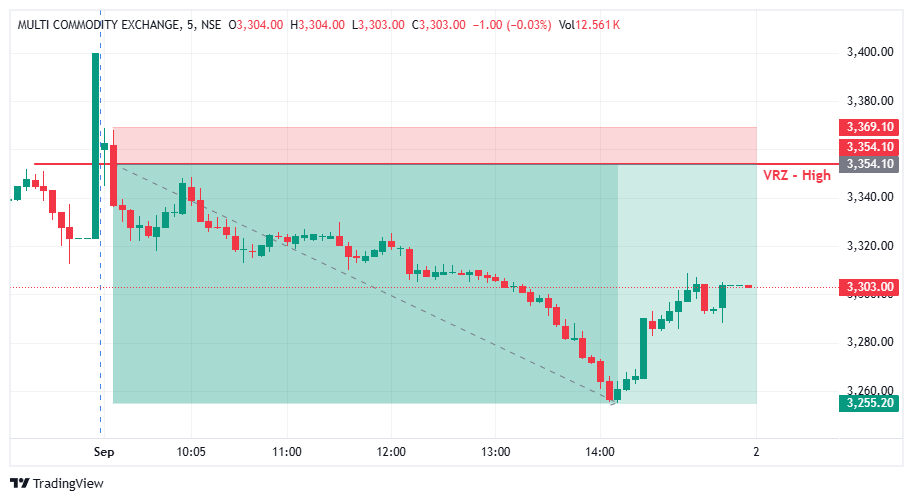

🔺 MCX initially moved higher and approached the ₹3,354.10 VRZ High.
⚠️ Buyers attempted to push price above the key resistance zone, but the breakout failed to sustain.
🔴 Strong selling pressure emerged near the VRZ High, forcing price back below the resistance.
📉 Subsequent candles showed increasing bearish pressure as sellers gradually took control.
🔄 The failed breakout trapped late buyers and created the conditions for a bearish reversal.
🎯 Price continued lower from the VRZ High and moved toward the ₹3,255.20 downside zone.
🚀 The successful BOF setup delivered a 2.95% bearish outcome with a strong 1:6 RR.
🔎 Price approached the VRZ High after an initial bullish attempt.
🟢 Buyers pushed toward the ₹3,354.10 resistance area.
⚠️ The breakout failed to attract sustained buying follow-through.
🔴 Sellers responded with increasing pressure near the zone.
📉 Price gradually moved lower and established a bearish structure.
🔄 Lower highs and lower lows reinforced the failed breakout.
🎯 Selling pressure accelerated as MCX moved toward the projected downside objective.
Initially, traders could have expected:
🟢 A confirmed breakout above the VRZ High.
📈 Further upside continuation.
🐂 Buyers to remain in control.
But the market quickly changed the narrative.
⚠️ The breakout failed to hold.
😰 Breakout buyers became trapped near higher levels.
🔴 Sellers stepped in and pushed price back below the resistance.
🔄 Trapped buyers started exiting their positions.
📉 Fresh selling pressure strengthened the bearish momentum.
🚀 The failed breakout ultimately transformed into a successful bearish BOF setup.
🟢 Buyers attempted to establish control above the resistance.
🔴 Sellers strongly defended the ₹3,354.10 VRZ High.
⚖️ The battle intensified around the key resistance zone.
⚠️ Failure to sustain higher prices weakened bullish momentum.
🔄 Price returned below the VRZ High, confirming the breakout failure.
📉 Sellers gradually gained control and extended the downside move.
🚀 Trapped buyers combined with fresh selling pressure to drive MCX lower.
🎯 VRZ High Rejection
The ₹3,354.10 VRZ High acted as a strong resistance area where sellers stepped in.
⚡ Breakout Lost Momentum
Price attempted to move above resistance but failed to sustain the bullish breakout.
🚨 Bearish Rejection Confirmed
The move back below the VRZ High signaled that buyers had lost control.
📉 Sellers Took Command
Continued bearish candles confirmed the shift from bullish to bearish momentum.
🔒 Defined Risk
The failed breakout provided a clear invalidation reference above the resistance area.
💰 Strong Risk-Reward
The successful bearish BOF delivered a 2.95% downside outcome with a 1:6 RR.
📈 Before Rejection: Buyers pushed MCX toward the VRZ High.
⚠️ At the Zone: Price tested the ₹3,354.10 resistance, but the breakout failed.
🔴 After Rejection: Sellers reclaimed control and pushed price lower.
📉 Confirmation: Continued lower prices reinforced the bearish reversal.
🎯 Final Move: MCX moved toward the ₹3,255.20 downside zone.