
Select a trading day to view all Scanner results, chart evidence, and market explanations.
4 Scanners Available
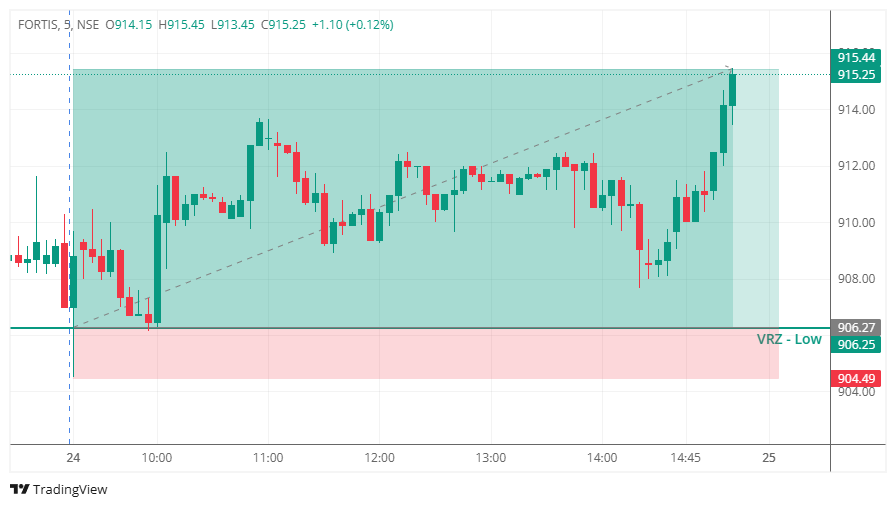

📉 FORTIS approached the previously identified VRZ Low during the trading session and briefly moved below the support zone, creating the appearance of a potential bearish breakdown.
⚠️ However, the breakdown failed to sustain.
🔄 After slipping below the VRZ Low around 906.25, price quickly reclaimed the support zone, confirming a Breakout Failure (BOF) setup. This rejection of lower levels indicated that sellers were unable to maintain control.
🐂 The failed breakdown trapped aggressive sellers and shifted short-term momentum back toward the buyers.
📈 Following the confirmation, FORTIS gradually strengthened and continued higher, eventually reaching the predefined upside target near 915.25. 🎯
🏆 The setup delivered an impressive 1.01% intraday move while achieving an excellent 1:5 Risk-Reward, highlighting the effectiveness of waiting for BOF confirmation before entering the trade. 💯
Initially, many traders expected:
Instead, the market showed strong rejection.
🔄 Once price reclaimed the VRZ Low:
When price breaks below a significant support zone but fails to sustain the move, trapped sellers can become fuel for a bullish reversal.
The setup became valid only after price reclaimed the VRZ Low. Waiting for confirmation helped avoid entering prematurely and provided a more reliable BOF trade.
The setup offered a clearly defined invalidation level below the VRZ Low and a predefined upside target, resulting in an excellent 1:5 Risk-Reward. 💯
Instead of assuming that the support breakdown would continue, the rejection and recovery around the VRZ Low revealed that buyers were stepping back into control.
This FORTIS trade demonstrates the power of a Breakout Failure (BOF) setup at a key support zone. 📊
Although sellers initially pushed price below the VRZ Low, they failed to sustain the breakdown. The quick recovery above the zone trapped bearish participants and created a clear opportunity for buyers.
🚀 Once the BOF was confirmed, price followed through toward the predefined target, delivering a 1.01% intraday move with an impressive 1:5 Risk-Reward.
💡 The key lesson is simple: Don't chase a breakdown. Wait for the failure, confirm the reclaim, and let price action lead the trade.
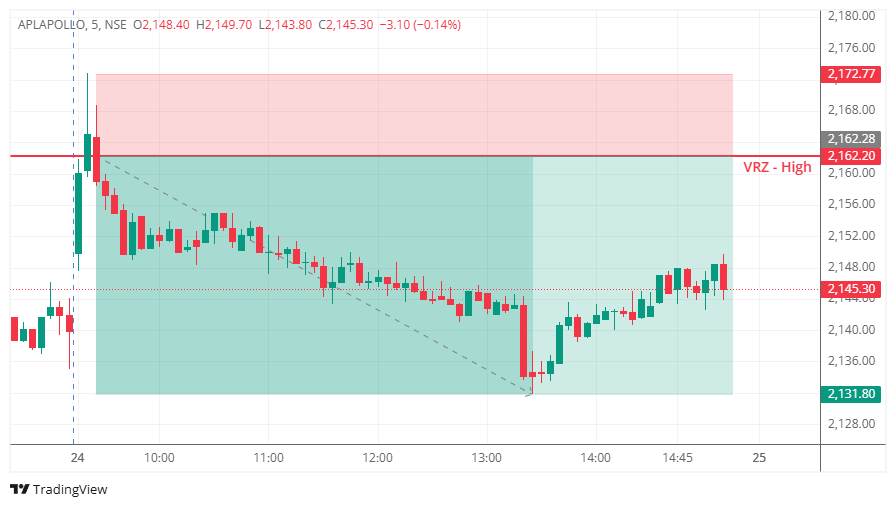

🚀 APLAPOLLO approached the previously identified VRZ High during the early trading session and briefly moved above the resistance zone, creating the appearance of a potential bullish breakout.
⚠️ However, the breakout failed to sustain.
🔻 After trading above the VRZ High around 2,162.20, the price faced immediate rejection and moved back below the resistance level. This rejection confirmed a Breakout Failure (BOF) setup and indicated that the bullish breakout lacked follow-through.
🐂➡️🐻 The failed breakout trapped aggressive buyers and shifted short-term control toward the sellers.
📉 Following the confirmation, APLAPOLLO gradually moved lower, forming a sustained bearish structure and eventually reaching the predefined downside target near 2,131.80. 🎯
🏆 The setup delivered an impressive 1.41% intraday move while achieving a solid 1:3 Risk-Reward, demonstrating the importance of waiting for confirmation before entering a BOF trade. 💯
Initially, many traders expected:
But the market delivered the opposite outcome.
Once price failed to sustain above the VRZ High:
This shift from bullish breakout expectation → failed breakout → bearish continuation created the opportunity for the short trade.
APLAPOLLO briefly moved above the VRZ High, but the breakout could not sustain. A temporary move beyond resistance should not automatically be treated as a genuine breakout.
The setup became stronger once price returned below the VRZ High. Waiting for this confirmation helped avoid chasing the initial breakout and provided a clearer short-side opportunity.
The BOF structure provided a clearly identifiable invalidation area near the resistance zone and a defined downside target. This allowed the trade to achieve a disciplined 1:3 Risk-Reward.
Although buyers initially pushed price above resistance, their inability to sustain the breakout revealed underlying weakness. The subsequent rejection confirmed that sellers had regained short-term control.
The key lesson from this setup is simple:
A failed breakout can be more powerful than the breakout itself. 🔥
Instead of predicting whether the breakout would fail, waiting for price action to confirm the failure provided a more objective trading opportunity.
This APLAPOLLO trade is a strong example of how the Breakout Failure (BOF) strategy can capture an intraday reversal when applied with patience and confirmation. ✅
The stock initially created a bullish breakout above the VRZ High, attracting breakout buyers. However, the inability to sustain above the zone quickly exposed the weakness behind the move.
Once price returned below the VRZ High, the breakout failure became evident and sellers gradually took control. The subsequent decline toward the predefined target produced a 1.41% move with a 1:3 Risk-Reward. 📉🎯
This setup reinforces an important trading principle:
Don't trade what you expect the market to do. Trade what the price confirms. 🧠📈
Successful BOF trading is built on structure + confirmation + disciplined risk management, not on predicting the market direction.

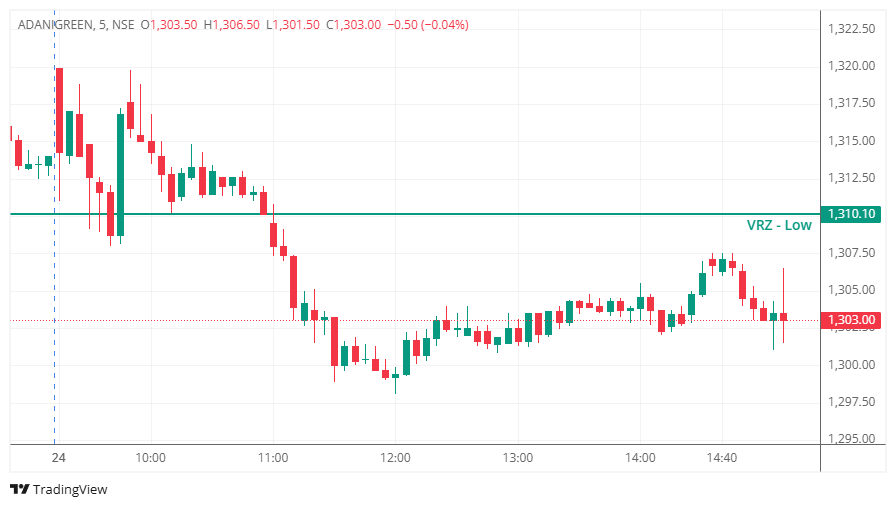

ADANIGREEN approached the previously identified VRZ Low at ₹1,310.10, where traders anticipated a potential bullish Breakout Failure (BOF) setup.
The expectation was that price would briefly break below the support zone and quickly reclaim it, signalling a bullish intraday reversal.
Instead, buyers failed to recover the VRZ Low. Selling pressure remained dominant throughout the session, while price continued trading below ₹1,310.10, preventing a valid bullish confirmation.
The overall intraday structure remained weak despite a few short-lived recovery attempts.
📉 Price stayed below the VRZ Low for most of the session.
⚠️ Buyers failed to reclaim the key support zone.
🔄 Recovery attempts lacked strong momentum.
📍 Lower highs continued to develop during the day.
The continued acceptance below the VRZ Low confirmed that sellers remained in control.
The BOF long setup was monitored after price traded below the ₹1,310.10 VRZ Low.
Initially, buyers attempted to stabilize the price, but the recovery lacked conviction. Every bounce was met with fresh selling, preventing the stock from reclaiming the reversal zone.
As the session progressed, the bullish BOF setup lost validity, and the predefined stop loss was triggered as the expected reversal failed to materialize.
The BOF setup failed because buyers were unable to reclaim the VRZ Low with strong bullish momentum.
❌ Price remained below ₹1,310.10 after the breakdown.
❌ Buying momentum stayed weak throughout the session.
❌ Recovery attempts failed to break above the VRZ Low.
❌ Sellers continued defending lower price levels.
❌ The expected bullish BOF confirmation never developed.
These warning signals significantly reduced the probability of a successful BOF long trade.
The chart highlights a failed bullish BOF attempt with continued bearish acceptance.
🔻 Sellers pushed price below the VRZ Low.
🟡 Buyers attempted a short-term recovery.
🔄 The rebound lacked strong bullish continuation.
🔴 Selling pressure returned around every bounce.
📉 Price continued trading below the support zone for the remainder of the session.
This is a classic example where failure to reclaim support invalidates the bullish BOF setup.
⚠️ A breakdown below support alone does not create a valid BOF trade.
📊 A bullish BOF requires a quick and convincing reclaim of the VRZ Low.
🔍 Acceptance below the support zone signals continued seller strength.
🛡️ Respecting the predefined stop loss protects trading capital.
🎯 Waiting for confirmation improves the quality of BOF trade execution.
This trade reinforces the importance of trading confirmation instead of anticipation.
✅ Every BOF setup carries a probability of failure.
✅ A valid trading idea can still become invalid without confirmation.
✅ Professional traders accept controlled losses without emotional decisions.
✅ Consistency comes from following the trading process, not predicting reversals.
Effective risk management remains the foundation of sustainable trading.
✔️ Entry was based on predefined BOF rules.
✔️ Risk was clearly defined before execution.
✔️ Stop loss was respected without hesitation.
✔️ No averaging down or emotional trading occurred.
✔️ Capital remained protected for future opportunities.
Small, controlled losses are a necessary part of long-term trading success.
🌍 Markets constantly test patience, discipline, and risk management.
⚠️ This ADANIGREEN BOF Failure demonstrates that failure to reclaim the VRZ Low is a strong sign that bullish reversal momentum is missing.
📉 When price continues accepting lower levels below the reversal zone, the probability of a successful BOF long setup decreases significantly.
🛡️ Professional traders focus on protecting capital, waiting for confirmation, and avoiding premature entries.
💪 Trust your process, manage risk wisely, and let confirmed price action—not expectations—guide every trade.
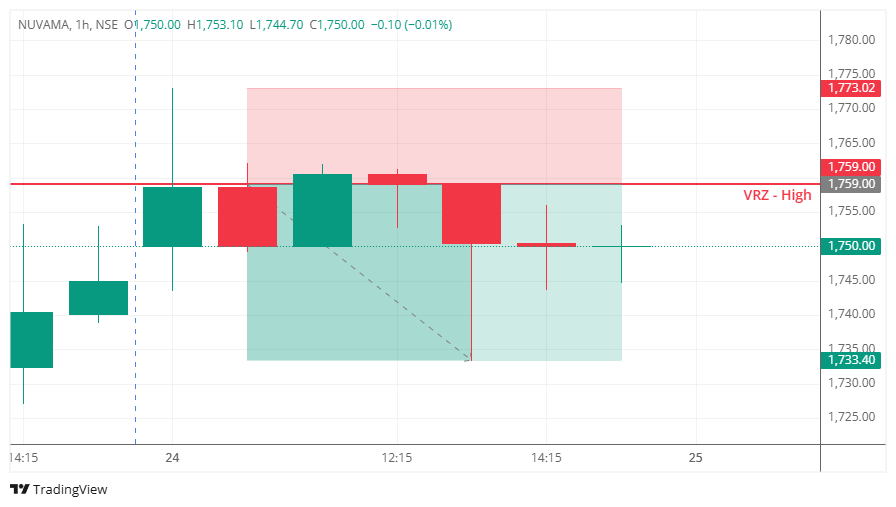

🔺 NUVAMA moved higher and attempted to break above the ₹1,759.00 VRZ High.
⚠️ Buyers managed to push price above the resistance, but the breakout failed to sustain.
🔴 Strong selling pressure emerged around the VRZ High, forcing price back below the key zone.
📉 Subsequent candles showed increasing bearish pressure as sellers started taking control.
🔄 The failed breakout trapped late buyers and created the conditions for a bearish reversal.
🎯 Price continued lower toward the projected downside target.
🚀 The setup ultimately delivered a 1.46% bearish move with a solid 1:2 RR.
🔎 Price approached the VRZ High following a strong bullish move.
🟢 Buyers pushed toward and briefly above the ₹1,759.00 resistance.
⚠️ The breakout failed to attract sustained buying follow-through.
🔴 Sellers responded aggressively near the resistance zone.
📉 Bearish candles developed as price slipped back below the VRZ High.
🔄 The failed breakout became increasingly evident as buyers lost momentum.
🎯 Continued selling pressure carried NUVAMA toward the downside objective.
Initially, traders could have expected:
🟢 A confirmed breakout above ₹1,759.00.
📈 Further upside continuation.
🐂 Buyers to remain in control.
But the market quickly changed the narrative.
⚠️ The breakout failed to hold.
😰 Breakout buyers became trapped at higher levels.
🔴 Sellers stepped in near the resistance.
🔄 Price moved back below the VRZ High.
📉 As confidence shifted from buyers to sellers, bearish momentum accelerated.
🟢 Buyers attempted to establish control above the resistance.
🔴 Sellers strongly defended the VRZ High.
⚖️ The battle intensified around ₹1,759.00.
⚠️ Failure to sustain higher prices weakened bullish momentum.
🔄 Trapped buyers started exiting their positions.
📉 Fresh sellers joined once bearish confirmation appeared.
🚀 This combination of trapped buyers and fresh selling pressure drove the downside move.
🎯 Resistance Zone Held Firm
The ₹1,759.00 VRZ High acted as a strong supply area where sellers stepped in.
⚡ Breakout Lost Momentum
Price briefly moved above resistance but failed to attract continued buying interest.
🚨 Sharp Rejection Confirmed
The quick move back below the VRZ High signaled that the breakout lacked strength.
📉 Sellers Took Command
Follow-through selling confirmed a clear shift from bullish to bearish momentum.
🔒 Defined Invalidation
The failed breakout provided a clear level above which the bearish setup would become invalid.
💰 Reward Outpaced Risk
The successful reversal delivered a 1.46% downside move with a 1:2 RR.
📈 Before Rejection: Buyers controlled the upward move toward the VRZ High.
⚠️ At the Zone: Buyers attempted a breakout but failed to sustain above resistance.
🔴 After Rejection: Sellers regained control and pushed price lower.
📉 Confirmation: Bearish candles reinforced the reversal.
🎯 Final Move: Price continued toward the projected downside target.
🎯 Respect Key Resistance Zones
VRZ High can act as an important area for identifying potential breakout failures.
🔍 Do Not Chase Every Breakout
A move above resistance is not enough to confirm a genuine breakout.
⚠️ Wait for Failure Confirmation
Look for rejection and a return below the breakout zone before treating the setup as a BOF.
📉 Watch for Trapped Buyers
Failed breakouts can force late buyers to exit, adding fuel to the bearish move.
🛡️ Define Risk Before Entry
A clear invalidation level helps maintain disciplined trade management.
💰 Focus on Risk-Reward
A controlled-risk setup can provide attractive opportunities when the reversal develops as expected.
