
Select a trading day to view all Scanner results, chart evidence, and market explanations.
2 Scanners Available
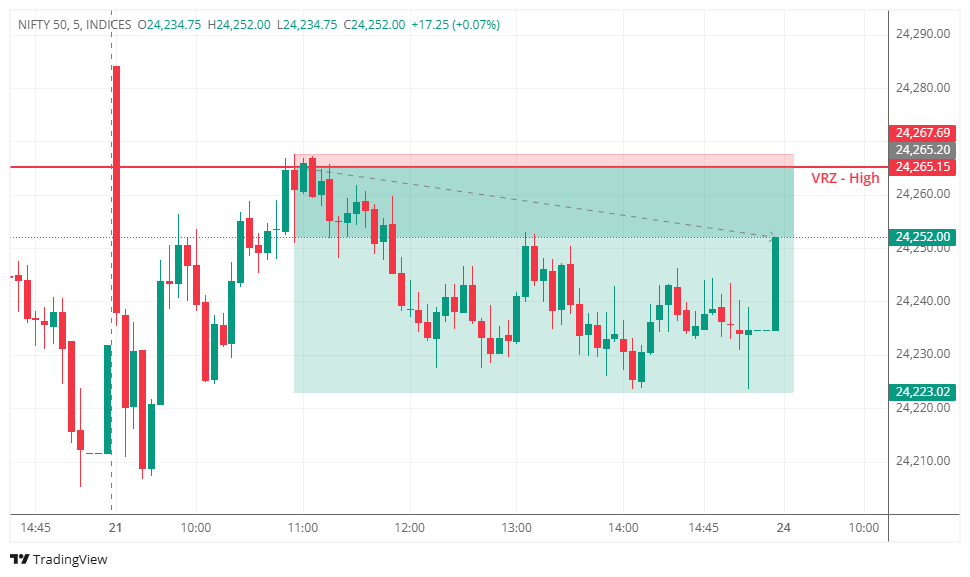

🚀 NIFTY 50 tested the VRZ High around 24,265.15 as buyers attempted to push higher.
📈 The initial breakout attempt suggested possible bullish continuation.
❌ However, price failed to sustain above the resistance.
🔻 Sellers stepped in and pushed the index back below the VRZ High.
📉 The weakening structure indicated a shift from buyer dominance toward seller control.
✅ This confirmed the Breakout Failure (BOF) setup.
💥 The failed breakout eventually produced a 0.17% downside move with an impressive 1:16 RR.
🔎 Price gradually advanced toward the VRZ High.
🟢 Buyers tested the 24,265.15 resistance zone.
⚠️ The breakout lacked strong follow-through.
🔴 Price slipped back below the resistance and lost bullish momentum.
📉 Sellers gradually gained control as price moved away from the VRZ High.
🎯 The bearish continuation completed the planned BOF move.
At first, traders could have expected:
🚀 A sustained breakout above the VRZ High.
📈 Continuation of the existing upward momentum.
🐂 Buyers to remain in control.
But the market delivered a different outcome:
⚠️ The breakout failed.
😮 Breakout buyers became trapped.
🔴 Sellers defended the resistance zone.
📉 Bullish positions came under pressure as price moved lower.
💥 The shift in sentiment supported the successful bearish reversal.
🟢 Buyers attempted to take NIFTY 50 above 24,265.15.
🔴 Sellers strongly defended the VRZ High.
⚖️ Failure to sustain above resistance weakened buyer confidence.
🔄 Trapped breakout positions added pressure after the rejection.
📉 Sellers gradually took control and drove the downside move.
🔸 Resistance Defense
The 24,265.15 VRZ High acted as a strong barrier against further upside.
🟡 Breakout Failure
The move above resistance lacked the follow-through required for a genuine breakout.
🔻 Downside Rejection
Price returned below the VRZ High, strengthening the bearish setup.
📊 Momentum Reversal
Bullish momentum weakened as sellers gradually gained control.
🏆 Outstanding Risk-Reward
The setup captured a 0.17% downside move with an impressive 1:16 RR.
🎯 Confirm Before Entering
A temporary breakout above resistance should not be treated as confirmation by itself.
👁️ Read the Resistance Reaction
Price behavior around the VRZ High can reveal whether buyers or sellers have control.
🚫 Don’t Chase Breakouts
Waiting for confirmation can help avoid entering failed breakout moves.
📉 Watch for Bearish Structure
Weakening momentum and downside movement can strengthen the BOF confirmation.
⚡ Use Trapped Traders as Context
Failed breakouts can force trapped buyers to exit, adding fuel to the bearish move.
⚖️ Protect Capital First
Predefined stop-loss and disciplined position sizing are essential for consistent BOF execution.
📌 Identify and mark the VRZ High before the setup forms.
🔎 Track price behavior carefully around the resistance zone.
⛔ Never treat a breakout as valid without confirmation.
⚡ Wait for clear rejection and bearish BOF confirmation.
📉 Watch for weakening momentum and developing lower highs.
🛡️ Set the stop-loss and invalidation level before entry.
⚖️ Follow strict risk management throughout the trade.

📊 Stock: FSN E-Commerce Ventures Ltd (NYKAA)
🛍️ Sector: E-Commerce / Retail
⏱️ Chart Time Frame: 5 Minutes
🕒 VRZ Marking Time Frame: 30 Minutes
🛑 Reversal Zone: VRZ High – ₹332.00
🧩 Setup Type: Breakout Failure (BOF)
📍 Reference Zone: VRZ High – ₹332.00
📉 Trade Direction: Sell
🚫 Outcome: Stop Loss Triggered

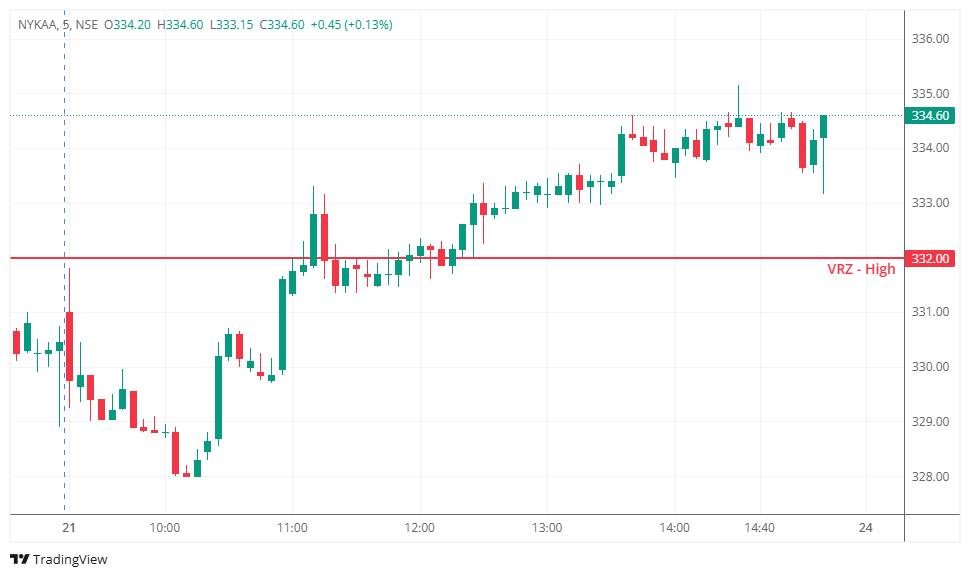
NYKAA approached the previously identified VRZ High at ₹332.00, where traders monitored for a potential bearish Breakout Failure (BOF). The expectation was that a brief breakout above the VRZ High followed by a quick rejection below the zone could trigger an intraday decline.
Instead, buyers successfully reclaimed and sustained price above ₹332.00. Selling pressure failed to develop, while price continued to hold above the reversal zone, weakening the bearish BOF thesis.
As the session progressed, buyers maintained control and price formed a series of higher levels, eventually moving toward the ₹334–₹335 region. Since the expected rejection and sustained move back below the VRZ High did not develop, the bearish BOF setup failed and the predefined stop loss was triggered.
🔹 The VRZ High at ₹332.00 would act as strong resistance.
🔹 Buyers breaking above the zone would become trapped.
🔹 A failed breakout would trigger an intraday bearish reversal.
🔹 Sellers would quickly push price back below the VRZ High.
✔️ Buyers successfully reclaimed and sustained above ₹332.00.
✔️ Selling pressure remained weak after the breakout.
✔️ Price continued accepting higher levels.
✔️ Pullbacks attracted renewed buying interest.
✔️ The expected bearish BOF confirmation failed to develop.
⚠️ Rather than reversing lower, bullish momentum strengthened as buyers continued defending the reclaimed VRZ High.
A valid bearish BOF requires price to break above resistance and quickly reject back below it. In NYKAA, price sustained above ₹332.00, so the expected bearish reversal lacked confirmation.
Sustained trading above the VRZ High indicated that buyers were gaining control and sellers lacked sufficient conviction to force a reversal.
When sellers cannot push price back below a broken resistance level, bullish momentum can continue and the breakout may develop into a stronger move.
Once the bearish BOF thesis was invalidated, respecting the predefined stop loss prevented the losing trade from becoming an uncontrolled position.
📈 This session demonstrated that a breakout above resistance does not automatically create a valid bearish BOF opportunity. Although NYKAA approached and moved around the VRZ High at ₹332.00, sellers failed to establish a sustained rejection, while buyers continued to defend higher levels.
✅ By respecting the BOF confirmation rules and predefined invalidation level, disciplined traders avoided holding onto a failed bearish reversal thesis.
💡 LTS Principle: Trade confirmed price action—not expectations.