
Select a trading day to view all Scanner results, chart evidence, and market explanations.
2 Scanners Available
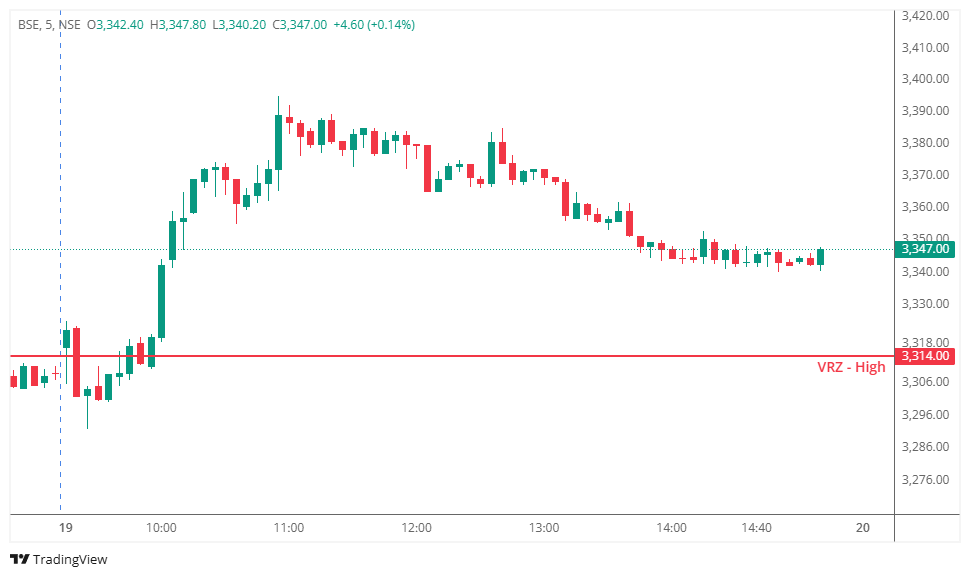

BSE initially traded around the ₹3,314 VRZ High before buyers gained strength and pushed the price decisively above the reversal zone.
The breakout showed strong bullish momentum rather than an immediate rejection. Although the price later consolidated and declined from the session highs, it remained well above the original VRZ High.
This indicated that sellers were unable to convert the breakout into a sustained bearish reversal.
The initial price action around the VRZ High suggested a potential resistance reaction.
However, buyers quickly established control above the zone.
📈 Price broke above ₹3,314.00.
🟢 Buyers produced strong upward expansion.
🔄 The stock consolidated near the session highs.
📉 A later pullback developed, but price remained significantly above the VRZ High.
The overall structure therefore remained bullish despite the later retracement.
The BOF short setup was considered around the VRZ High after the price action showed signs of rejection.
However, sellers failed to generate immediate downside continuation.
Instead, buyers pushed the stock strongly above ₹3,314.00, invalidating the expected resistance reversal.
The predefined stop loss was triggered as bullish momentum continued.
Although the stock later experienced a sizeable pullback from the highs, the reversal occurred only after the original BOF setup had already been invalidated.
The BOF setup failed because the expected rejection from the VRZ High did not develop into sustained selling pressure.
❌ Sellers failed to create immediate downside momentum.
❌ Buyers decisively reclaimed and crossed the VRZ High.
❌ Strong bullish candles appeared after the zone breakout.
❌ Price established higher intraday levels.
❌ The later decline occurred only after a substantial bullish move.
These conditions significantly weakened the probability of a successful BOF short trade.
The chart highlights a failed VRZ High reversal followed by strong bullish expansion.
🔻 Price initially approached the VRZ High.
🟢 Buyers pushed decisively above ₹3,314.00.
🚀 Strong bullish candles carried the stock toward ₹3,390.
🔄 Price then entered a consolidation phase near the highs.
📉 Sellers eventually created a gradual pullback.
📍 Despite the retracement, price remained comfortably above the VRZ High.
This demonstrates that a later decline does not necessarily validate an earlier BOF short setup.
⚠️ A resistance zone alone does not guarantee a bearish reversal.
📊 Strong breakout momentum should be respected before entering a counter-trend BOF trade.
🔍 Confirmation of rejection is essential before taking a short position.
📈 When price sustains above the VRZ High, the original reversal thesis becomes weaker.
🛡️ A predefined stop loss prevents a failed reversal idea from turning into an uncontrolled loss.
This setup highlights the importance of accepting a failed trade without emotional intervention.
✅ Every BOF setup has both winning and losing probabilities.
✅ A valid setup can still fail when market momentum changes.
✅ Traders should respect invalidation levels rather than defend a losing position.
✅ Consistent execution matters more than being correct on every trade.
Professional trading is about managing probabilities—not predicting every market move.
Effective risk management remains the foundation of sustainable trading.
✔️ The trade was based on a predefined BOF structure.
✔️ Risk was identified before execution.
✔️ Stop loss was respected when the reversal failed.
✔️ No emotional averaging was required.
✔️ Capital remained available for the next trading opportunity.
Controlled losses are part of maintaining long-term trading consistency.
🌍 Markets constantly test patience, discipline, and risk management.
⚠️ This BSE BOF Failure demonstrates that an expected rejection at VRZ High is not enough to justify a sustained short position. Strong bullish breakout momentum and continued trading above the zone can quickly invalidate a reversal setup.
📈 The later pullback does not change the original trade outcome because the BOF setup had already failed.
🛡️ Professional traders focus on protecting capital, respecting invalidation levels, and following their trading plan.
💪 Trust your process, manage risk carefully, and allow disciplined execution—not emotions—to guide every trade.
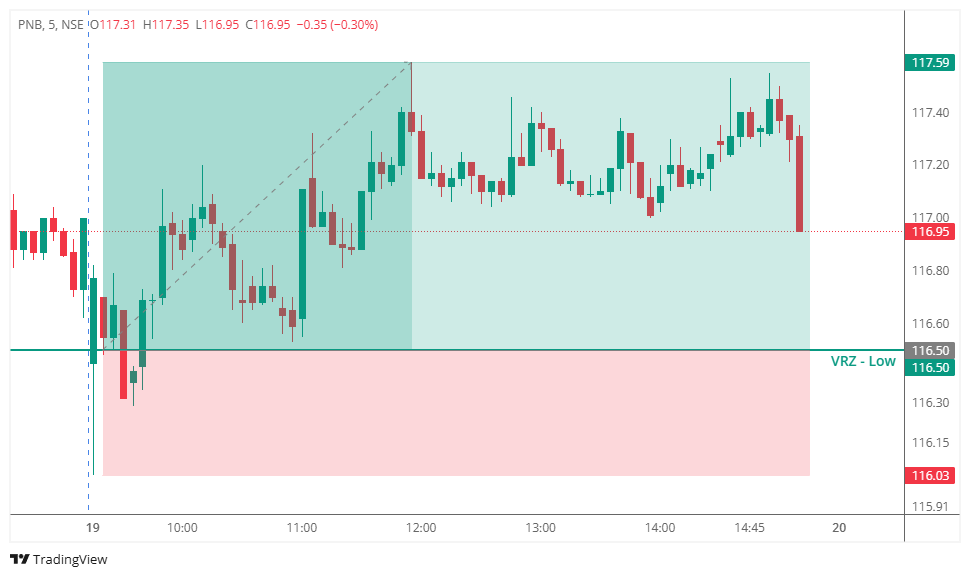

🔻 PNB moved toward the VRZ Low and briefly tested the ₹116.50 support area.
⚠️ Sellers attempted to push price lower, but the breakdown lacked continuation.
🟢 Buyers absorbed the selling pressure and pushed price back above the key support.
📈 Price then developed stronger bullish momentum with higher levels following the rejection.
✅ This confirmed a classic Breakout Failure (BOF) setup at the VRZ Low.
🚀 The successful reversal delivered a 0.94% upside move, achieving the planned 1:2 risk-reward target.
🔻 The initial price action showed clear selling pressure toward the VRZ Low.
🟢 Around ₹116.50, sellers struggled to maintain downside control.
🔄 Price rejected the lower levels and reclaimed the support zone.
📈 Subsequent bullish candles confirmed improving buyer strength.
🎯 The sustained recovery eventually produced the successful upside move.
Initially, traders could have expected:
📉 A continuation of the downward move.
🔻 A breakdown below ₹116.50.
🐻 Sellers to remain dominant.
But the setup quickly changed.
⚠️ The breakdown failed.
😮 Sellers were unable to sustain lower prices.
🟢 Buyers defended the VRZ Low.
📈 Price recovered and gradually strengthened.
🚀 The shift in sentiment helped drive the bullish continuation.
🔴 Sellers attempted to break the ₹116.50 support.
🟢 Buyers stepped in and absorbed the selling pressure.
⚖️ The failed breakdown weakened seller conviction.
🔄 As price reclaimed the zone, bearish positions came under pressure.
📈 Fresh buying helped strengthen the upward momentum.
💥 This buyer-seller shift powered the successful BOF reversal.
🔹 Strong Support Reaction
The ₹116.50 VRZ Low attracted buyers when price tested the support zone.
🟠 Breakdown Failure
Price failed to sustain below the VRZ Low, weakening the bearish setup.
🔄 Successful Reclaim
The recovery above ₹116.50 provided confirmation of the bullish reversal.
📊 Improving Price Structure
The subsequent bullish movement showed strengthening buyer control.
🏆 Controlled Risk-Reward
The setup captured a 0.94% upside move with 1:2 RR.
🎯 Support Breaks Need Confirmation
A temporary move below support does not automatically confirm a genuine breakdown.
🔍 Study the Reaction Zone
Strong rejection around the VRZ Low can indicate active buyer participation.
📈 Reclaim Strengthens the Setup
Price recovering above the failed breakdown zone provides additional bullish confirmation.
⚡ Failed Breakdowns Can Trap Sellers
When price reverses back above support, sellers may be forced to exit positions.
⚖️ Keep Risk Defined
A predefined stop-loss helps maintain disciplined execution when trading BOF setups.
🎯 Mark the VRZ Low clearly before the trade.
🔎 Monitor price behavior around the support area.
⚠️ Avoid assuming every breakdown will continue.
🚨 Wait for rejection and bullish confirmation.
📈 Track the price structure after the failed breakdown.
🛡️ Define the stop-loss before entering.
⚖️ Maintain disciplined risk management throughout the trade.
