
Select a trading day to view all Scanner results, chart evidence, and market explanations.
3 Scanners Available
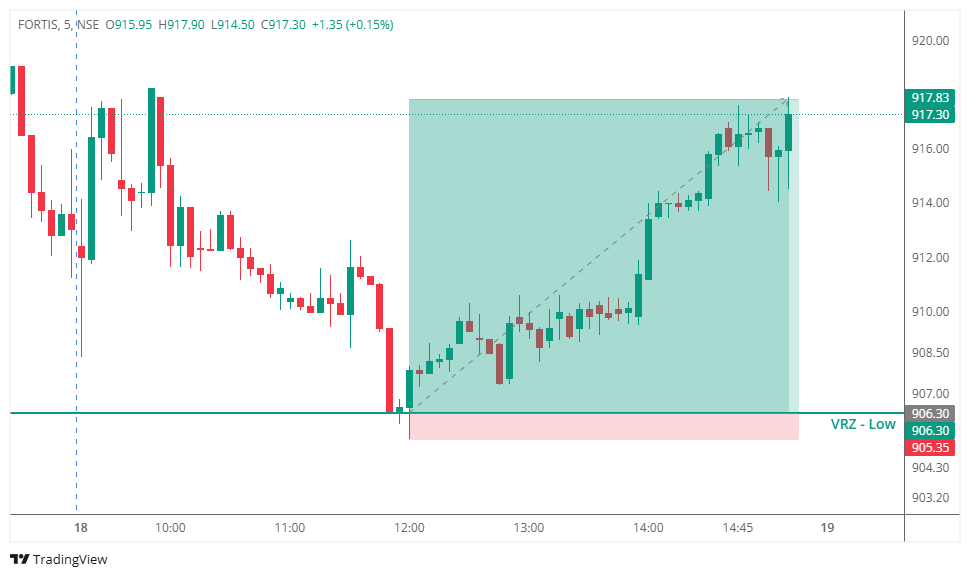

🔻 FORTIS moved sharply lower toward the VRZ Low and briefly tested the ₹906.30 support area.
⚠️ Sellers attempted to extend the breakdown, but the move lacked follow-through.
🟢 Buyers stepped in strongly around the VRZ Low and pushed price back above the support zone.
📈 Price then developed a sequence of higher highs and higher lows, confirming a shift in short-term momentum.
✅ This price action established a classic Breakout Failure (BOF) setup.
🚀 As breakdown sellers became trapped and fresh buying entered the market, FORTIS delivered a 1.27% upside move, achieving an impressive 1:12 risk-reward ratio.
🔎 The stock was under selling pressure before reaching the VRZ Low.
🔻 Sellers attempted to push price through the ₹906.30 support.
🟢 The breakdown failed as buyers defended the zone aggressively.
🔄 Price reclaimed the VRZ Low and began forming a stronger bullish structure.
📈 Continued higher highs and higher lows confirmed increasing buyer participation.
🎯 The bullish momentum eventually carried price toward the projected target, completing the successful BOF move.
Initially, traders could have expected:
🔻 A continuation of the bearish trend.
📉 A confirmed breakdown below ₹906.30.
🐻 Sellers to maintain control.
But the price action shifted the narrative.
⚠️ The breakdown failed to sustain.
😮 Breakdown sellers became trapped.
🟢 Buyers defended the VRZ Low.
🔄 Price reclaimed the support zone.
🚀 Strong bullish momentum attracted additional buying and drove the stock higher.
🔴 Sellers initially attempted to break the VRZ Low.
🟢 Buyers absorbed the selling pressure around ₹906.30.
⚖️ The failed breakdown weakened seller conviction.
🔄 Trapped sellers were forced to cover as price recovered above the zone.
📈 Fresh buyers joined the move as bullish momentum strengthened.
💥 The combination of short covering and fresh buying accelerated the upside move.
🔹 VRZ Low Defense
The ₹906.30 zone attracted strong buyer participation after the downside test.
🟠 Failed Breakdown
Price could not sustain below the support area, weakening the bearish continuation attempt.
🔻 Bullish Reclaim
Recovery above the VRZ Low confirmed the breakdown failure.
📊 Bullish Structure
Higher highs and higher lows demonstrated a clear shift toward buyer control.
🏆 Exceptional Risk-Reward
The setup delivered a 1.27% upside move with an impressive 1:12 RR.
🎯 A Breakdown Needs Follow-Through
A temporary move below support does not automatically confirm a genuine breakdown.
🔍 Watch the VRZ Reaction
Strong rejection around a predefined VRZ Low can signal active buyer participation.
📈 Reclaim Strengthens Confirmation
A move back above the failed breakdown zone provides stronger bullish confirmation.
⚡ Trapped Sellers Can Fuel Momentum
When a breakdown fails, short covering can add further buying pressure.
💰 Asymmetric Risk-Reward Matters
A well-defined invalidation level can create highly favorable risk-reward opportunities.
🎯 Mark the VRZ Low clearly before taking the trade.
🔎 Observe price behavior around the support zone.
⚠️ Avoid assuming that every breakdown will continue.
🚨 Wait for rejection and bullish confirmation.
📈 Monitor higher highs and higher lows after the failure.
🛡️ Define the stop-loss before entering the position.
🚧 Avoid excessive risk and respect your stop-loss.

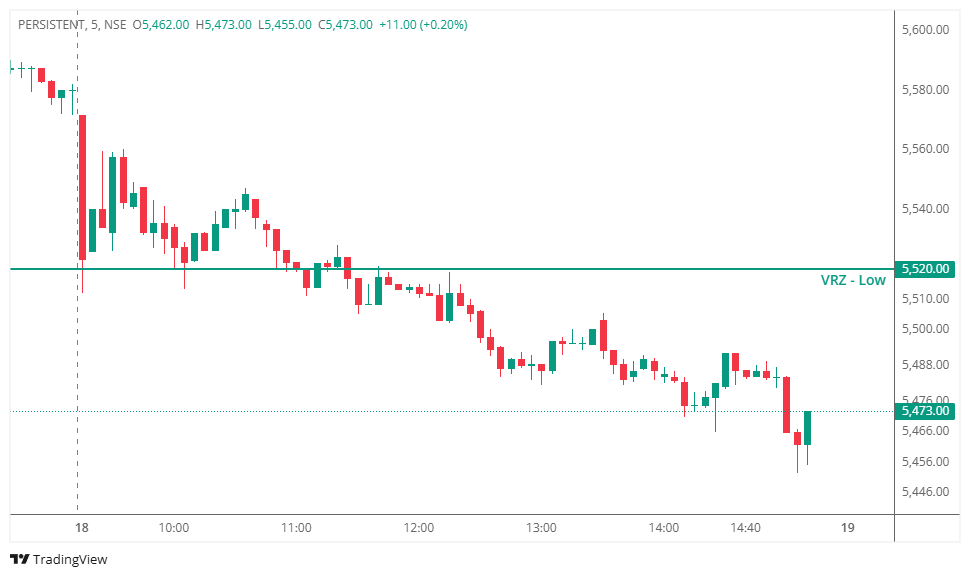

PERSISTENT remained under persistent selling pressure throughout the session, gradually moving lower from the opening levels.
The key VRZ Low at ₹5,520 acted as the important reference zone for the BOF setup.
Price attempted to stabilize around the support area, but the broader intraday structure remained bearish. Buyers struggled to generate enough momentum to reverse the prevailing downtrend.
The eventual failure of the support recovery resulted in the BOF Buy setup becoming invalid.
The overall market structure was clearly tilted toward sellers.
📉 Lower highs continued to develop.
📉 Lower lows were formed during the session.
📉 Every recovery attempt faced selling pressure.
📉 Price remained below the important ₹5,520 VRZ Low.
This indicated that buyers were unable to establish control after the support failure.
The BOF setup therefore faced a difficult environment because the larger intraday trend continued to favor sellers.
The BOF Buy setup was based on the expectation that price would reject the breakdown and reclaim the ₹5,520 VRZ Low.
Initially, the price action around the reversal zone suggested that buyers might attempt a recovery.
However, the expected bullish follow-through did not develop.
Instead, price remained weak and continued drifting lower.
Selling pressure eventually pushed PERSISTENT further away from the VRZ Low, resulting in the predefined stop loss being triggered.
The loss remained controlled because the trade followed a predefined risk-management structure.
The primary failure came from the lack of bullish follow-through after the BOF attempt.
❌ Strong prevailing intraday downtrend.
❌ Price failed to sustain recovery above the VRZ Low.
❌ Multiple weak bounce attempts.
❌ No strong higher-high formation.
❌ Sellers remained active near resistance.
❌ Price continued making lower lows.
❌ The breakdown ultimately extended instead of reversing.
These conditions significantly reduced the probability of a successful bullish BOF.
The chart demonstrates how a Breakdown Failure setup can fail when the broader trend remains strongly bearish.
🔴 Sellers controlled the early session.
🟡 Price consolidated around the VRZ Low.
🟢 Buyers attempted to stabilize the price.
⚠️ Bullish momentum failed to expand.
🔴 Sellers regained control.
📉 Price continued toward lower levels, eventually reaching approximately ₹5,456 before a late-session bounce.
The late recovery was not enough to repair the broader bearish structure.
⚠️ A BOF setup should never be evaluated only by the initial support reaction.
📊 The reclaim needs strong follow-through.
📈 A successful BOF normally benefits from higher highs and expanding bullish momentum.
🚨 Repeated tests of support can weaken the zone rather than strengthen it.
🛡️ A predefined stop loss is essential when a reversal thesis fails.
🎯 The quality of confirmation matters more than simply seeing a temporary bounce.
This PERSISTENT trade is a good example of why strategy execution and trade outcome are two different things.
A setup can satisfy the predefined conditions and still become a losing trade.
Experienced traders understand that:
✅ No BOF setup has a 100% success rate.
✅ Strong trend context must be considered.
✅ Confirmation is critical before expecting a reversal.
✅ Stop loss protects capital when the trade thesis becomes invalid.
✅ One losing trade does not invalidate a rule-based strategy.
Professional trading is not about avoiding every loss.
It is about controlling the size of every loss.
✔️ The trade was based on a predefined VRZ level.
✔️ The BOF concept provided a clear invalidation point.
✔️ Stop-loss discipline prevented the losing position from becoming uncontrolled.
✔️ Capital remained available for the next opportunity.
A controlled loss is part of systematic trading.
📉 The PERSISTENT BOF Failure demonstrates an important trading lesson: a support breakdown does not automatically become a successful bullish reversal.
The ₹5,520 VRZ Low was the critical decision level, but buyers failed to establish sustained control above the zone.
⚠️ The broader bearish structure, weak recovery attempts, lack of higher highs, and continued selling pressure ultimately caused the BOF setup to fail.
🛡️ The correct response to a failed reversal is not emotional averaging or revenge trading—it is disciplined risk management and acceptance of the predefined exit.
📈 Successful trading is not about winning every setup. It is about executing the same high-quality process consistently while keeping losing trades under control.
💪 Follow the setup. Respect the confirmation. Protect the capital. Let consistency compound.
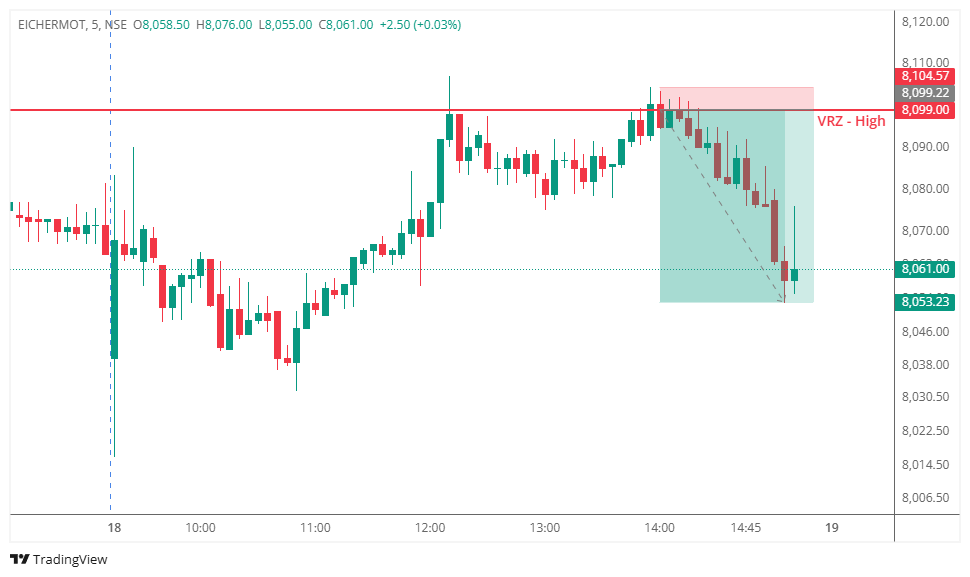

🚀 EICHERMOT pushed into the VRZ High around ₹8,099.00 and briefly traded above the resistance zone.
📈 The initial move suggested that buyers might continue the bullish momentum.
⚠️ However, price failed to sustain above the key resistance.
🔻 Strong rejection emerged from the VRZ High as sellers stepped in.
📉 Price moved back below the resistance and began forming a sequence of lower highs and lower lows.
✅ This confirmed a classic Breakout Failure (BOF) setup.
💥 As breakout buyers became trapped and selling pressure increased, EICHERMOT delivered a 0.57% downside move, achieving an impressive 1:8 risk-reward ratio.
🔎 Price approached the VRZ High following a sustained intraday recovery.
📈 Buyers attempted to push the stock beyond ₹8,099.00.
❌ The breakout lacked follow-through and quickly lost momentum.
🔴 Sellers rejected the higher levels and forced price back below the VRZ High.
📉 Consecutive bearish candles confirmed increasing selling pressure.
🎯 The downside move continued toward the projected target, completing the successful BOF trade.
Initially, traders could have expected:
🚀 A clean breakout above ₹8,099.00.
📈 Continuation of the existing bullish trend.
🐂 Buyers to remain in control.
But the market shifted quickly.
⚠️ The breakout failed.
😮 Breakout buyers became trapped above resistance.
🔴 Sellers regained control.
📉 Long positions were unwound as price moved back below the VRZ High.
🚀 Fresh selling further accelerated the bearish reversal.
🟢 Buyers initially attempted to sustain the breakout above the VRZ High.
🔴 Sellers aggressively defended the ₹8,099.00 resistance zone.
⚖️ Failure to hold above resistance weakened buyer conviction.
🔄 Trapped breakout buyers began exiting their positions.
📉 Fresh sellers joined the move as bearish momentum strengthened.
💥 This combination created the successful downside continuation.
🔸 Resistance Rejection
The ₹8,099.00 VRZ High acted as a strong selling zone, preventing sustained upside.
🟠 Breakout Trap
The move above resistance failed to attract continued buying, trapping breakout participants.
🔻 Bearish Zone Reclaim
Price slipped back below the VRZ High, strengthening the bearish BOF confirmation.
📉 Selling Momentum
Lower highs and lower lows confirmed the shift from buyer control to seller dominance.
🏆 Reward Potential
The setup captured a 0.57% downside move with an impressive 1:8 RR.
🎯 A Breakout Needs Follow-Through
A temporary move above resistance does not automatically confirm a genuine breakout.
🔍 Watch for Rejection at VRZ High
Sharp rejection can reveal strong seller participation at key resistance.
📉 Price Reclaim Confirms Failure
A move back below the breakout zone strengthens the bearish BOF signal.
⚡ Trapped Buyers Can Fuel the Downside
Failed breakouts can trigger long unwinding and accelerate selling pressure.
💰 Asymmetric Risk-Reward Matters
A clearly defined invalidation level can create highly favorable risk-reward opportunities.
🎯 Mark the VRZ High clearly before taking the trade.
🔎 Observe the price reaction around the resistance zone.
⚠️ Avoid assuming that every breakout will sustain.
🚨 Wait for clear rejection and bearish confirmation.
📉 Track lower highs and lower lows after the failed breakout.
🛡️ Set the stop-loss before entering the position.
⚖️ Follow disciplined risk management throughout the trade.
