
Select a trading day to view all Scanner results, chart evidence, and market explanations.
8 Scanners Available
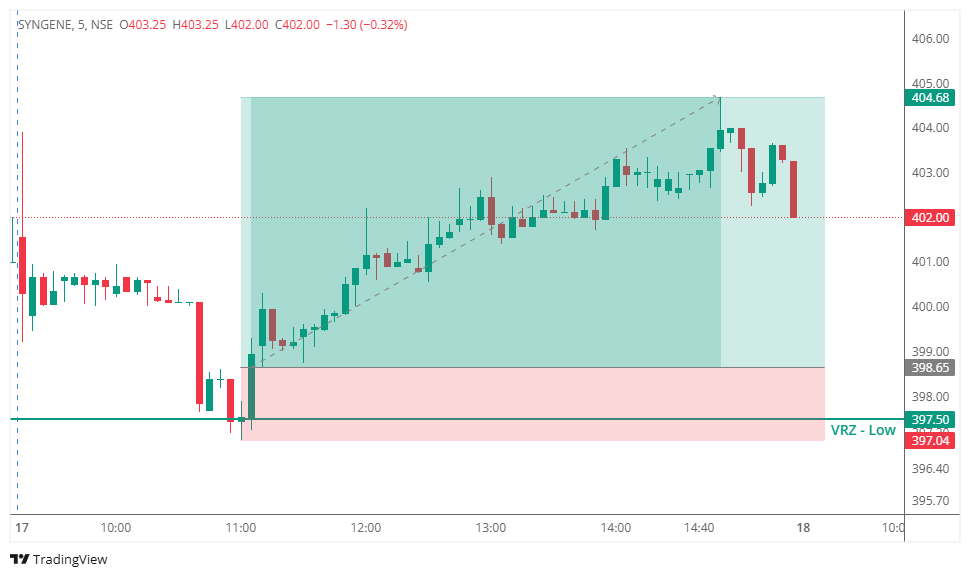

🔻 SYNGENE initially moved sharply lower toward the VRZ Low and briefly traded around the ₹397.50 support area.
⚠️ Sellers attempted to push price below the zone, but the breakdown lacked follow-through.
🟢 Strong buying interest emerged near the VRZ Low.
🔄 Price reclaimed the support zone and started forming a sequence of higher highs and higher lows.
📈 Bullish momentum continued to build as buyers gained control throughout the session.
✅ This confirmed a classic Breakout Failure (BOF) setup at the VRZ Low.
🚀 The successful reversal eventually delivered a 1.51% upside move, achieving the planned 1:3 risk-reward target.
🔻 The initial sell-off created strong bearish pressure toward the VRZ Low.
🟢 Price rejected the lower levels around ₹397.50 instead of sustaining below support.
📈 The recovery above the VRZ Low marked an important shift in short-term market structure.
🔼 Successive bullish candles and higher price levels confirmed increasing buyer participation.
🎯 The move continued toward the upside target, completing the successful BOF trade.
Initially, traders could have expected:
🔻 A continuation of the bearish move.
📉 A confirmed breakdown below the VRZ Low.
🐻 Sellers to remain in control.
But the market quickly shifted.
⚠️ The breakdown failed to sustain.
😮 Breakdown sellers became trapped.
🟢 Buyers defended the ₹397.50 zone.
📈 Price reclaimed the VRZ Low and started trending higher.
🚀 The transition from bearish expectation to bullish control powered the 1.51% upside move.
🔴 Sellers attempted to break the VRZ Low.
🟢 Buyers absorbed the selling pressure near ₹397.50.
⚖️ The failed breakdown weakened seller conviction.
🔄 As price moved back above the zone, trapped sellers were forced to cover positions.
📈 Fresh buying followed the bullish reversal, strengthening the upward momentum.
🔹 Strong VRZ Low Defense
The ₹397.50 zone attracted buyers when sellers attempted to push price lower.
🔹 Failed Breakdown
Price could not sustain below the support area.
🔹 Bullish Reclaim
Recovery above the VRZ Low confirmed the reversal.
🔹 Higher Highs & Higher Lows
The subsequent price structure demonstrated strengthening bullish momentum.
🔹 Favorable Risk-Reward
The setup delivered a 1.51% upside move with 1:3 RR.
🎯 Don't Treat Every Breakdown as Genuine
A temporary move below support needs follow-through before confirming a bearish continuation.
🔍 Watch for Strong Rejection
A sharp rejection around the VRZ Low can reveal strong buyer participation.
📈 Reclaim Provides Confirmation
A move back above the failed breakdown zone strengthens the bullish BOF signal.
⚡ Structure Confirms Momentum
Higher highs and higher lows after the rejection can reinforce the bullish reversal.
💰 Defined Risk Creates Opportunity
A clear invalidation level around the VRZ Low helps maintain disciplined risk management.
✅ Identify the VRZ Low before entering the trade.
✅ Monitor price reaction around the predefined support zone.
✅ Avoid chasing a breakdown without confirmation.
✅ Look for rejection and bullish reclaim.
✅ Confirm the reversal through price structure.
✅ Define the stop-loss before entry.
✅ Maintain disciplined risk management.

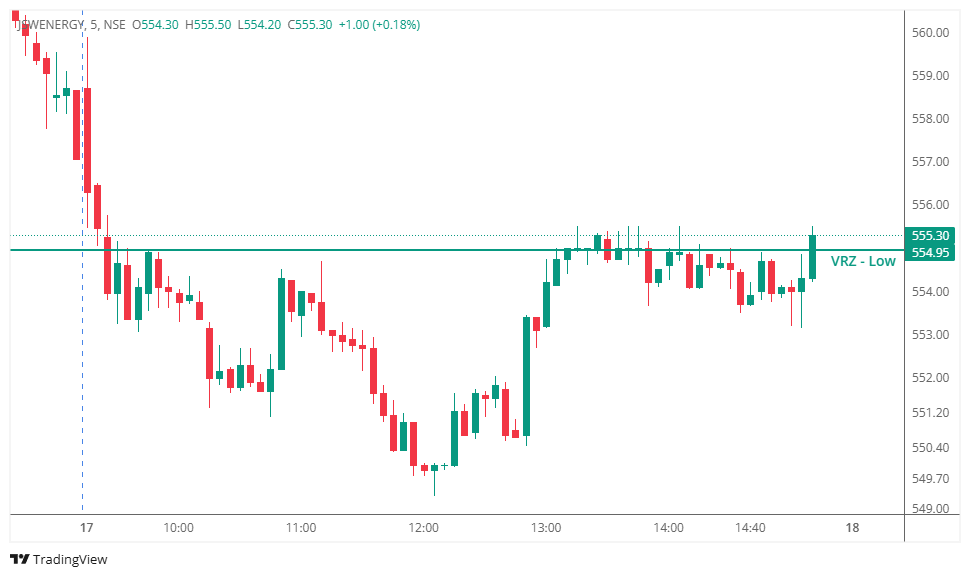

JSWENERGY opened under selling pressure and traded below the ₹554.95 VRZ Low for a significant part of the session.
Later, buyers pushed price back toward the reversal zone and reclaimed the VRZ Low, creating a potential BOF long setup under the Logical Trading System (LTS).
However, the initial reclaim failed to produce sustained bullish continuation.
The recovery from the intraday lows showed improving buyer participation, but the price action around the VRZ Low remained unstable.
📈 Buyers reclaimed the reversal zone.
⚠️ Follow-through remained inconsistent.
📉 Price repeatedly moved around the ₹554.95 level.
🔄 The recovery lacked immediate continuation.
This uncertainty increased the probability of a failed BOF reversal.
The BOF long setup was triggered after price reclaimed the VRZ Low at ₹554.95.
Initially, buyers appeared to be gaining control. However, the bullish momentum could not sustain itself.
Price subsequently slipped back around the reversal zone as sellers regained short-term control. The failure to maintain the reclaim invalidated the bullish BOF setup and triggered the predefined stop loss.
The stock later recovered again, demonstrating why disciplined exits are essential even when price eventually moves in the original expected direction.
The BOF setup failed because buyers were unable to sustain the reclaim above the VRZ Low.
❌ Weak follow-through after the initial reclaim.
❌ Price repeatedly tested the VRZ Low.
❌ Buyers struggled to establish strong higher highs.
❌ Selling pressure returned around the reversal zone.
❌ The reclaim lacked sustained bullish confirmation.
These signals reduced the probability of a successful BOF long trade.
The chart illustrates a failed BOF long attempt followed by a later recovery.
🔻 Sellers initially pushed price below the VRZ Low.
🟢 Buyers recovered sharply from the lower levels.
🟡 Price reclaimed the ₹554.95 zone.
🔄 Momentum then became choppy around the reversal level.
🔴 Sellers managed to push price back toward the lower levels, invalidating the initial BOF setup.
🚀 A stronger recovery appeared later in the session, but only after the original trade had already been invalidated.
This is a good example of why timing and immediate follow-through are critical in BOF trading.
⚠️ A reclaim of support does not guarantee a successful reversal.
📊 BOF setups require confirmation beyond the initial level reclaim.
🔍 Repeated tests of the reversal zone can indicate weak conviction.
🛡️ A predefined stop loss protects capital when the setup loses validity.
🎯 A later recovery does not change the outcome of a trade that was already stopped out.
This trade highlights the importance of accepting an invalidated setup without emotional intervention.
✅ Every BOF setup carries a probability of failure.
✅ A controlled loss is part of systematic trading.
✅ Traders should not hold a losing position simply because price may recover later.
✅ Consistency comes from following the process across multiple trades.
Professional traders evaluate the quality of execution—not just whether the stock eventually moved in their expected direction.
Effective risk management remains the foundation of sustainable trading.
✔️ Entry was based on the predefined BOF structure.
✔️ Risk was established before execution.
✔️ Stop loss was respected when the reclaim failed.
✔️ No averaging down was required.
✔️ Capital remained available for future opportunities.
Small, controlled losses are an essential part of long-term trading consistency.
🌍 Markets constantly test patience, discipline, and risk management.
⚠️ This JSWENERGY BOF Failure demonstrates that reclaiming the VRZ Low alone is not enough. A successful bullish reversal requires strong confirmation and sustained buying pressure above the key zone.
📉 When price repeatedly struggles around the reversal level, the BOF setup can quickly lose its edge.
🛡️ Professional traders focus on managing risk rather than trying to capture every eventual market move.
💪 Trust your process, respect your stop loss, and let disciplined execution—not emotions—guide every trading decision.
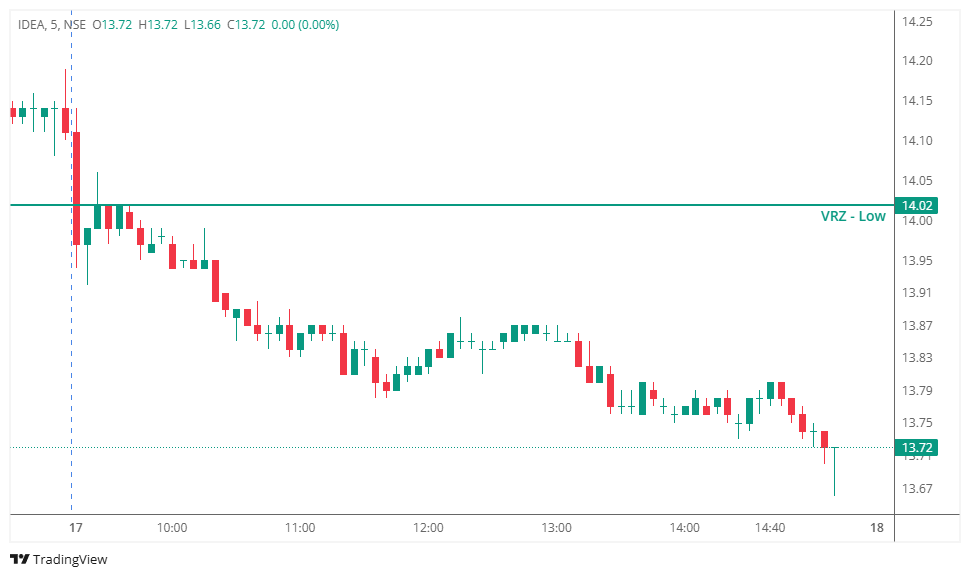

IDEA opened with weakness and quickly moved below the VRZ Low at ₹14.02, placing the key support zone under pressure.
The price action attempted to stabilize around the lower levels, creating the possibility of a bullish BOF reversal if buyers could reclaim the VRZ Low with strong confirmation.
However, buyers failed to sustain the recovery, while sellers continued to dominate the broader intraday structure.
The overall structure remained bearish throughout most of the session.
📉 Price continued forming lower highs.
📉 Recovery attempts remained weak.
📉 Buyers were unable to reclaim ₹14.02 decisively.
📉 Selling pressure continued to push price toward fresh intraday lows.
The lack of a strong bullish reclaim significantly weakened the BOF long setup.
The BOF long idea was based on the expectation that buyers would reclaim the VRZ Low after the breakdown.
However, bullish follow-through failed to develop.
Instead, price remained below the reversal zone and sellers continued controlling the session. As the expected reversal failed to materialize, the predefined stop loss was triggered.
The later decline confirmed that the bearish momentum remained stronger than the attempted recovery.
The BOF setup failed because buyers could not establish sustained control after the support breakdown.
❌ Weak recovery attempts near the VRZ Low.
❌ Price failed to reclaim ₹14.02 convincingly.
❌ Sellers maintained the lower-high structure.
❌ Bullish momentum repeatedly faded.
❌ Fresh intraday lows developed later in the session.
These signals indicated that the expected bullish reversal lacked sufficient strength.
The chart highlights a failed bullish reversal attempt within a broader bearish structure.
🔻 Sellers pushed IDEA below the VRZ Low.
🟡 Buyers attempted to stabilize price around the lower levels.
🟢 Temporary rebounds appeared but lacked continuation.
🔴 Selling pressure returned and pushed price lower.
📉 The session eventually ended near the lower part of the trading range.
This price action demonstrates why a support-zone reaction needs strong confirmation before treating it as a successful BOF reversal.
⚠️ A support breakdown can continue even after a temporary bounce.
📊 A BOF setup requires confirmation and follow-through—not just an initial reaction.
🔍 Failure to reclaim the VRZ level is an important warning sign.
🛡️ Stop losses help control risk when the reversal thesis becomes invalid.
🎯 Consistent execution is more important than trying to predict every market movement.
This trade demonstrates that even a rule-based setup can fail when market conditions do not support the expected reversal.
✅ Every setup carries both winning and losing probabilities.
✅ A controlled loss is part of systematic trading.
✅ Traders should respect predefined invalidation levels.
✅ Emotional reactions should never override the trading plan.
Professional traders focus on executing the process consistently rather than judging the strategy from a single outcome.
Effective risk management remains the foundation of sustainable trading.
✔️ Risk was defined before the trade.
✔️ The setup was evaluated using predefined rules.
✔️ Stop loss was respected when the reversal failed.
✔️ No averaging down was required.
✔️ Capital remained available for future opportunities.
Small, controlled losses help protect trading capital over the long term.
🌍 Markets constantly test patience, discipline, and risk management.
⚠️ This IDEA BOF Failure demonstrates that a reaction from a support zone alone is not enough. A successful BOF long setup requires a strong reclaim of the VRZ Low along with sustained bullish follow-through.
📉 When price remains below the reversal zone and continues forming lower highs, the bullish thesis becomes increasingly vulnerable.
🛡️ Professional traders focus on controlling risk and following their trading plan rather than forcing a reversal.
💪 Trust your process, respect your stop loss, and let disciplined price-action execution—not emotions—guide every trade.
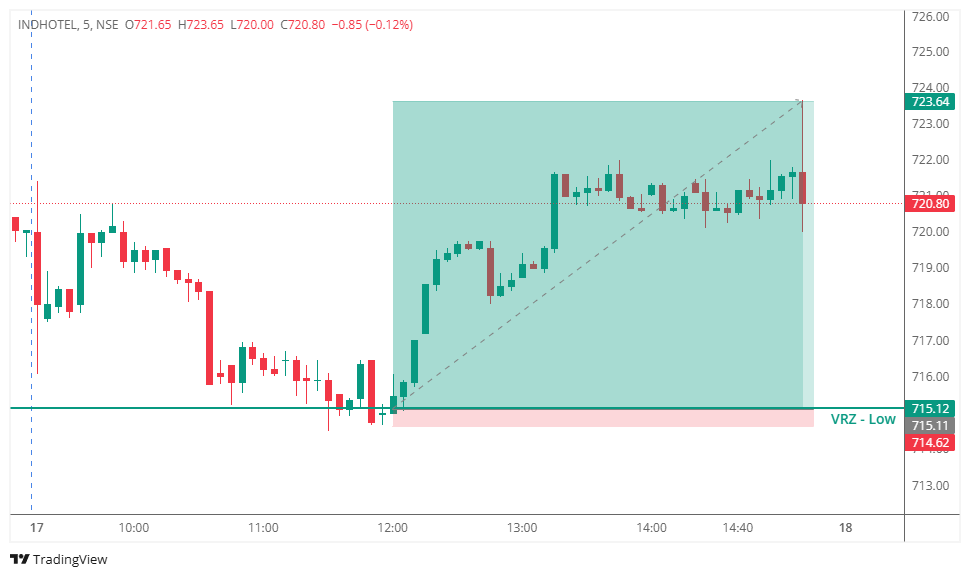

🔻 INDHOTEL tested the VRZ Low, with sellers attempting to push price below the support zone.
⚠️ The breakdown failed to sustain as price reclaimed the VRZ Low.
🟢 This rejection confirmed the bullish BOF setup and created an intraday reversal opportunity.
🟢 Buyers stepped in after the failed breakdown.
📊 Price moved back above the VRZ Low and gradually built bullish momentum.
🚀 The setup delivered a 1.19% bullish move with an exceptional 1:15 Risk-Reward.
🔴 Sellers: Attempted to break below the VRZ Low.
🟡 Breakdown Traders: Became trapped after price reclaimed support.
🟢 Buyers: Regained control and drove the recovery higher.
🎭 The initial breakdown created bearish expectations.
🚨 The failure to sustain below support weakened seller confidence.
📈 As buyers regained control, sentiment shifted from bearish to bullish.
🎯 The key confirmation came when INDHOTEL reclaimed ₹715.12.
🔄 Sustained trading above the VRZ Low validated the breakdown failure.
⚡ Continued upside follow-through strengthened the bullish setup.
🚫 Failed Breakdowns Can Trigger Reversals
A breakdown without follow-through can quickly turn bullish.
🎯 Support Reclaim Is Important
The VRZ Low recovery confirmed improving buyer strength.
🛡️ Defined Risk Supports Discipline
The VRZ Low provided a clear invalidation reference.
⚡ Strong Follow-Through Creates Opportunity
Once buyers took control, the upside move expanded significantly.
📈 After reclaiming the VRZ Low, INDHOTEL developed a stronger bullish structure.
🟢 Price formed higher highs and higher lows during the recovery.
🚀 The improving structure supported continued upside momentum.
⚡ Buying pressure increased after the failed breakdown.
📈 Price continued moving away from the VRZ Low and extended the bullish reversal.
🏆 The setup ultimately delivered a 1.19% upside move with a powerful 1:15 RR.
🔸 The trade became actionable after INDHOTEL failed to sustain the breakdown below ₹715.12.
📈 Buyers reclaimed the zone and maintained control.
⚖️ The confirmed BOF structure delivered a high-reward intraday opportunity with a 1:15 Risk-Reward.
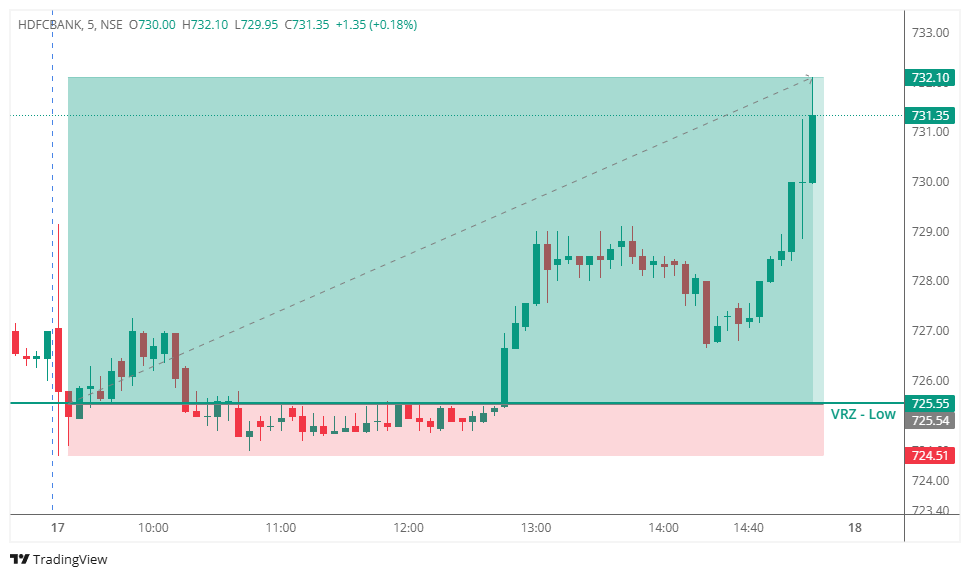

🔻 HDFCBANK tested the VRZ Low, where sellers attempted to push price below support.
⚠️ The breakdown failed to sustain as price recovered and reclaimed the VRZ Low.
🟢 This confirmed the Breakdown Failure (BOF) setup and created a bullish intraday opportunity.
🟢 Buyers gradually gained control after the failed breakdown.
📊 Price moved back above ₹725.55 and built a stronger bullish structure.
🚀 The setup delivered a 0.90% bullish move with an impressive 1:6 Risk-Reward.
🔴 Sellers: Attempted to break the VRZ Low.
🟡 Breakdown Traders: Became trapped after price reclaimed support.
🟢 Buyers: Regained control and drove the upside move.
🎭 The initial breakdown created bearish expectations.
🚨 When price failed to sustain below the VRZ Low, seller confidence weakened.
📈 The recovery above support shifted sentiment toward buyers and strengthened the bullish reversal.
🎯 The key confirmation came when HDFCBANK reclaimed the ₹725.55 VRZ Low.
🔄 Sustained trading above the zone validated the bullish BOF structure.
⚡ Strong follow-through later in the session confirmed buyer dominance.
🚫 Failed Breakdowns Can Reverse Quickly
A breakdown without follow-through can turn into a strong bullish reversal.
🎯 Support Reclaim Matters
Regaining the VRZ Low highlighted improving buyer strength.
🛡️ Defined Risk Improves Execution
The VRZ Low provided a clear reference for setup invalidation.
⚡ Momentum Drives Follow-Through
Once buyers gained control, the upside move expanded.
📈 After reclaiming the VRZ Low, HDFCBANK developed a stronger sequence of higher highs and higher lows.
🟢 Buyers maintained control as price continued moving away from the support zone.
🚀 The bullish structure supported further upside momentum.
⚡ Buying pressure strengthened during the session.
📈 Price continued higher and approached the upper part of the trading range.
🏆 The setup ultimately produced a 0.90% upside move with a strong 1:6 RR.
🔸 The trade became actionable after HDFCBANK failed to sustain the breakdown below ₹725.55.
📈 Buyers reclaimed the zone and maintained bullish control.
⚖️ The confirmed BOF structure offered a disciplined setup with defined risk and strong reward potential.

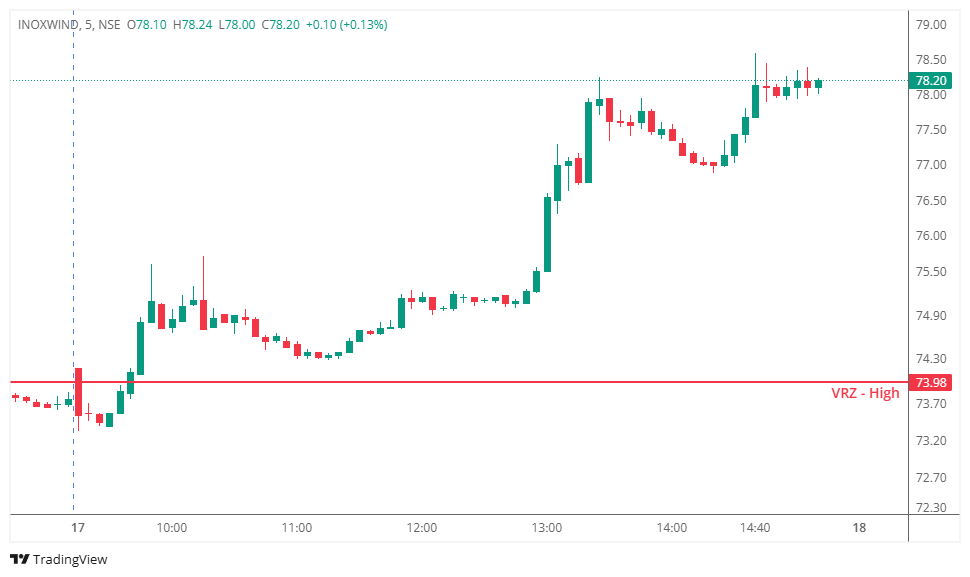

INOXWIND initially traded around the VRZ High before buyers pushed price above the ₹73.98 resistance zone.
The breakout created an opportunity for a potential BOF short if price failed to sustain the breakout and returned below the reversal zone.
However, the expected bearish reversal did not develop. Buyers continued to absorb selling pressure and gradually pushed the stock toward higher levels.
The price action showed increasing bullish strength after the VRZ High breakout.
📈 Price began forming higher highs and higher lows.
📈 Buyers maintained control above the reversal zone.
📈 Pullbacks remained shallow and were followed by fresh buying.
This structure reduced the probability of a sustained bearish reversal.
The BOF short setup was triggered around the VRZ High after the initial breakout showed signs of rejection.
However, sellers failed to generate meaningful downside continuation.
Instead, buyers reclaimed control and pushed the stock back above the key zone. The continued bullish momentum eventually invalidated the bearish setup and triggered the predefined risk level.
The stock then extended significantly higher during the session.
The setup failed because sellers could not sustain the rejection near the VRZ High.
❌ Weak bearish follow-through after the initial rejection.
❌ Buyers quickly regained momentum.
❌ Price remained comfortably above ₹73.98.
❌ Higher highs continued to develop.
❌ Pullbacks were absorbed by buyers.
❌ Bullish momentum accelerated during the afternoon session.
These signals indicated that the breakout had genuine buying strength rather than being a sustained false breakout.
The chart highlights a failed bearish reversal followed by strong bullish continuation.
🔻 Sellers attempted to push price lower after the breakout.
🟡 The downside reaction remained limited.
🟢 Buyers regained control above the VRZ High.
📈 Strong bullish candles appeared as momentum expanded.
🚀 Price eventually moved toward the ₹78–₹78.50 region.
This demonstrates why a breakout rejection must be supported by strong bearish follow-through before expecting a successful BOF reversal.
⚠️ An initial rejection does not guarantee a successful BOF.
📊 Price acceptance above the VRZ can invalidate a bearish reversal thesis.
🔍 Strong higher-high formation is an important warning against holding a short position.
🛡️ Predefined stop losses help limit losses when market structure changes.
🎯 The objective is not to predict every reversal but to execute the strategy with discipline.
This setup highlights an important trading principle: a valid setup can still fail.
✅ Follow the predefined entry rules.
✅ Accept the invalidation without hesitation.
✅ Avoid averaging into a losing position.
✅ Do not fight strong directional momentum.
✅ Preserve capital for the next high-probability opportunity.
Professional trading is about managing probabilities—not achieving a perfect win rate.
Capital preservation remains the priority when a BOF reversal fails.
✔️ Risk should be defined before entry.
✔️ Stop loss should be respected according to the trading plan.
✔️ No emotional re-entry should follow a failed setup.
✔️ Strong momentum should be treated as information, not resistance to the trade thesis.
Small, controlled losses allow traders to remain in the game for future opportunities.
🌍 Markets constantly test patience, discipline, and risk management.
⚠️ This INOXWIND BOF Failure demonstrates that an initial rejection near resistance is not enough. A successful BOF short requires sustained selling pressure and clear bearish confirmation.
📈 When buyers continue creating higher highs and defending the breakout zone, the bearish setup loses its edge.
🛡️ Professional traders focus on controlling risk rather than trying to avoid every losing trade.
💪 Trust the process, respect your risk limits, and allow price action—not emotions—to guide your decisions.
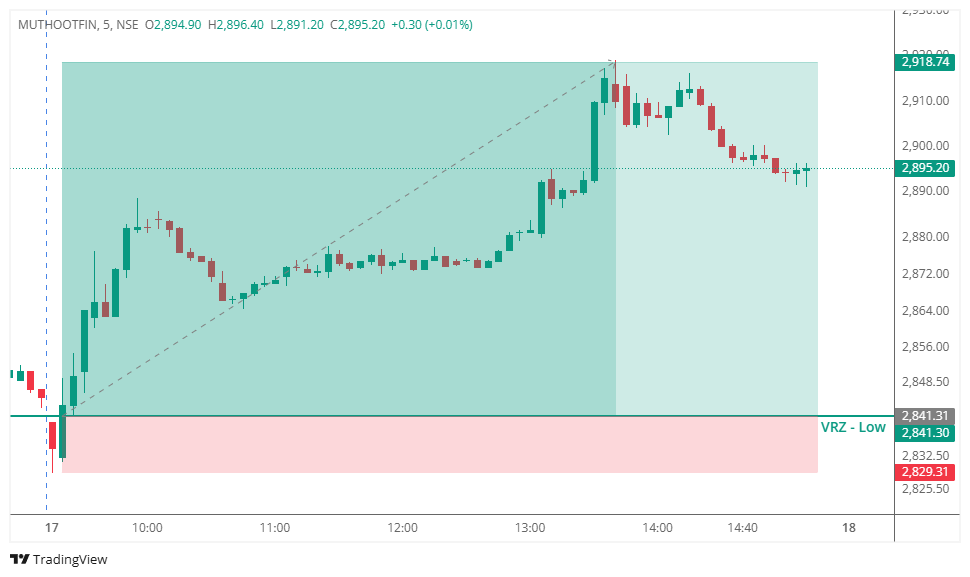
🔹 Stock: Muthoot Finance Ltd. (MUTHOOTFIN)
🏦 Sector: Financial Services
📈 Trade Type: Intraday
🕒 VRZ Marking Time Frame: 30 Minutes
⏱️ Trading Time Frame: 5 Minutes
🎯 Setup Type: Breakdown Failure (BOF)
🟢 Zone: VRZ Low – ₹2,841.30

🟢 Buyers stepped in strongly after the failed breakdown.
📊 Price reclaimed the VRZ Low and developed sustained upside momentum.
🚀 The setup delivered a 2.73% bullish move with an impressive 1:6 Risk-Reward.
🔴 Sellers: Attempted to break below the VRZ Low.
🟡 Breakdown Traders: Became trapped when price moved back above support.
🟢 Buyers: Regained control and drove the bullish reversal higher.
🎭 The initial breakdown created bearish expectations.
🚨 When price failed to sustain below the VRZ Low, seller confidence weakened.
📈 Trapped sellers faced pressure while fresh buying participation strengthened the recovery.
🎯 The key confirmation came when MUTHOOTFIN reclaimed the ₹2,841.30 VRZ Low.
🔄 Price continued holding above the support zone, validating the bullish reversal.
⚡ Strong follow-through confirmed the strength of the BOF setup.
🚫 Failed Breakdowns Can Trigger Strong Recoveries
A breakdown without follow-through can quickly reverse upward.
🎯 Support Reclaim Matters
The VRZ Low recovery highlighted strengthening buyer control.
🛡️ Defined Risk Supports Discipline
The VRZ Low provided a clear reference for setup invalidation.
⚡ Momentum Strengthens Follow-Through
Once buyers gained control, the upside move expanded significantly.
📈 After reclaiming the VRZ Low, MUTHOOTFIN developed a strong bullish structure.
🟢 Price continued forming higher highs and higher lows during the recovery.
🚀 The sustained structure supported further upside momentum.
⚡ Buying pressure increased following the failed breakdown.
📈 Price moved strongly away from the VRZ Low and extended the bullish reversal.
🏆 The setup ultimately delivered a 2.73% upside move with a strong 1:6 RR.
🔸 The trade became actionable after MUTHOOTFIN failed to sustain the breakdown below ₹2,841.30.
📈 Buyers reclaimed the support zone and maintained bullish control.
⚖️ The confirmed BOF structure provided a disciplined entry with defined risk and strong reward potential.
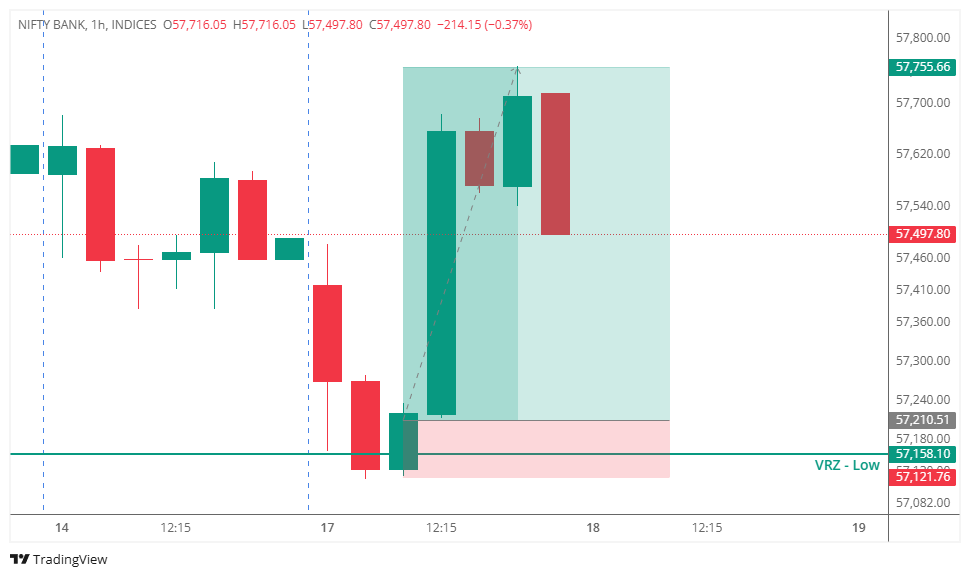

🔻 NIFTY BANK moved sharply lower toward the VRZ Low and briefly traded around/below the 57,158.10 support zone.
⚠️ Sellers attempted to extend the breakdown, but the move failed to gain follow-through.
🟢 Strong buying interest emerged around the VRZ Low, pushing the index back above the key support area.
📈 The following 1-hour candles showed increasing bullish momentum, confirming that buyers were regaining control.
✅ This rejection of lower levels established a classic Breakout Failure (BOF) setup.
🚀 As breakdown sellers became trapped and fresh buying entered the market, NIFTY BANK delivered a 0.95% upside move, achieving an exceptional 1:6 risk-reward ratio.
🔎 The index approached the VRZ Low following a clear bearish move.
🔻 Sellers attempted to continue the downside momentum through the support zone.
🟢 However, price failed to sustain below the VRZ Low.
🔄 Buyers quickly reclaimed the key level and shifted short-term momentum toward the upside.
📈 Strong bullish candles followed the rejection, confirming the strength of the reversal.
🎯 Price subsequently advanced toward the projected upside target, completing the successful BOF move.
Initially, market participants could have expected:
🔻 Further downside continuation.
📉 A confirmed breakdown below the VRZ Low.
🐻 Sellers to remain in control.
But the price action told a different story.
⚠️ The breakdown failed to sustain.
😮 Breakdown sellers became trapped.
🟢 Buyers defended the VRZ Low aggressively.
🔄 Price reclaimed the support zone.
🚀 Increasing bullish momentum forced sellers to exit while attracting fresh buyers.
📈 This shift from bearish sentiment to bullish control powered the successful reversal.
🔴 Sellers initially attempted to push NIFTY BANK below the VRZ Low.
🟢 Buyers absorbed the selling pressure around 57,158.10.
⚖️ The failed breakdown weakened seller conviction.
🔄 As price reclaimed the zone, trapped short positions added further buying pressure.
📈 Fresh buyers joined the move as bullish momentum strengthened.
🚀 The combination of short covering and fresh buying accelerated the upside move.
🔹 Strong VRZ Low Reaction
The predefined support zone attracted significant buyer participation.
🔹 Failed Breakdown
Price could not sustain below the VRZ Low, invalidating the bearish continuation attempt.
🔹 Bullish Reclaim
The recovery above 57,158.10 provided confirmation of the reversal.
🔹 Momentum Confirmation
Successive bullish candles demonstrated improving buyer control.
🔹 Exceptional Risk-Reward
The setup delivered a 0.95% move with an impressive 1:6 RR.
🎯 A Breakdown Needs Follow-Through
A temporary move below support does not automatically confirm a genuine breakdown.
🔍 Watch the Reaction at VRZ Levels
A strong rejection can reveal that buyers are defending the predefined zone.
📈 Reclaim Adds Confirmation
Waiting for price to recover above the failed breakdown area can improve setup confirmation.
⚡ Trapped Sellers Can Fuel Momentum
When a breakdown fails, short sellers may exit positions, adding fuel to the bullish reversal.
💰 Risk-Reward Matters
A clearly defined invalidation level can create highly asymmetric trade opportunities.
✅ Identify important VRZ levels before the trade.
✅ Monitor price behavior around the VRZ Low.
✅ Never assume every breakdown will continue.
✅ Look for rejection and bullish reclaim confirmation.
✅ Define the stop-loss before entering the position.
✅ Maintain disciplined risk management.