
Select a trading day to view all Scanner results, chart evidence, and market explanations.
8 Scanners Available
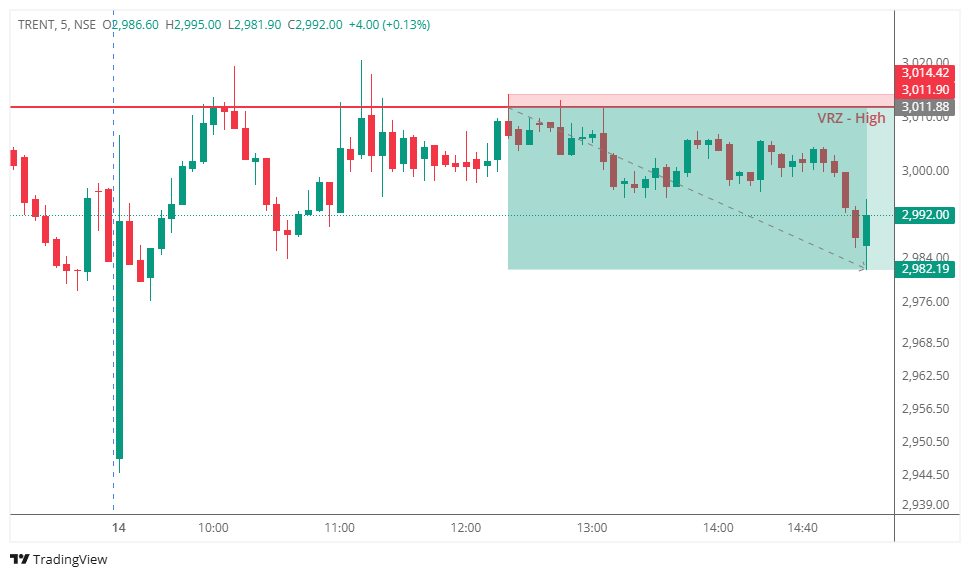

🟢 TRENT moved toward the ₹3,011.88 VRZ High and tested the resistance area.
⚠️ Buyers were unable to establish sustained acceptance above the zone.
🔴 Selling pressure emerged around the VRZ High and price began moving away from resistance.
📉 The failed breakout shifted the short-term setup from bullish continuation to a potential bearish reversal.
🔄 As price remained below the VRZ High, the Breakout Failure (BOF) setup gained confirmation.
🎯 The setup delivered a strong 0.99% downside move with an exceptional 1:11 RR.
🔎 TRENT repeatedly interacted with the resistance area before the reversal developed.
🟢 Buyers attempted to maintain upward momentum near ₹3,011.88.
🚨 The price action failed to sustain above the resistance zone.
🔴 Sellers gradually took control after the rejection.
📉 Price moved lower with increasing bearish pressure.
🎯 The downside move extended toward the ₹2,982.19 area, completing the planned setup.
Initially, traders could have expected:
🟢 A breakout above the VRZ High.
📈 Continuation toward higher levels.
🚀 Buyers to maintain control after testing resistance.
But the market delivered a different outcome.
⚠️ The breakout attempt failed.
😮 Buyers were unable to sustain the higher prices.
🔴 Sellers regained control near the VRZ High.
📉 Price started forming a bearish intraday structure.
💥 The shift in market control supported the successful BOF reversal.
🟢 Buyers pushed TRENT toward the resistance zone.
🔴 Sellers absorbed the buying pressure around ₹3,011.88.
⚖️ Failure to sustain above the VRZ High weakened buyer conviction.
🔄 As price moved away from resistance, bullish positions came under pressure.
📉 Sellers gained momentum and drove price toward the downside target.
🎯 This transition from buyer control to seller control created the successful bearish BOF opportunity.
🔹 Strong VRZ High Resistance
The ₹3,011.88 area acted as a key resistance where buying momentum failed.
🔹 Failed Breakout
Price could not sustain above the predefined VRZ High.
🔹 Bearish Rejection
The rejection from resistance confirmed weakening buyer strength.
🔹 Downside Momentum
Once the reversal developed, price continued moving lower toward the target.
🔹 Exceptional Risk-Reward
The setup delivered an impressive 1:11 RR, providing substantial reward relative to the defined risk.
🎯 A Resistance Breakout Needs Follow-Through
A test or temporary move above resistance does not automatically confirm a successful breakout.
🔍 Watch Price Behaviour at VRZ High
Repeated hesitation near resistance can indicate that buyers are struggling to maintain control.
⚠️ Failed Breakouts Can Create Strong Reversals
When price cannot sustain above resistance, trapped buyers can contribute to downside pressure.
📉 Confirmation Improves Trade Quality
The rejection and continued movement below the VRZ High strengthened the bearish BOF setup.
⚖️ Risk-Reward Is Critical
A clearly defined invalidation level can create opportunities with highly favourable risk-reward potential.
✅ Mark the VRZ High before the trading session.
✅ Monitor price behaviour around the predefined resistance zone.
✅ Avoid assuming every resistance breakout will continue.
✅ Look for rejection and failure to sustain above the VRZ High.
✅ Watch for weakening buyer momentum.
✅ Wait for bearish confirmation before entering.
✅ Define the stop-loss before executing the trade.
✅ Maintain disciplined risk management throughout the setup.
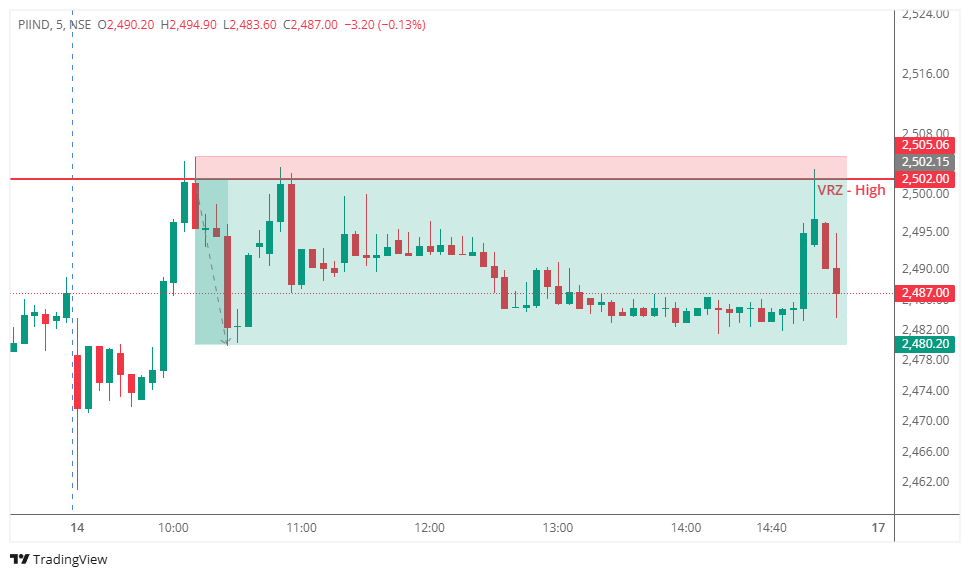

🟢 PIIND moved toward and briefly tested the ₹2,502.00 VRZ High.
⚠️ Buyers were unable to sustain price above the resistance zone.
🔴 Sellers emerged near the VRZ High and pushed price back below the key level.
📉 The failed breakout created a bearish reversal opportunity.
🔄 As price continued to remain below the resistance zone, the Breakout Failure (BOF) setup gained confirmation.
🎯 The setup eventually delivered a 0.87% downside move with a strong 1:7 RR.
🔎 Price had already shown repeated interaction with the VRZ High, indicating strong resistance around ₹2,502.00.
🟢 Buyers attempted another move toward the resistance zone.
🚨 The upside attempt again failed to produce sustained acceptance above the VRZ High.
🔴 Selling pressure increased after the rejection.
📉 Price moved lower and gradually shifted the short-term structure in favour of sellers.
🎯 The bearish move extended toward the ₹2,480.20 area, completing the planned trade objective.
Initially, traders could have expected:
🟢 A clean breakout above ₹2,502.00.
📈 Continuation of the bullish move.
🚀 Buyers to establish control above the VRZ High.
But the market delivered a different outcome.
⚠️ The breakout failed to sustain.
😮 Breakout buyers were trapped near the resistance.
🔴 Sellers regained control.
📉 Price returned below the VRZ High and continued lower.
💥 The trapped long positions helped reinforce the bearish reversal.
🟢 Buyers attempted to push PIIND through the VRZ High.
🔴 Sellers absorbed the buying pressure around ₹2,502.00.
⚖️ Failure to sustain above the zone weakened buyer conviction.
🔄 As price slipped back below resistance, breakout traders were forced to reassess their positions.
📉 Seller participation increased and price moved toward the downside target.
🎯 This shift in control converted the failed breakout into a successful bearish BOF trade.
🔹 Strong VRZ High Resistance
₹2,502.00 acted as an important resistance area where buying momentum failed.
🔹 Failed Breakout
Price could not sustain above the VRZ High, invalidating the bullish breakout attempt.
🔹 Bearish Rejection
The rejection from the zone provided confirmation of increasing seller pressure.
🔹 Downside Follow-Through
Price continued lower after the failed breakout instead of reclaiming the resistance.
🔹 Excellent Risk-Reward
The setup delivered a strong 1:7 RR, providing significant reward relative to the defined risk.
🎯 A Breakout Needs Follow-Through
A temporary move above resistance is not enough to confirm a genuine breakout.
🔍 Study the Reaction at VRZ High
Repeated rejection around a predefined resistance zone can reveal weakening buyer strength.
⚠️ Watch for Trapped Breakout Buyers
When price falls back below resistance after a failed breakout, trapped buyers can contribute to further selling pressure.
📉 Wait for Confirmation
The move back below the VRZ High strengthened the bearish BOF signal.
⚖️ Let Risk Define the Trade
A clear invalidation level allows traders to participate while keeping risk controlled.

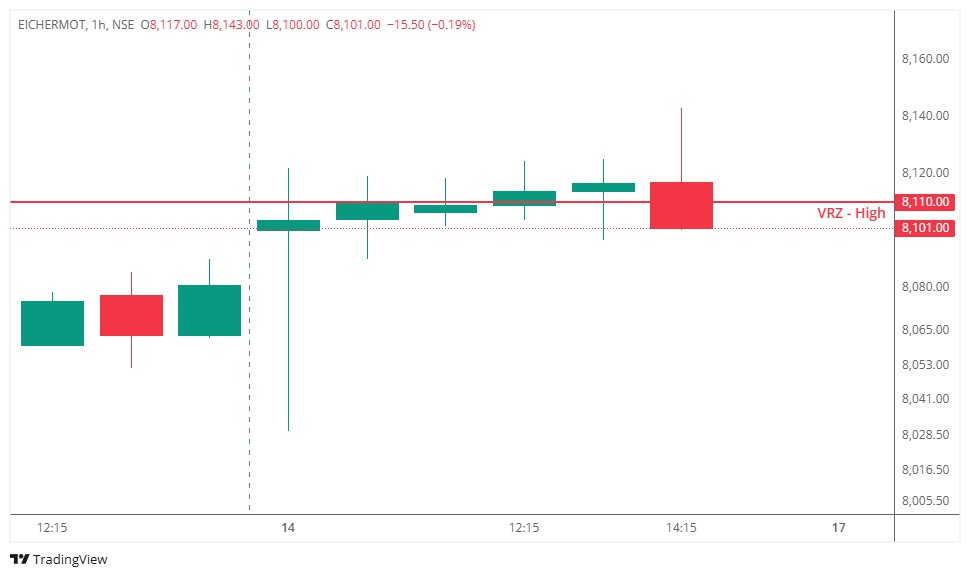

📍 EICHERMOT approached the 1 Hour VRZ High at ₹8,110 and broke above the marked resistance zone, creating the initial breakout.
📈 Price moved above ₹8,110 and showed temporary acceptance on the upside.
⚠️ However, the breakout could not sustain its bullish momentum.
🐻 Sellers stepped in near the higher levels and started pushing price back toward the VRZ High.
📉 The decisive red candle rejected the breakout and closed at ₹8,101, back below the ₹8,110 VRZ High.
🚨 This move back below the resistance confirmed that the upside breakout had failed.
🎯 Result: The breakout failed and produced a valid Bearish Breakout Failure (BOF) setup.
📈 The initial move above ₹8,110 suggested a potential bullish breakout.
⚠️ But the market failed to maintain sustained acceptance above the VRZ High.
🐻 Selling pressure eventually forced price back below the breakout level.
📉 The close at ₹8,101 was particularly important because price finished below ₹8,110.
🎯 This converted the apparent bullish breakout into a failed breakout structure.
🕯️ The candles above ₹8,110 showed that buyers were attempting to hold the breakout.
⚠️ However, the final bearish candle changed the structure.
📉 Price traded as high as ₹8,143 before reversing sharply.
🐻 The candle closed at ₹8,101, below the VRZ High of ₹8,110.
🚨 This rejection from the higher level demonstrated that sellers were able to overpower the breakout attempt.
🎯 ₹8,110 rejection + close below ₹8,110 = key BOF confirmation.
🐂 Buyer Strength: Initially strong — buyers pushed price above ₹8,110.
🐻 Seller Strength: Increasing — sellers rejected the breakout and forced price back below the zone.
⚖️ Market Control: Shifted from buyers to sellers after the failed breakout.
📌 The inability of buyers to sustain price above ₹8,110 was the critical weakness in the bullish breakout.
✅ Breakout above VRZ High: Confirmed.
❌ Sustained acceptance above ₹8,110: Failed.
✅ Rejection from higher levels: Confirmed.
✅ Bearish candle closing below ₹8,110: Confirmed.
✅ Breakout failure: Confirmed.
🎯 Conclusion: The chart provided the necessary evidence for a bearish Breakout Failure setup.
📍 Once the breakout failed, ₹8,110 became an important resistance reference.
🐻 Sellers demonstrated their willingness to defend the area after price moved back below the VRZ High.
📉 The move from the ₹8,143 high toward ₹8,101 close showed clear rejection of the breakout attempt.
💡 This is the core characteristic of a Breakout Failure — price breaks resistance but fails to sustain the breakout and returns back below the zone.
🐂 Traders entering long purely because price crossed above ₹8,110 were exposed to a potential breakout trap.
📉 The later reversal back below ₹8,110 invalidated the bullish breakout thesis.
🐻 Once the failed breakout was confirmed, trapped buyers could add to the selling pressure as they exited their positions.
🎯 The lesson: A breakout is not confirmed simply because price trades above resistance. Sustained acceptance is essential.
For a valid bearish BOF, traders would ideally look for:
➡️ Breakout above the VRZ High.
➡️ Failure to sustain above the resistance.
➡️ Rejection from higher levels.
➡️ Strong bearish candle formation.
➡️ Close back below ₹8,110.
➡️ Follow-through selling below the failed breakout zone.
✅ EICHERMOT displayed the critical breakout → rejection → close below VRZ High sequence.
🛑 Never short merely because price touches or slightly rejects a resistance zone.
📊 Wait for the market to prove that the breakout has failed.
⚠️ In this setup, the important confirmation came when price moved back below ₹8,110.
🎯 A disciplined trader focuses on confirmation rather than predicting the reversal.
💰 Proper stop-loss placement and position sizing remain essential because even a confirmed BOF can fail.
🧠 Professional traders distinguish between a breakout and a sustained breakout.
📈 EICHERMOT initially moved above ₹8,110.
⚠️ But the market could not maintain that bullish acceptance.
🐻 The rejection and close back below ₹8,110 revealed that the breakout lacked sufficient follow-through.
📊 This is why price-action confirmation is more important than simply chasing the first breakout candle.
🎯 Trade the failure of the breakout—not the assumption that every breakout will fail.
📍 EICHERMOT provided a clear example of a successful Bearish Breakout Failure at the 1 Hour VRZ High of ₹8,110.
📈 Price initially broke above the resistance and reached a high of ₹8,143.
🐻 Sellers then rejected the breakout.
📉 Price returned below ₹8,110 and closed at ₹8,101.
🚨 The bullish breakout was therefore invalidated.
🎯 The key lesson: When price breaks resistance but cannot sustain above it and closes back below the zone, the breakout failure becomes the signal.
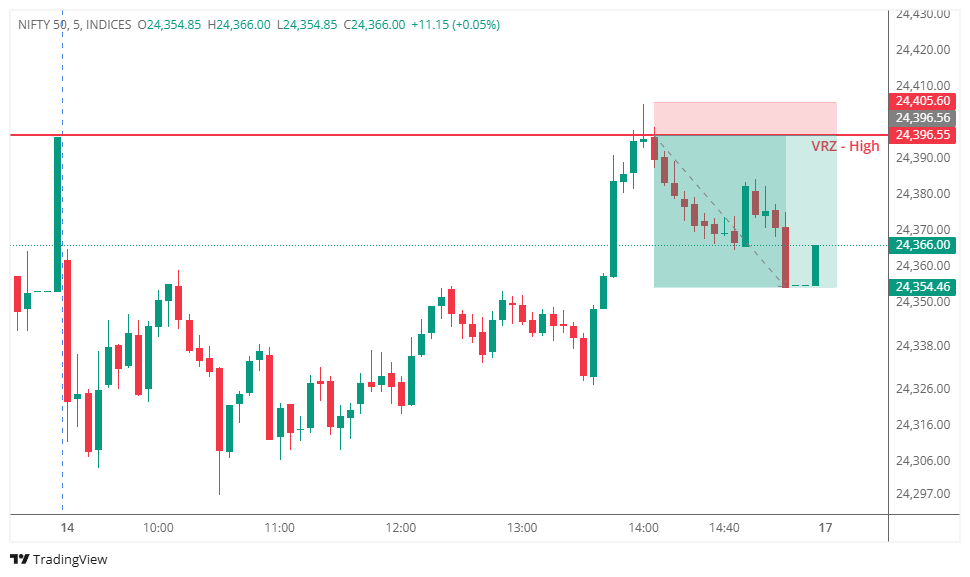

🔹 NIFTY 50 tested the VRZ High, with buyers attempting to sustain a breakout above resistance.
⚠️ Price failed to hold above the zone and moved back below the VRZ High.
🔻 This rejection confirmed the bearish BOF setup and created an intraday reversal opportunity.
🔻 Sellers gained control following the failed breakout.
📊 Price gradually moved lower while remaining below the VRZ High.
🎯 The setup delivered a 0.17% bearish move with a disciplined 1:4 Risk-Reward.
🟢 Buyers: Attempted to push NIFTY 50 above the VRZ High.
🟡 Breakout Traders: Became trapped when price slipped back below resistance.
🔴 Sellers: Took control after the rejection and drove the downside move.
🎭 The breakout initially created bullish expectations.
🚨 The failed breakout weakened buyer confidence and trapped breakout participants.
📉 Selling pressure then increased as market control shifted toward sellers.
🎯 The key confirmation came when NIFTY 50 failed to sustain above 24,396.55.
🔻 The move back below the VRZ High validated the breakout failure.
⚡ Continued bearish price action supported the trade setup.
🚫 Failed Breakouts Can Reverse
A breakout without follow-through can quickly turn into a bearish move.
🎯 Resistance Rejection Matters
The VRZ High rejection highlighted weakening buying pressure.
🛡️ Defined Risk Supports Discipline
The VRZ High provided a clear reference for setup invalidation.
⚡ Confirmation Improves Execution
Waiting for the rejection helped validate the bearish BOF structure.
📉 After the rejection, NIFTY 50 developed a short-term bearish structure.
🔻 Price remained below the VRZ High as sellers maintained pressure.
🐻 The downside structure supported the continuation of the reversal.
🚨 Selling pressure increased after the failed breakout.
📉 Price moved away from the VRZ High and extended the bearish move.
🏆 The setup achieved a 0.17% downside move with a strong 1:4 RR.
🔸 The trade became actionable after NIFTY 50 failed to sustain the breakout above 24,396.55.
📉 Sellers maintained control during the reversal.
⚖️ The confirmed BOF structure provided a defined-risk intraday opportunity.
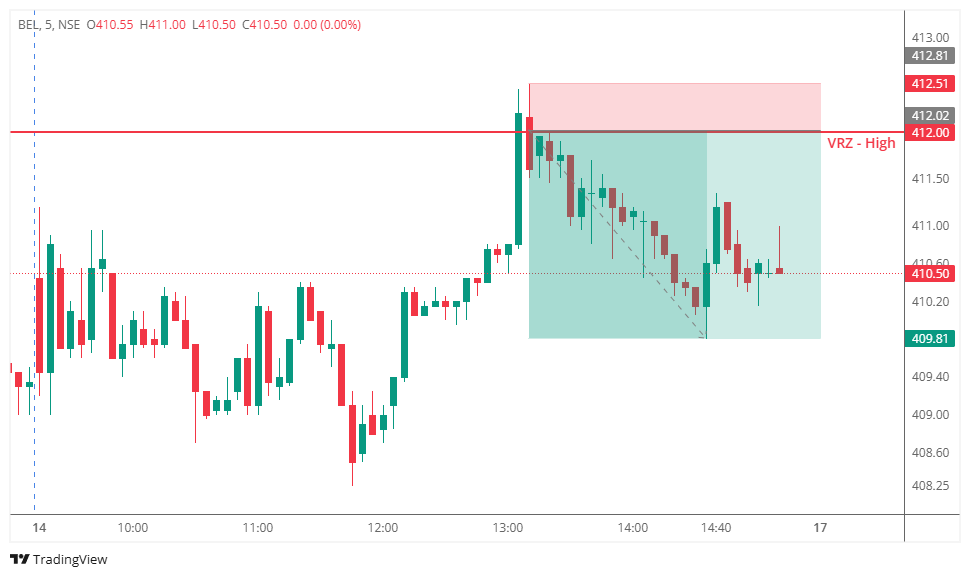

🟢 BEL briefly pushed above the ₹412.00 VRZ High, indicating an attempted bullish breakout.
⚠️ The breakout lacked follow-through and buyers failed to sustain price above the resistance zone.
🔴 Sellers quickly stepped in and pushed price back below ₹412.00.
📉 The rejection converted the failed breakout into a bearish Breakout Failure (BOF) setup.
🎯 Price subsequently moved lower toward the ₹409.81 area, delivering a 0.54% bearish move with 1:4 RR.
🔍 Before reaching the VRZ High, BEL was showing strong upward momentum.
🟢 Buyers drove price sharply toward the resistance zone.
🚨 Once price crossed ₹412.00, bullish momentum started weakening.
🔴 The inability to hold above the zone became the first warning sign.
📉 Consecutive bearish candles confirmed increasing seller pressure.
🔄 Price moved back below the VRZ High and shifted short-term momentum toward the downside.
Initially, market participants could have expected:
🟢 A sustained breakout above ₹412.00.
📈 Continuation of the bullish momentum.
🚀 Buyers to extend the upward move.
But the price action delivered the opposite outcome.
⚠️ The breakout failed.
😮 Breakout buyers became trapped above the VRZ High.
🔴 Sellers regained control after the rejection.
📉 The trapped long positions added further selling pressure.
🎯 This sentiment shift supported the successful bearish BOF move.
🟢 Buyers attempted to establish acceptance above ₹412.00.
🔴 Sellers rejected the higher prices around the VRZ High.
⚖️ Once price returned below the resistance, buyer conviction weakened.
🔄 Trapped breakout positions contributed to additional downside pressure.
📉 Sellers then controlled the short-term price action and drove BEL toward the target zone.
🔹 VRZ High Rejection
The predefined resistance zone attracted strong selling pressure.
🔹 Failed Breakout
Price could not sustain above ₹412.00, invalidating the bullish breakout attempt.
🔹 Bearish Reclaim
Price returned below the VRZ High, confirming the failure of the breakout.
🔹 Seller Momentum
Follow-through bearish candles demonstrated increasing downside participation.
🔹 Favorable Risk-Reward
The setup provided controlled risk with a strong 1:4 RR opportunity.
🎯 Don't Chase Every Breakout
A move above resistance does not automatically confirm a genuine breakout.
🔍 Watch for Acceptance Above VRZ
If price cannot sustain above the VRZ High, the breakout deserves closer attention.
⚠️ Failed Breakouts Can Reverse Quickly
When buyers become trapped above resistance, their exits can accelerate the downside move.
📉 Wait for the Rejection
The return below the VRZ High provided stronger confirmation of the bearish BOF setup.
⚖️ Risk-Reward Matters
A clearly defined invalidation level can allow a valid setup to offer attractive risk-reward potential.

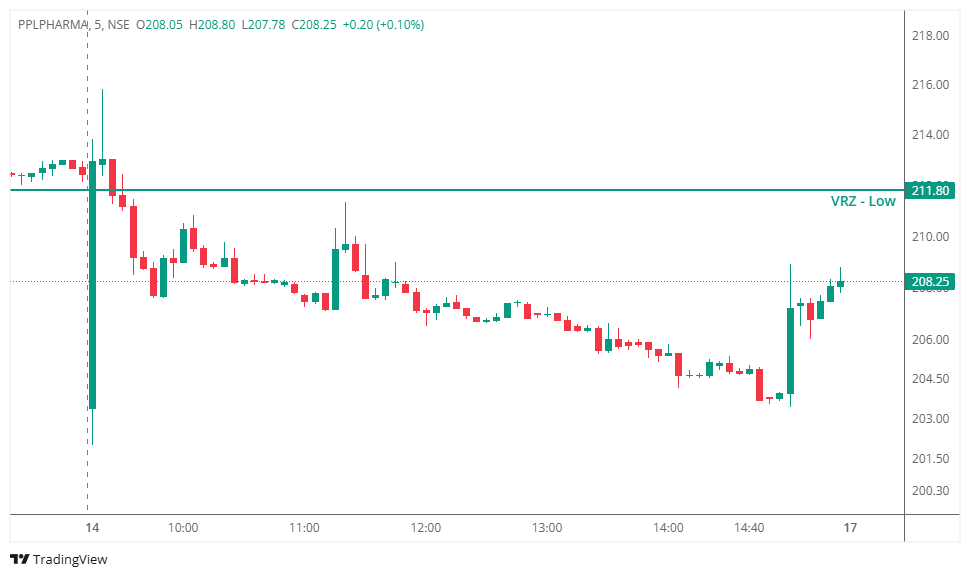

PPLPHARMA opened near the VRZ Low and quickly experienced strong selling pressure.
Price moved below the ₹211.80 VRZ Low, confirming weakness around the support zone. Buyers later attempted to recover from the intraday lows, creating the possibility of a BOF long setup.
However, the recovery remained below the VRZ Low for most of the session, indicating that buyers were unable to reclaim the key reversal zone with sufficient strength.
The initial recovery from the lower levels suggested that selling pressure could be weakening.
However, the broader price structure remained bearish.
📉 Price continued forming lower highs.
📉 The VRZ Low remained overhead as resistance.
📉 Buyers struggled to regain the ₹211.80 zone.
The absence of a strong reclaim significantly weakened the bullish reversal thesis.
The BOF long setup was considered around the VRZ Low as buyers attempted to recover after the breakdown.
However, bullish follow-through failed to develop.
Instead, price remained below the reversal zone and sellers maintained control throughout most of the session.
The predefined risk management level was therefore respected when the expected reversal failed to materialize.
The BOF setup failed because buyers could not reclaim and sustain the VRZ Low.
❌ Price remained below ₹211.80.
❌ Buyers failed to establish a sustained bullish reversal.
❌ Lower highs continued to dominate the structure.
❌ Sellers maintained control for most of the session.
❌ The VRZ Low continued acting as resistance.
These conditions reduced the probability of a successful BOF long trade.
The chart illustrates a failed bullish reversal attempt followed by a late recovery.
🔻 Sellers pushed PPLPHARMA below the VRZ Low.
🟠 Price continued drifting lower after the breakdown.
🟢 Buyers eventually produced a sharp late-session recovery.
🔵 Despite the rebound, price remained below the ₹211.80 VRZ Low.
⭐ The late recovery came without a confirmed reclaim of the key reversal zone, highlighting why confirmation is important in BOF trading.
⚠️ A bounce from lower levels does not automatically qualify as a successful BOF reversal.
📊 Reclaiming the key VRZ level is critical for bullish confirmation.
🔍 Lower highs can signal that sellers still control the broader structure.
🛡️ Predefined stop losses help control risk when the reversal thesis fails.
🎯 Professional trading is about executing probabilities rather than predicting every market move.
This setup highlights the importance of remaining disciplined when a reversal does not develop as expected.
✅ Every BOF setup carries a probability of failure.
✅ A losing trade does not invalidate a rule-based strategy.
✅ Traders must accept when market structure disagrees with the setup.
✅ Emotional decisions should never replace predefined trading rules.
Risk management remains the foundation of sustainable trading.
✔️ The setup was evaluated using predefined rules.
✔️ Risk was defined before execution.
✔️ The invalidation level was respected.
✔️ No averaging down was required.
✔️ Capital remained available for future opportunities.
Small, controlled losses are part of professional trading.
🌍 Markets constantly test patience, discipline, and risk management.
⚠️ This PPLPHARMA BOF Failure demonstrates that a recovery after a breakdown is not enough. Buyers need to reclaim the VRZ Low and show strong follow-through before a bullish reversal can be considered confirmed.
📉 When the key zone continues acting as resistance, the BOF long thesis remains vulnerable to failure.
🛡️ Professional traders focus on protecting capital and following their trading plan rather than forcing a reversal.
💪 Trust the process, respect risk limits, and allow disciplined execution—not emotions—to guide every trade.
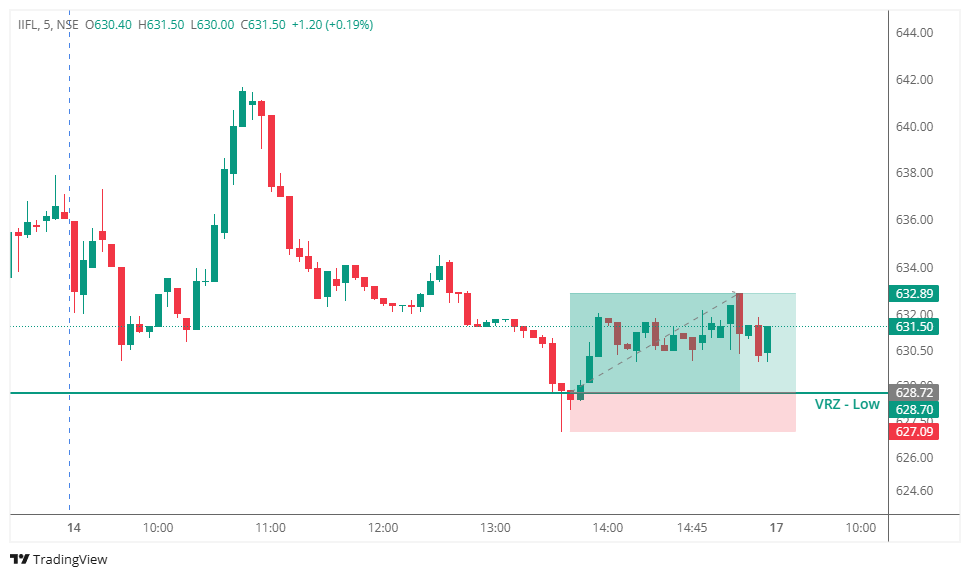

🔻 IIFL approached the VRZ Low and briefly traded below the ₹628.70 support area.
⚠️ However, the breakdown failed to attract sustained selling pressure.
🟢 Buyers stepped in around the VRZ Low and pushed price back above the key zone.
📈 Subsequent 5-minute candles showed improving bullish momentum, confirming that sellers were losing control.
✅ This rejection and recovery established a Breakout Failure (BOF) setup.
🚀 As breakdown sellers became trapped and buyers regained control, IIFL delivered a 0.66% upside move, achieving the planned 1:2 risk-reward target.
🔎 Price was gradually weakening before reaching the VRZ Low.
🔻 Sellers attempted to extend the decline through the support zone.
🟢 The selling pressure failed to sustain below ₹628.70.
🔄 Price reclaimed the VRZ Low and shifted the short-term structure toward the upside.
📈 Follow-through buying after the rejection confirmed the bullish reversal.
🎯 Price eventually moved toward the ₹632.89 target zone.
Initially, traders could have expected:
🔻 Continuation of the existing bearish pressure.
📉 A confirmed breakdown below the VRZ Low.
🐻 Sellers to maintain control below ₹628.70.
But the market delivered a different outcome.
⚠️ The breakdown failed.
😮 Breakdown sellers were trapped.
🟢 Buyers defended the VRZ Low.
📈 Price reclaimed the zone and attracted fresh buying interest.
🚀 This shift in market sentiment supported the successful bullish BOF move.
🔴 Sellers attempted to break the VRZ Low and continue the decline.
🟢 Buyers absorbed the selling pressure around ₹628.70.
⚖️ Once the breakdown failed, seller conviction weakened.
🔄 Trapped short positions added buying pressure as price moved back above the zone.
📈 Fresh buyers then helped drive price toward the upside target.
🔹 VRZ Low Rejection
The predefined support zone attracted buying interest after the failed breakdown.
🔹 Breakdown Failure
Price could not sustain below ₹628.70, weakening the bearish setup.
🔹 Bullish Reclaim
Recovery above the VRZ Low provided confirmation of the reversal.
🔹 Momentum Confirmation
Subsequent bullish candles showed improving buyer participation.
🔹 Controlled Risk
The setup provided a defined invalidation level and delivered the planned 1:2 RR.
🎯 Don't Chase Breakdown Moves
A temporary move below support does not automatically confirm a genuine breakdown.
🔍 Observe the Reaction at VRZ
A strong rejection from a predefined VRZ Low can signal increasing buyer participation.
📈 Wait for Reclaim Confirmation
A return above the failed breakdown zone strengthens the bullish BOF setup.
⚡ Trapped Sellers Can Fuel the Reversal
When price reclaims support, short sellers may exit their positions, adding buying pressure.
✅ Identify the VRZ Low before the trading session.
✅ Monitor price behaviour around the predefined support zone.
✅ Avoid assuming every breakdown will continue.
✅ Wait for rejection and reclaim confirmation.
✅ Define the stop-loss before entering the trade.
✅ Maintain disciplined risk management throughout the setup.
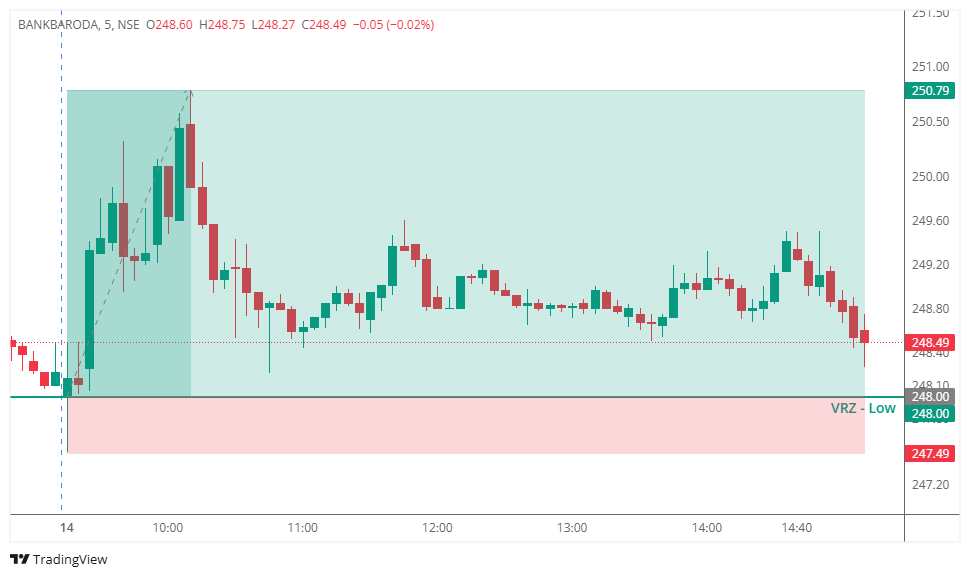

🔹 BANKBARODA tested the VRZ Low, where sellers attempted to push price below the support zone.
⚠️ The breakdown failed to sustain as price quickly recovered back above the VRZ Low.
🔄 This rejection confirmed the Breakdown Failure (BOF) setup and created a bullish intraday opportunity.
🟢 Buyers stepped in strongly after the failed breakdown.
📊 Price reclaimed the VRZ Low and continued trading above the key support zone.
🚀 The bullish recovery eventually delivered a 1.12% upside move with a strong 1:5 Risk-Reward.
🔴 Sellers: Attempted to break below the VRZ Low.
🟡 Breakdown Traders: Became trapped when price moved back above support.
🟢 Buyers: Regained control after the rejection and drove the recovery higher.
🎭 The initial breakdown created bearish expectations.
🚨 When price failed to sustain below the VRZ Low, bearish confidence weakened.
📈 Trapped sellers faced pressure while fresh buying activity strengthened the bullish reversal.
🎯 The key confirmation came when BANKBARODA reclaimed the ₹248.00 VRZ Low after the failed breakdown.
🔄 The recovery above support signaled that sellers were losing control.
⚡ Continued bullish price action strengthened the validity of the BOF setup.
🚫 Failed Breakdowns Can Trigger Strong Recoveries
A breakdown without follow-through can quickly reverse upward.
🎯 Support Reclaim Matters
Regaining the VRZ Low confirmed improving buyer strength.
🛡️ Defined Risk Supports Discipline
The VRZ Low provided a clear reference for setup invalidation.
⚡ Follow Confirmed Momentum
Once buyers regained control, the recovery extended further.
📈 After reclaiming the VRZ Low, BANKBARODA developed a stronger bullish structure.
🟢 Price remained above the key support zone as buyers maintained control.
🚀 The sustained recovery supported the continuation of the bullish reversal.
⚡ Buying pressure increased after the failed breakdown.
📈 Price moved away from the VRZ Low with steady bullish momentum.
🏆 The setup ultimately delivered a 1.12% bullish move with an impressive 1:5 RR.
🔸 The trade became actionable after BANKBARODA failed to sustain the breakdown below ₹248.00.
📈 Buyers reclaimed the support zone and maintained bullish control.
⚖️ The confirmed BOF structure provided a disciplined setup with defined risk and strong upside potential.