
Select a trading day to view all Scanner results, chart evidence, and market explanations.
2 Scanners Available
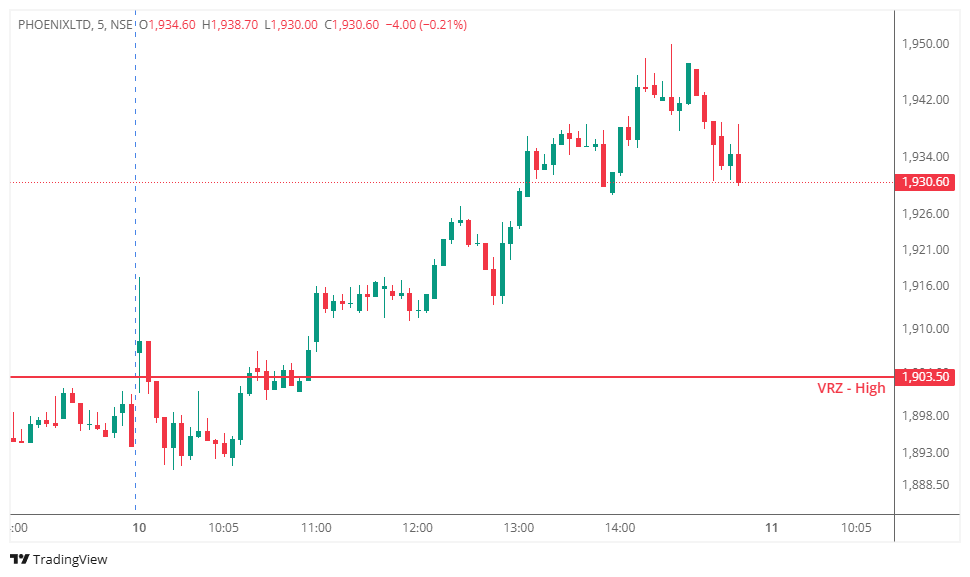

PHOENIXLTD initially traded around the VRZ High at ₹1,903.50 before buyers gained strength and pushed price above the resistance zone.
After the breakout, price showed an initial pullback around the zone, creating an opportunity to monitor for a potential BOF short setup under the Logical Trading System (LTS).
However, the broader price action remained increasingly bullish.
The initial movement around the VRZ High suggested that sellers might attempt to regain control after the breakout.
However, the expected bearish continuation did not develop.
Instead, buyers defended the reclaimed zone and gradually pushed price higher, indicating that the breakout had genuine strength rather than a sustained failure.
The BOF short setup was triggered following the rejection near the VRZ High.
Initially, the setup appeared technically valid. However, sellers failed to generate meaningful downside momentum.
📈 Buyers quickly regained control.
📈 Price established higher highs and higher lows.
📈 Bullish momentum expanded throughout the session.
As the stock continued higher, the predefined stop loss was triggered and the BOF setup was invalidated.
The primary reason for the BOF failure was the lack of sustained selling pressure after the initial rejection.
⚠️ Sellers could not push price back below the breakout structure.
⚠️ Buyers consistently defended higher levels.
⚠️ Price continued creating bullish market structure.
⚠️ The VRZ High effectively shifted from resistance toward support.
⚠️ Strong upside momentum overwhelmed the attempted reversal.
The chart highlights a clear BOF failure followed by strong bullish continuation.
🟢 Buyers reclaimed the VRZ High.
🔻 Sellers attempted to create a reversal.
🟡 Bearish follow-through remained weak.
🔵 Buyers continued establishing higher price levels.
🚀 The stock accelerated upward and moved significantly away from the VRZ High.
This demonstrates why the initial rejection alone should not be considered sufficient confirmation for a sustained reversal.
⚠️ Every BOF setup carries a probability of failure.
📊 A technically valid setup can still produce a losing outcome.
🔍 Confirmation and follow-through are critical after a BOF trigger.
🛡️ A predefined stop loss prevents a failed setup from becoming an uncontrolled loss.
🎯 The objective is not to predict every reversal but to execute the trading system consistently.
This trade remained a rule-based LTS execution despite the unsuccessful outcome.
Professional traders understand that:
✅ A losing trade does not automatically mean poor execution.
✅ Trading systems work through probabilities over a series of trades.
✅ Accepting a predefined loss protects decision-making discipline.
✅ Emotional reactions after a losing trade can create larger mistakes.
Capital protection remains a core part of professional trading.
✔️ The setup was evaluated according to predefined rules.
✔️ Risk was identified before execution.
✔️ The stop loss was respected when the setup became invalid.
✔️ No averaging or emotional intervention was required.
✔️ Capital remained available for the next opportunity.
Small, controlled losses are part of maintaining long-term consistency.
🌍 Markets constantly challenge patience, discipline, and risk management.
⚠️ This PHOENIXLTD BOF Failure shows that a rejection near resistance does not guarantee a bearish reversal. Sellers need strong follow-through to confirm that the breakout has genuinely failed.
📈 When buyers reclaim control and continue forming higher highs, the bearish BOF thesis becomes increasingly weak.
🛡️ Professional traders focus on controlling risk rather than trying to eliminate losses completely.
💪 Follow the system, respect the stop loss, and allow disciplined execution to remain the priority.
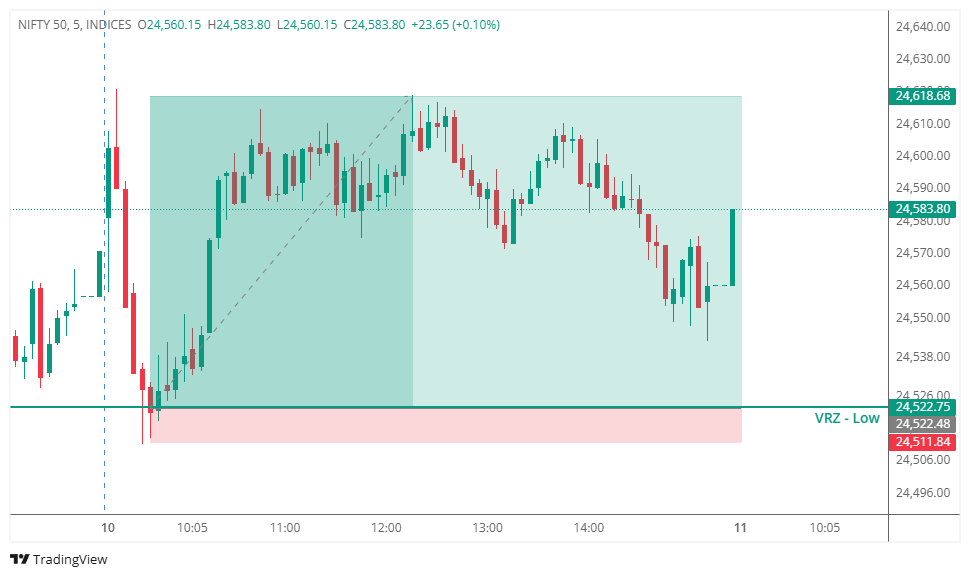

🔹 NIFTY 50 tested the VRZ Low, where sellers attempted to push price below the support zone.
⚠️ The breakdown failed to sustain as price quickly reclaimed the VRZ Low.
🟢 This recovery confirmed the Breakdown Failure setup and shifted momentum toward buyers.
📈 After reclaiming the VRZ Low, buyers gradually regained control.
🟢 Price moved higher and maintained bullish momentum above the support zone.
🎯 The setup delivered a 0.39% bullish move with an impressive 1:9 Risk-Reward.
🔴 Sellers: Attempted to break below the VRZ Low.
🟡 Breakdown Traders: Became trapped when price reclaimed the support zone.
🟢 Buyers: Took control after the failed breakdown and drove the recovery.
🎭 The breakdown initially created bearish expectations.
🚨 When price failed to sustain below the VRZ Low, sellers came under pressure.
📈 The recovery triggered a shift in market sentiment and strengthened buying momentum.
🚫 Failed Breakdowns Can Trigger Strong Recoveries
A breakdown that cannot sustain below support can quickly reverse higher.
🎯 Support Reclaim Signals Strength
The move back above the VRZ Low highlighted renewed buyer control.
🛡️ Defined Risk Supports Discipline
The VRZ Low provided a clear reference for the setup structure.
⚡ Bullish Momentum Can Build Quickly
Once sellers were trapped, price continued developing the upside move.
📊 After reclaiming the VRZ Low, NIFTY 50 established a stronger bullish structure.
🟢 Higher price levels developed as buyers maintained control.
🚀 The recovery remained supportive of the bullish BOF setup.
🔸 The setup developed after NIFTY 50 failed to sustain the breakdown below the VRZ Low.
📈 Buyers regained control and pushed price higher.
🏆 The trade delivered a 0.39% bullish move with a strong 1:9 Risk-Reward.
