
Select a trading day to view all Scanner results, chart evidence, and market explanations.
5 Scanners Available
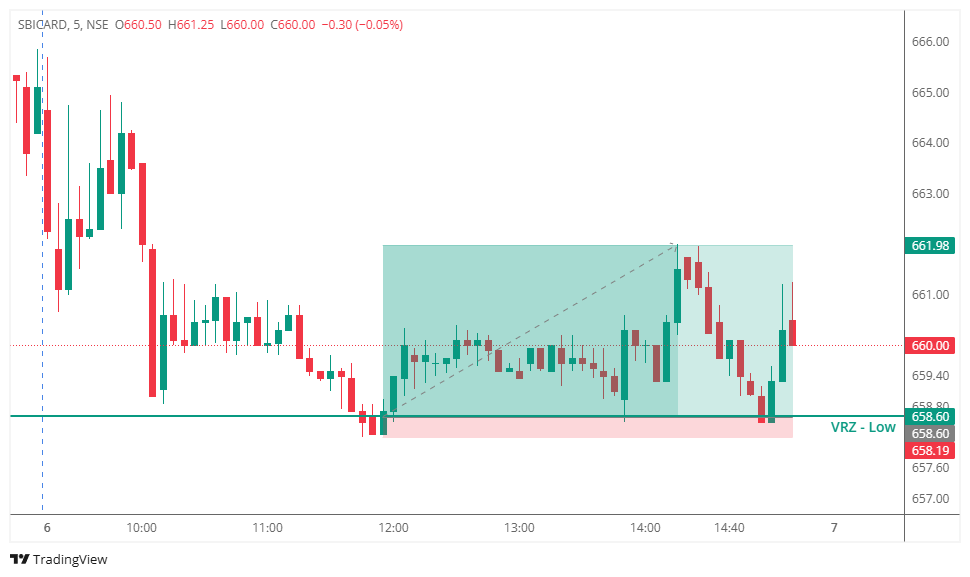

🔹 SBICARD tested the VRZ Low, where sellers attempted to force a breakdown below the key support zone.
⚠️ The breakdown failed to sustain as price quickly reclaimed the VRZ Low, signaling weakening bearish momentum.
🔺 This rejection confirmed the Breakdown Failure (BOF) setup and created a high-probability bullish intraday opportunity.
📈 After reclaiming the VRZ Low, buyers steadily gained control and pushed the stock higher.
🟢 Price continued trading above the support zone, confirming sustained bullish strength.
🎯 The confirmed BOF setup delivered a 0.51% bullish move with an exceptional 1:8 Risk-Reward.
🟢 Buyers: Successfully defended the VRZ Low and regained market control.
🟡 Breakdown Traders: Were trapped as price moved back above the support zone.
🔴 Sellers: Lost momentum after failing to sustain the breakdown.
🎭 The initial breakdown attracted bearish traders expecting further downside.
🚨 As price reclaimed the VRZ Low, trapped sellers rushed to cover their positions.
📈 This shift in sentiment accelerated the bullish recovery and strengthened buying momentum.
🌈 Failed Breakdowns Often Open the Door to Bullish Opportunities
A breakdown that cannot hold below support frequently results in sharp bullish reversals.
✅ Confirmation Improves Trade Quality
The reclaim above the VRZ Low confirmed buyer strength before entry.
🎯 Structured Risk Enhances Consistency
Using the VRZ Low as the invalidation level supported disciplined trade execution.
🚀 Trade with Confirmed Momentum
Following confirmed price action improves the probability of successful BOF trades.
📊 Once price reclaimed the VRZ Low, the stock started forming higher lows and higher highs.
🔺 The bullish market structure remained intact, allowing buyers to maintain control throughout the session.
🔸 The trade became actionable after price reclaimed the VRZ Low and confirmed the failed breakdown.
📈 Buyers controlled the session, producing a clean bullish intraday trend.
🏆 The setup delivered a 0.51% bullish move with an impressive 1:8 Risk-Reward.
⚖️ Disciplined execution and structured risk management helped maximize the trade opportunity.

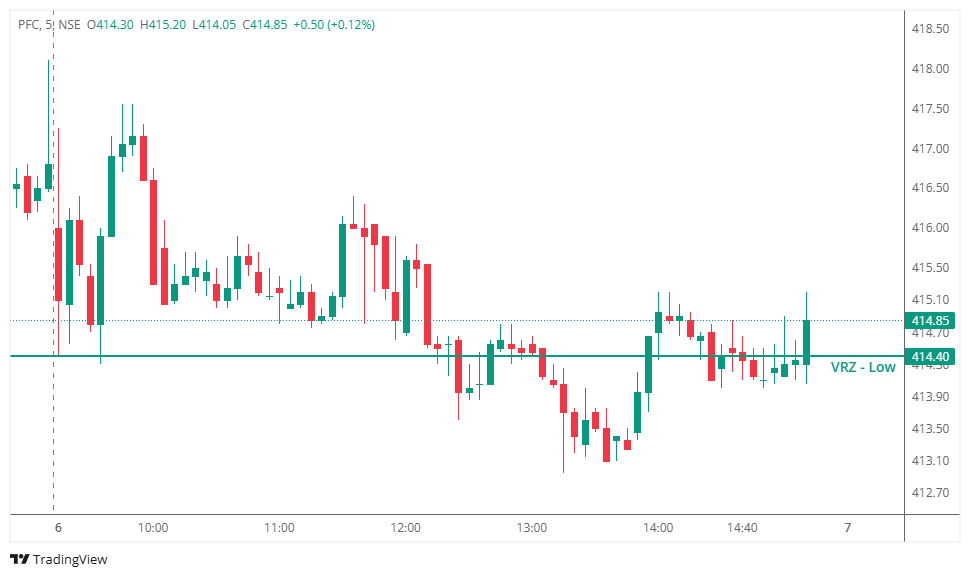

PFC gradually declined toward the VRZ Low (₹414.40) during the session, where buyers were expected to defend this important demand zone.
After price briefly moved below the support level and quickly reclaimed it, the Logical Trading System (LTS) generated a valid BOF Buy setup, anticipating a bullish reversal.
Although the entry met all predefined trading conditions, the expected buying momentum failed to develop.
The initial recovery above the VRZ Low suggested that sellers were losing control and buyers were attempting to regain strength.
However, the broader market lacked sufficient bullish participation. Price remained trapped in a narrow range, repeatedly testing the support area without producing strong higher highs.
This reflected hesitation rather than genuine accumulation.
The BOF Buy trade was activated once price reclaimed the VRZ Low after the false breakdown.
Initially, the setup respected every rule of the trading strategy.
Soon after entry, buying momentum weakened. Instead of expanding higher, price moved sideways and gradually slipped back toward the support zone.
Eventually, sellers regained control, price broke below the support again, and the predefined stop loss was triggered.
The loss remained controlled due to disciplined risk management.
The trade failed because buyers were unable to generate sustained follow-through after reclaiming the support level.
❌ Weak bullish momentum after entry.
❌ Multiple retests of the VRZ Low.
❌ Failure to create higher highs.
❌ Sellers gradually absorbed buying pressure.
❌ Breakdown below support invalidated the reversal setup.
These signals significantly reduced the probability of a successful BOF recovery.
This chart demonstrates a failed Breakdown Failure (BOF) reversal where the reclaim lacked conviction.
🟢 Buyers reclaimed the VRZ Low initially.
🟡 Price consolidated without strong upward expansion.
🔴 Selling pressure gradually increased.
⚫ Support eventually failed, triggering the stop loss.
This type of price action often occurs when institutional buying is insufficient to reverse an existing intraday downtrend.
⚠️ Not every BOF setup leads to a successful reversal.
📊 Confirmation after the reclaim is critical.
🛡️ Sideways price action near support often signals weakness.
🎯 Strict stop-loss discipline prevents large losses.
📈 Consistency comes from following the process—not from winning every trade.
This was a valid BOF execution according to the Logical Trading System (LTS).
Experienced traders recognize that:
✅ Every strategy has losing trades.
✅ Process-driven execution is more important than individual outcomes.
✅ Risk management protects long-term profitability.
✅ Emotional discipline separates professionals from impulsive traders.
Professional trading is built on preserving capital.
✔️ Entry followed predefined BOF rules.
✔️ Risk was defined before execution.
✔️ Stop loss protected trading capital.
✔️ Capital remains available for the next high-probability opportunity.
Controlled losses are an essential part of sustainable trading.
📈 Long-term trading success comes from consistently executing high-quality setups while keeping losses small and allowing winning trades to compound.
🛡️ Professional traders never judge their performance based on a single trade—they judge it by disciplined execution over hundreds of trades.
⚠️ This PFC BOF Failure demonstrates that reclaiming a support zone alone is not enough. Strong bullish confirmation, expanding momentum, and sustained buying pressure are essential for a successful BOF reversal.
🌍 Markets continuously reward discipline, patience, and effective risk management.
💪 Follow your trading plan, protect your capital, and let consistency—not emotions—guide every decision.
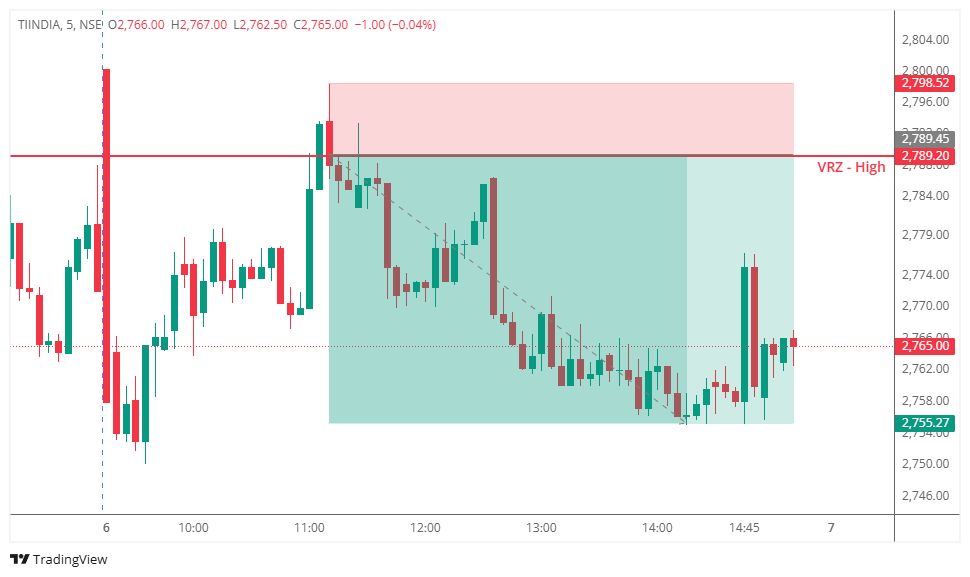

🔹 TIINDIA tested the VRZ High, where buyers attempted to sustain a breakout above the key resistance zone.
⚠️ The breakout failed as price slipped back below the VRZ High, signaling weakening bullish momentum.
🔻 This rejection confirmed the Breakout Failure (BOF) setup and created a high-probability bearish intraday opportunity.
📉 Following the failed breakout, sellers steadily gained control and maintained downside pressure.
🔴 Price remained below the VRZ High, confirming sustained bearish momentum throughout the session.
🎯 The confirmed BOF setup delivered a 1.23% bearish move with a disciplined 1:3 Risk-Reward.
🟢 Buyers: Attempted to sustain the breakout above the VRZ High.
🟡 Breakout Traders: Were trapped as price quickly moved back below resistance.
🔴 Sellers: Dominated the session after the rejection and maintained firm bearish control.
🎭 The breakout initially attracted bullish participation and expectations of continued upside.
🚨 Once the breakout failed, trapped buyers exited while sellers increased their positions.
📉 This shift in market sentiment strengthened the bearish trend.
⭐ Failed Breakouts Often Trigger Reliable Reversals
A breakout that cannot sustain above resistance frequently results in bearish continuation.
✅ Confirmation Strengthens the Setup
The rejection below the VRZ High confirmed seller dominance.
🎯 Disciplined Risk Management Matters
Using the VRZ High as the invalidation level supported structured trade execution.
🚀 Trade with Confirmed Momentum
Following established price action improves the probability of successful BOF trades.
📊 After the rejection, TIINDIA formed a sequence of lower highs and lower lows.
🔻 The bearish structure remained intact, supporting the continuation of the downtrend.
🔸 The trade became actionable after price failed to sustain above the VRZ High and confirmed the breakout failure.
📉 Sellers controlled the session, producing a clean bearish intraday move.
🏆 The setup delivered a 1.23% bearish move with an efficient 1:3 Risk-Reward.
⚖️ Following the confirmed BOF setup helped maximize the trade opportunity.
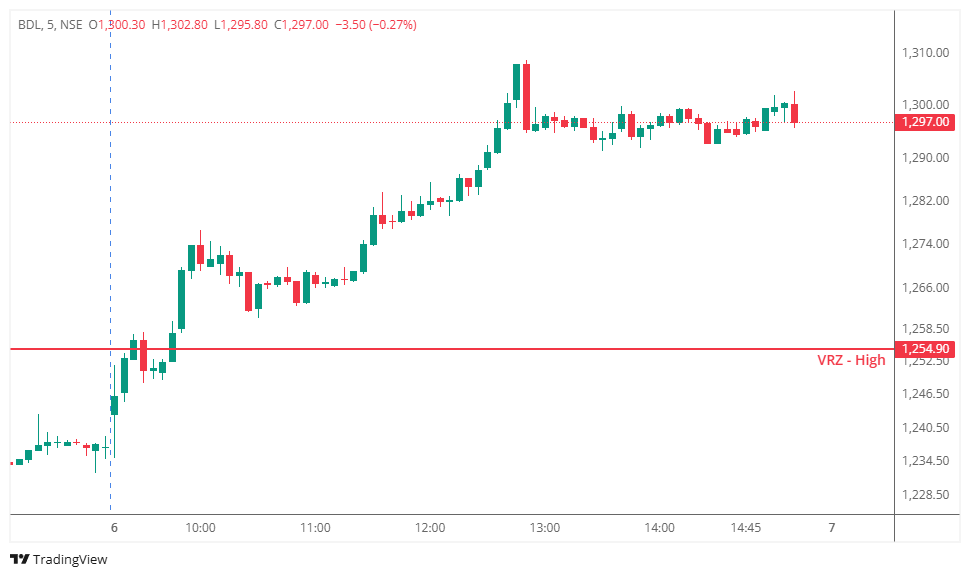

BDL opened with strong bullish momentum and quickly moved above the VRZ High (₹1254.90), a major resistance zone where sellers were expected to defend the price.
After a brief rejection from the breakout level, a valid BOF short setup was generated under the Logical Trading System (LTS). The initial pullback suggested a possible bearish reversal from resistance.
The early rejection indicated that buying momentum might be slowing near the resistance zone.
However, the overall market structure remained bullish. Buyers consistently defended higher price levels and maintained control, preventing sellers from developing meaningful downside momentum.
The BOF short trade was triggered after price rejected the VRZ High.
Initially, the setup aligned perfectly with the trading rules. However, bearish momentum faded quickly as buyers absorbed the selling pressure and reclaimed the breakout zone.
The stock continued making higher highs and higher lows, invalidating the BOF setup and triggering the predefined stop loss.
Although the trade ended in a loss, disciplined execution ensured that risk remained controlled.
The BOF setup failed because sellers were unable to sustain pressure after the initial rejection.
❌ Weak bearish follow-through after entry.
❌ Buyers quickly reclaimed the VRZ High.
❌ Price continued forming higher highs.
❌ Bullish momentum remained dominant throughout the session.
❌ The resistance zone transformed into a strong support level.
These warning signs significantly reduced the probability of a successful BOF short trade.
The chart illustrates a classic BOF failure followed by a powerful bullish continuation.
🟢 Buyers successfully broke above the VRZ High.
🔴 Sellers attempted to reverse the breakout.
🟡 The rejection lacked sustained bearish confirmation.
🔵 Buyers regained complete control above the breakout level.
⭐ Strong bullish momentum continued, invalidating the BOF setup and triggering the stop loss.
This type of price action is commonly seen when institutional buying absorbs selling pressure and traps early short sellers before the primary uptrend resumes.
⚠️ Every BOF setup has a probability of failure.
📉 A valid trading setup can still result in a controlled loss.
🏦 Strong confirmation is essential before expecting a reversal.
🛡️ Respecting stop losses protects long-term trading capital.
🎯 Consistent execution matters more than predicting every market move.
This trade followed every rule of the Logical Trading System (LTS) and remained a valid execution despite the outcome.
Professional traders understand that:
✅ No trading setup guarantees success every time.
✅ Following the trading process is more important than avoiding losses.
✅ Capital preservation is essential for long-term consistency.
✅ Emotional discipline creates sustainable trading performance.
Professional trading is built on disciplined risk management.
✔️ Entry followed predefined trading rules.
✔️ Risk was clearly defined before execution.
✔️ Stop loss limited the downside.
✔️ Capital remained protected for future trading opportunities.
Small, controlled losses are a necessary part of long-term trading success.
📈 Long-term profitability comes from consistently executing a proven trading strategy while ensuring that winning trades outweigh controlled losses over time.
🛡️ Professional traders prioritize capital preservation by following predefined trading rules and respecting stop losses without hesitation.
⚠️ This BDL BOF Failure highlights that a rejection at resistance alone is insufficient—a successful BOF reversal requires strong bearish confirmation and sustained selling pressure.
🌍 Financial markets continuously test a trader's patience, discipline, and ability to manage risk under changing conditions.
💪 Stay committed to your trading plan, manage risk with consistency, and let disciplined execution—not emotions—drive every trading decision.
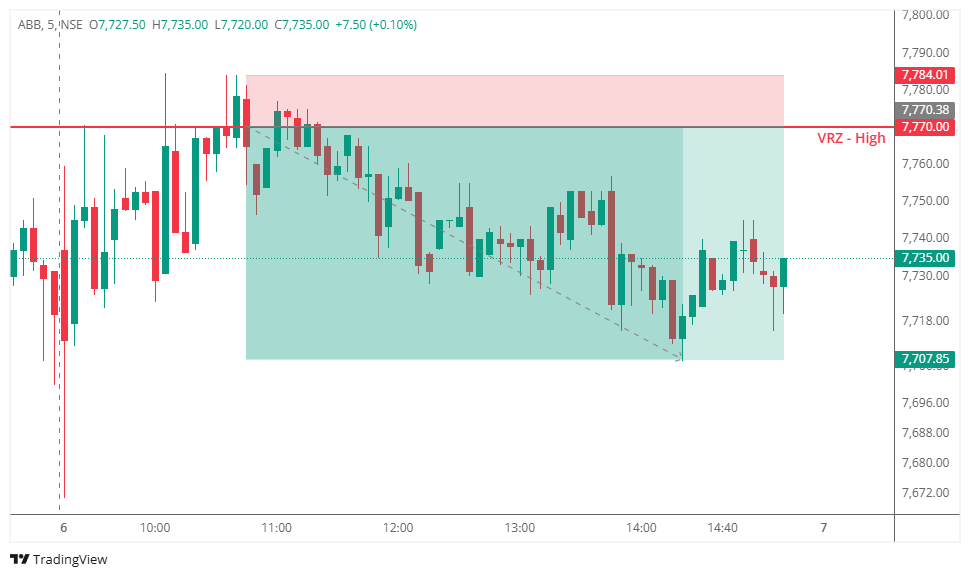

🔹 ABB tested the VRZ High, where buyers attempted to sustain a breakout above the key resistance zone.
⚠️ The breakout failed as price slipped back below the VRZ High, signaling weakening bullish momentum.
🔻 This rejection confirmed the Breakout Failure (BOF) setup and created a high-probability bearish intraday opportunity.
📉 Following the failed breakout, sellers gradually gained control and pushed the stock lower.
🔴 Price continued trading below the VRZ High, confirming sustained bearish momentum.
🎯 The confirmed BOF setup delivered a 0.80% bearish move with a solid 1:4 Risk-Reward.
🟢 Buyers: Tried to defend the breakout above the VRZ High.
🟡 Breakout Traders: Were trapped as price quickly moved back below resistance.
🔴 Sellers: Took control after the rejection and maintained steady downside pressure.
🎭 The initial breakout created bullish expectations among market participants.
🚨 As the breakout failed, trapped buyers exited while fresh sellers entered the market.
📉 This shift in sentiment strengthened the bearish trend throughout the session.
⭐ Failed Breakouts Can Trigger Reliable Reversals
When price fails to sustain above resistance, bearish momentum often accelerates.
✅ Trade the Confirmation
The rejection below the VRZ High confirmed seller dominance.
🎯 Manage Risk with Precision
Using the VRZ High as the invalidation level supported disciplined execution.
🚀 Follow Momentum
Trading in the direction of confirmed price action increases the probability of successful BOF setups.
📊 After the rejection, ABB formed a sequence of lower highs and lower lows.
🔻 The bearish structure remained intact, allowing the trade to progress smoothly toward its target.

🔸 The trade became actionable after price failed to sustain above the VRZ High.
📉 Sellers maintained control throughout the session, producing a clean bearish intraday trend.
🏆 The setup delivered a 0.80% bearish move with an impressive 1:4 Risk-Reward.
⚖️ Disciplined execution and structured risk management helped maximize the opportunity.