
Select a trading day to view all Scanner results, chart evidence, and market explanations.
5 Scanners Available
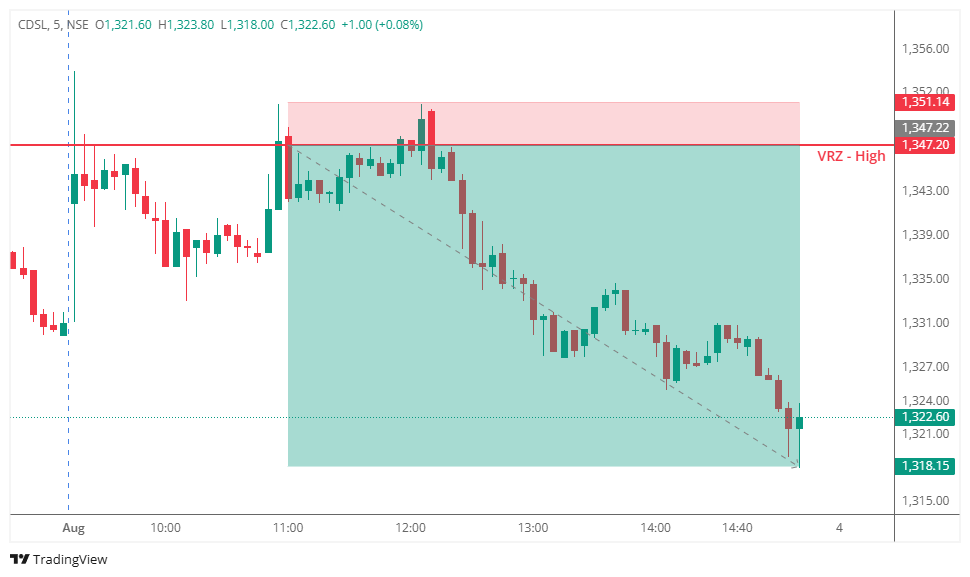

🔹 CDSL tested the VRZ High, where buyers attempted to sustain a breakout above the resistance zone.
⚠️ The breakout failed to hold as price slipped back below the VRZ High, signaling weakening bullish momentum.
🔻 This rejection confirmed the Breakout Failure (BOF) setup and created a high-probability bearish intraday opportunity.
📉 Following the failed breakout, sellers steadily gained control and maintained downside pressure throughout the session.
🔴 Price continued trading below the VRZ High, confirming a sustained bearish trend.
🎯 The confirmed BOF setup delivered a 2.16% bearish move with an outstanding 1:7 Risk-Reward.
🟢 Buyers: Attempted to sustain the breakout above the VRZ High.
🟡 Breakout Traders: Were trapped as price moved back below the resistance zone.
🔴 Sellers: Took control after the rejection and maintained strong bearish momentum.
🎭 The initial breakout attracted bullish participation, creating expectations of further upside.
🚨 As the breakout failed, trapped buyers rushed to exit their positions, accelerating selling pressure.
📉 The shift in sentiment allowed sellers to dominate the session and strengthen the bearish trend.
🔸 1️⃣ Failed Breakouts Often Lead to Sharp Reversals
A breakout that cannot sustain above resistance can quickly shift momentum toward sellers.
🔹 2️⃣ Confirmation Builds Confidence
Waiting for price to reject the VRZ High helped validate the BOF setup.
🟢 3️⃣ Structured Risk Improves Execution
Using the VRZ High as the invalidation level supported disciplined trade management.
🔵 4️⃣ Follow Confirmed Price Action
Trading with market confirmation improves the probability of successful BOF setups.
📊 Once price moved below the VRZ High, lower highs and lower lows started forming.
🔻 The bearish market structure remained intact throughout the session, providing confidence to hold the trade.
🔸 The trade became actionable after price failed to sustain above the VRZ High and confirmed the breakout failure.
📉 Sellers controlled the session, producing a clean bearish intraday trend.
🏆 The setup delivered a 2.16% bearish move with an excellent 1:7 Risk-Reward.
⚖️ Patience and disciplined execution helped capture the full potential of the BOF setup.
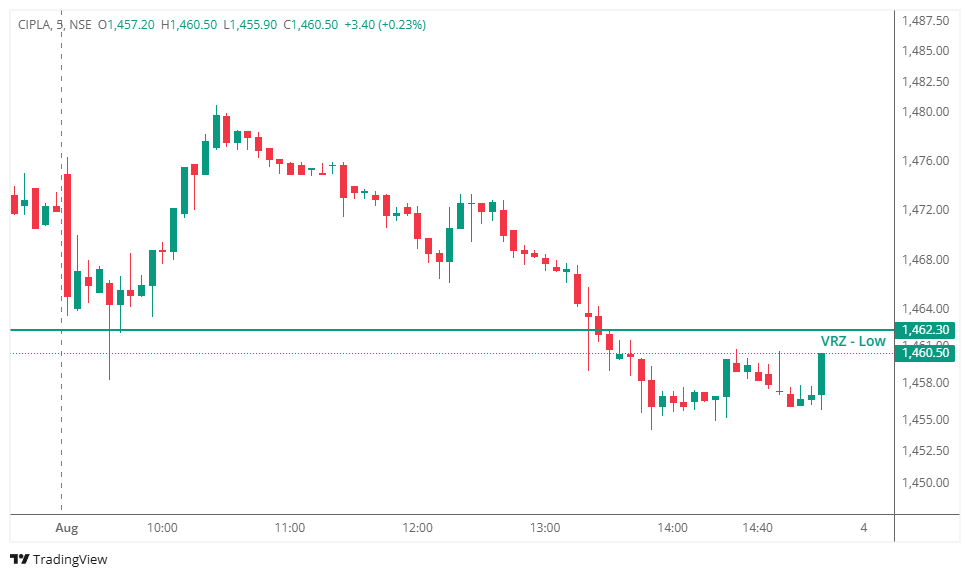

CIPLA traded with sustained selling pressure during the session and approached the VRZ Low, a key support zone where buyers were expected to defend the price.
After briefly moving below ₹1462.30 and reclaiming the level, a valid BOF long setup was generated under the Logical Trading System (LTS). The reclaim suggested a possible bullish reversal from support.
The initial recovery above the VRZ Low indicated that selling pressure might be weakening.
However, buyers failed to build momentum after the reclaim. The recovery remained shallow, while sellers continued to dominate the broader intraday trend, keeping the market structure bearish.
The BOF buy trade was triggered after price reclaimed the VRZ Low.
Initially, the setup appeared promising, but bullish momentum faded quickly. Buyers were unable to sustain higher prices, allowing sellers to regain control and push the stock back below the support zone.
As selling pressure expanded, the BOF setup was invalidated and the predefined stop loss was triggered.
Although price attempted another recovery later in the session, the stop loss had already protected trading capital.
The BOF setup failed because buyers failed to maintain control after reclaiming the support level.
❌ Weak bullish follow-through after entry.
❌ Sellers quickly regained market control.
❌ Price failed to establish higher highs.
❌ Bearish momentum remained dominant.
❌ The support reclaim lacked strong confirmation.
These signals significantly reduced the probability of a successful BOF long trade.
The chart demonstrates a classic BOF failure before a delayed recovery.
🔻 Sellers broke below the VRZ Low.
🟢 Buyers reclaimed the support zone.
🔶 The recovery lacked strong bullish momentum.
🔴 Sellers regained control and pushed price back below support.
✨ A later rebound occurred only after the BOF trade had already failed.
📌 This is a common example where a valid setup fails due to insufficient buying strength immediately after the trigger.
⚠️ Every BOF setup carries a probability of failure.
📉 A valid setup can still produce a losing trade.
🏦 Strong confirmation is essential after every BOF trigger.
🛡️ Respecting stop losses protects long-term trading capital.
🎯 Consistency comes from following the trading plan—not predicting every market move.
This trade fully complied with the Logical Trading System (LTS) and remained a valid execution despite the financial loss.
Professional traders focus on:
✅ Executing rule-based setups consistently.
✅ Accepting losses as part of trading.
✅ Respecting predefined stop losses.
✅ Preserving capital for future opportunities.
Long-term success depends on disciplined execution rather than perfect accuracy.
Professional trading is built on managing risk—not avoiding losses.
✔️ Entry followed predefined rules.
✔️ Risk was clearly defined before execution.
✔️ Stop loss limited the downside.
✔️ Capital remained available for the next high-probability setup.
Small, controlled losses are an essential part of sustainable trading.

🌍 Markets continuously test patience, discipline, and emotional control.
⚠️ This CIPLA BOF Failure demonstrates that reclaiming a support level alone is not enough. A successful BOF reversal requires strong bullish confirmation and immediate follow-through.
🛡️ Professional traders focus on protecting capital, following their trading plan, and remaining disciplined regardless of individual trade outcomes.
📈 Long-term profitability comes from consistently executing a proven strategy while keeping losses controlled.
💪 Trust your process, manage risk wisely, and let discipline guide every trade.
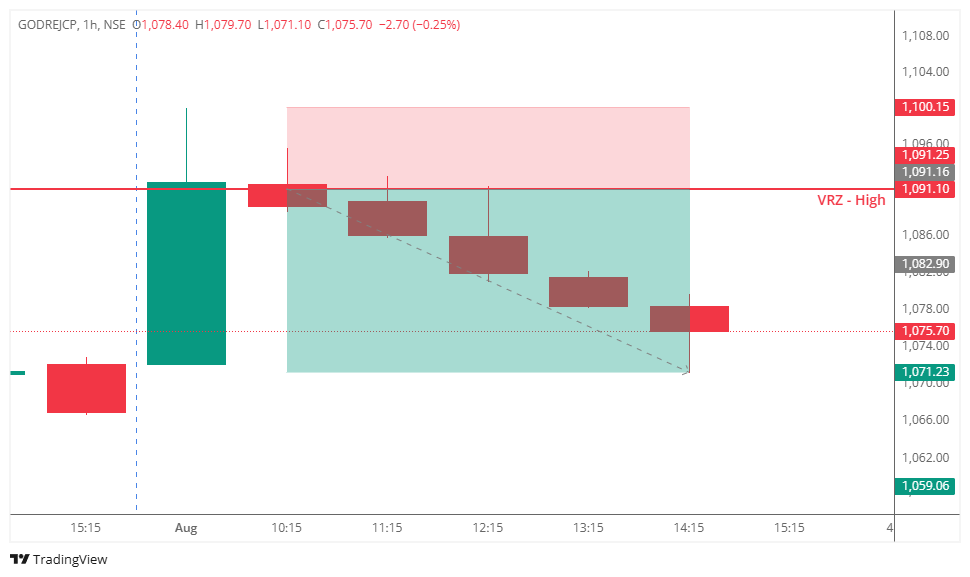

🎯 Godrej Consumer Products approached the previously identified VRZ High at ₹1,091.10 and briefly traded above the resistance zone, creating the impression that a bullish breakout had been confirmed.
📈 The initial breakout attracted fresh buyers expecting the stock to continue its upward move after crossing the key resistance.
⚠️ However, the breakout failed to sustain.
🔻 Strong selling pressure quickly pushed the stock back below ₹1,091.10. The following hourly candles confirmed acceptance beneath the VRZ High, signaling that buyers had lost control and the breakout lacked conviction.
✅ This price action confirmed a classic Breakout Failure (BOF) setup.
💥 As the failed breakout became evident, trapped buyers started exiting their positions while fresh sellers entered the market. The combination of long unwinding and aggressive selling resulted in a 1.83% downside move, successfully achieving the planned 1:2 risk-reward target.
🔍 The rejection at the VRZ High clearly showed that the breakout lacked institutional buying support.
📊 Every attempt to sustain above resistance was met with fresh selling pressure, allowing bears to regain control.
📉 As price continued making lower highs and lower closes after the rejection, bearish momentum strengthened and confirmed the BOF setup.
Many traders believed:
🚀 The breakout above resistance was genuine.
📈 Buyers would continue driving prices higher.
🌟 A fresh bullish trend had begun.
The market reacted differently.
🔻 Price quickly slipped back below ₹1,091.10.
😮 Breakout buyers became trapped.
🐻 Sellers regained control near the resistance zone.
📉 Bearish momentum strengthened as long positions were unwound.
💭 This shift from bullish optimism to bearish dominance fueled the successful downside move.
🟢 Early buyers attempted to push the stock above the VRZ High.
🔴 Sellers aggressively defended the resistance zone.
⚖️ The failed breakout trapped late buyers while encouraging fresh short positions.
📉 The combination of long unwinding and new selling accelerated the bearish move.
🔹 A Breakout Requires Sustained Acceptance
A temporary move above the VRZ High does not confirm a genuine breakout. Price must sustain above resistance for validation.
🔹 Rapid Rejection Reflects Strong Seller Conviction
The swift move back below ₹1,091.10 highlighted aggressive selling pressure and weak buyer commitment.
🔹 Failed Breakouts Can Create High-Probability Short Trades
Trapped breakout buyers often accelerate bearish momentum through long liquidation.
🔹 Confirmation Enhances Trade Quality
Waiting for price to confirm acceptance below the VRZ High provided a disciplined, high-probability BOF short setup with clearly defined risk.
✅ Trade the confirmation, not the breakout.
✅ Always wait for price acceptance back inside the VRZ before entering.
✅ False breakouts often provide better risk-reward opportunities than genuine breakouts.
✅ Proper stop-loss placement above the failed breakout keeps risk controlled.
✔️ Breakout failed immediately after crossing the VRZ High.
✔️ Buyers failed to defend higher prices.
✔️ Sellers reclaimed the resistance zone with strong momentum.
✔️ Price remained below the VRZ High, confirming bearish control.
✔️ The move offered a clean, rule-based BOF short setup.
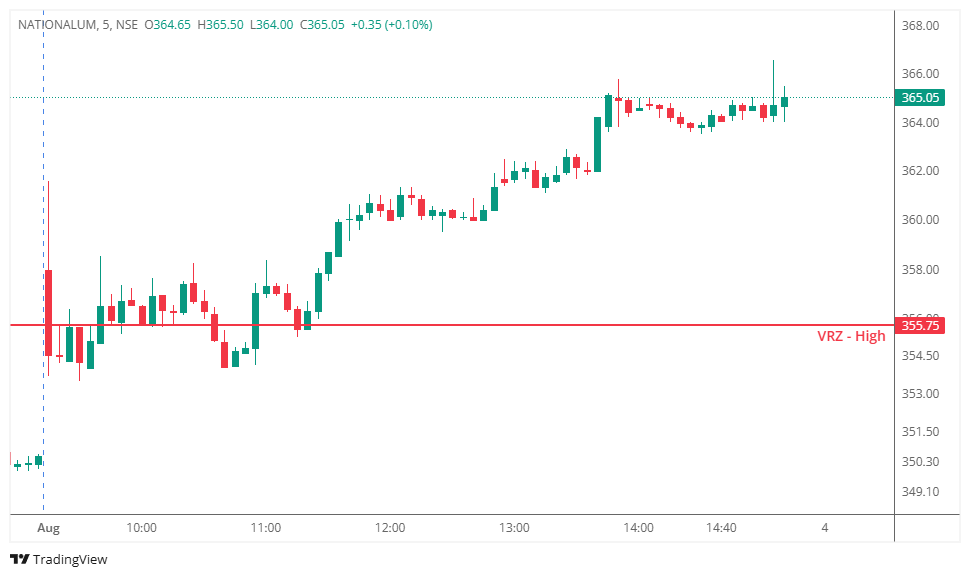

NATIONALUM opened with strong buying momentum and advanced toward the VRZ High, a key resistance level where sellers were expected to defend the price.
After briefly moving above ₹355.75 and showing an initial rejection, a valid BOF short setup formed according to the Logical Trading System (LTS). The setup suggested the possibility of a bearish reversal from resistance.
The early rejection around the VRZ High created a favorable environment for a BOF short trade.
However, the rejection lacked strong bearish confirmation. Buyers quickly regained control, defended the breakout zone, and maintained a bullish market structure throughout the session.
The stock continued to print higher highs and higher lows, indicating sustained buying interest.
The BOF short trade was triggered after the initial rejection near the VRZ High.
Instead of extending lower, sellers lost momentum almost immediately. Buyers absorbed the selling pressure and reclaimed higher price levels with confidence.
As bullish momentum strengthened, the BOF setup was invalidated, and the predefined stop loss was triggered.
The continued rally confirmed that the breakout was genuine rather than a failed breakout.
The BOF setup failed because sellers failed to gain control after entry.
❌ Price quickly reclaimed the breakout zone.
❌ Selling pressure weakened after the trigger.
❌ Buyers consistently defended higher price levels.
❌ Higher highs and higher lows continued to develop.
❌ Bullish momentum remained dominant throughout the session.
These signals confirmed that the bearish reversal lacked conviction.
The chart demonstrates a classic BOF failure followed by bullish trend continuation.
🔹 Buyers successfully broke above the VRZ High.
🔸 Sellers attempted a reversal.
🔺 The rejection lacked bearish follow-through.
🔷 Buyers reclaimed control with strong momentum.
⭐ Price continued making higher highs, confirming the breakout.
This type of move often traps early short sellers before the market resumes its primary bullish trend.
A valid BOF setup does not guarantee a successful reversal.
This trade highlights that confirmation after entry is just as important as the setup itself.
Professional traders recognize when market conditions invalidate the original trade idea and exit without hesitation.
⚠️ Every BOF setup carries a probability of failure.
📉 Strong breakouts can invalidate reversal trades despite an initial rejection.
🏦 Price structure and momentum should always confirm the trade.
🛡️ Disciplined risk management protects capital during unfavorable market conditions.
🎯 Long-term consistency comes from following the trading plan—not from avoiding losses.
This trade fully complied with the Logical Trading System (LTS) and therefore remained a valid execution despite the loss.
Professional traders focus on:
✅ Following predefined trading rules.
✅ Respecting stop losses without hesitation.
✅ Avoiding emotional decision-making.
✅ Preserving capital for the next high-probability setup.
A single losing trade never defines long-term trading success.
Capital preservation remains the foundation of professional trading.
✅ Entry followed the trading plan.
✅ Risk was defined before execution.
✅ Stop loss was honored.
✅ No averaging down or revenge trading occurred.
Small, controlled losses allow traders to remain consistent over hundreds of trades.
🌍 Financial markets constantly test patience, discipline, and risk management.
⚠️ This NATIONALUM BOF Failure demonstrates that an initial rejection near resistance is not enough—strong bearish confirmation and follow-through are essential for a successful BOF reversal.
🛡️ Professional traders don't avoid losses; they manage them with discipline and consistency.
📈 Long-term profitability comes from executing a proven strategy repeatedly while keeping losses small and controlled.
💪 Stay disciplined, trust your trading system, and let consistency—not emotions—drive every decision.
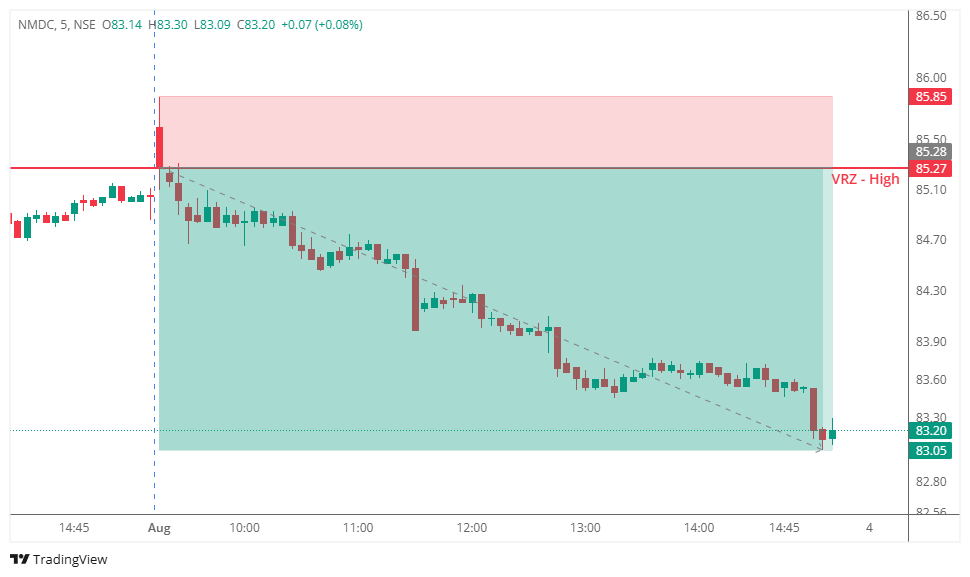

🔹 NMDC tested the VRZ High, where buyers attempted to sustain a breakout above the resistance zone.
⚠️ The breakout failed to hold as price quickly slipped back below the VRZ High, signaling weakening bullish momentum.
🔻 This rejection confirmed the Breakout Failure (BOF) setup and created a strong bearish intraday opportunity.
📉 Following the failed breakout, sellers steadily gained control and maintained downside pressure throughout the session.
🔴 Price continued trading below the VRZ High, confirming a sustained bearish market structure.
🎯 The confirmed BOF setup delivered a 2.61% bearish move with a solid 1:4 Risk-Reward.
🟢 Buyers: Attempted to sustain the breakout above the VRZ High.
🟡 Breakout Traders: Were trapped as price moved back below the resistance zone.
🔴 Sellers: Capitalized on the rejection and maintained control until the target was achieved.
1️⃣ Failed Breakouts Can Trigger Strong Bearish Moves
A breakout that cannot sustain above resistance often shifts momentum sharply toward sellers.
2️⃣ Wait for Confirmation
Allowing price to reject the VRZ High before entry helped validate the BOF setup.
3️⃣ Structured Risk Improves Consistency
Using the VRZ High as the invalidation level supported disciplined trade execution.
4️⃣ Trust Confirmed Price Action
Following the confirmed market structure increases the probability of successful BOF trades.
🔸 The setup became actionable after price failed to sustain above the VRZ High and confirmed the breakout failure.
📉 Sellers maintained control throughout the session, producing a clean bearish intraday trend.
🏆 The trade delivered a 2.61% bearish move with a disciplined 1:4 Risk-Reward.