
Select a trading day to view all Scanner results, chart evidence, and market explanations.
3 Scanners Available
Category: Swing Trading
Instrument: Nifty Midcap Select Index
Timeframe: 1 Hour
Not every profitable trade comes from chasing momentum.
Some of the best swing trading opportunities emerge after a failed breakout, when the market traps sellers and quickly reverses in the opposite direction.
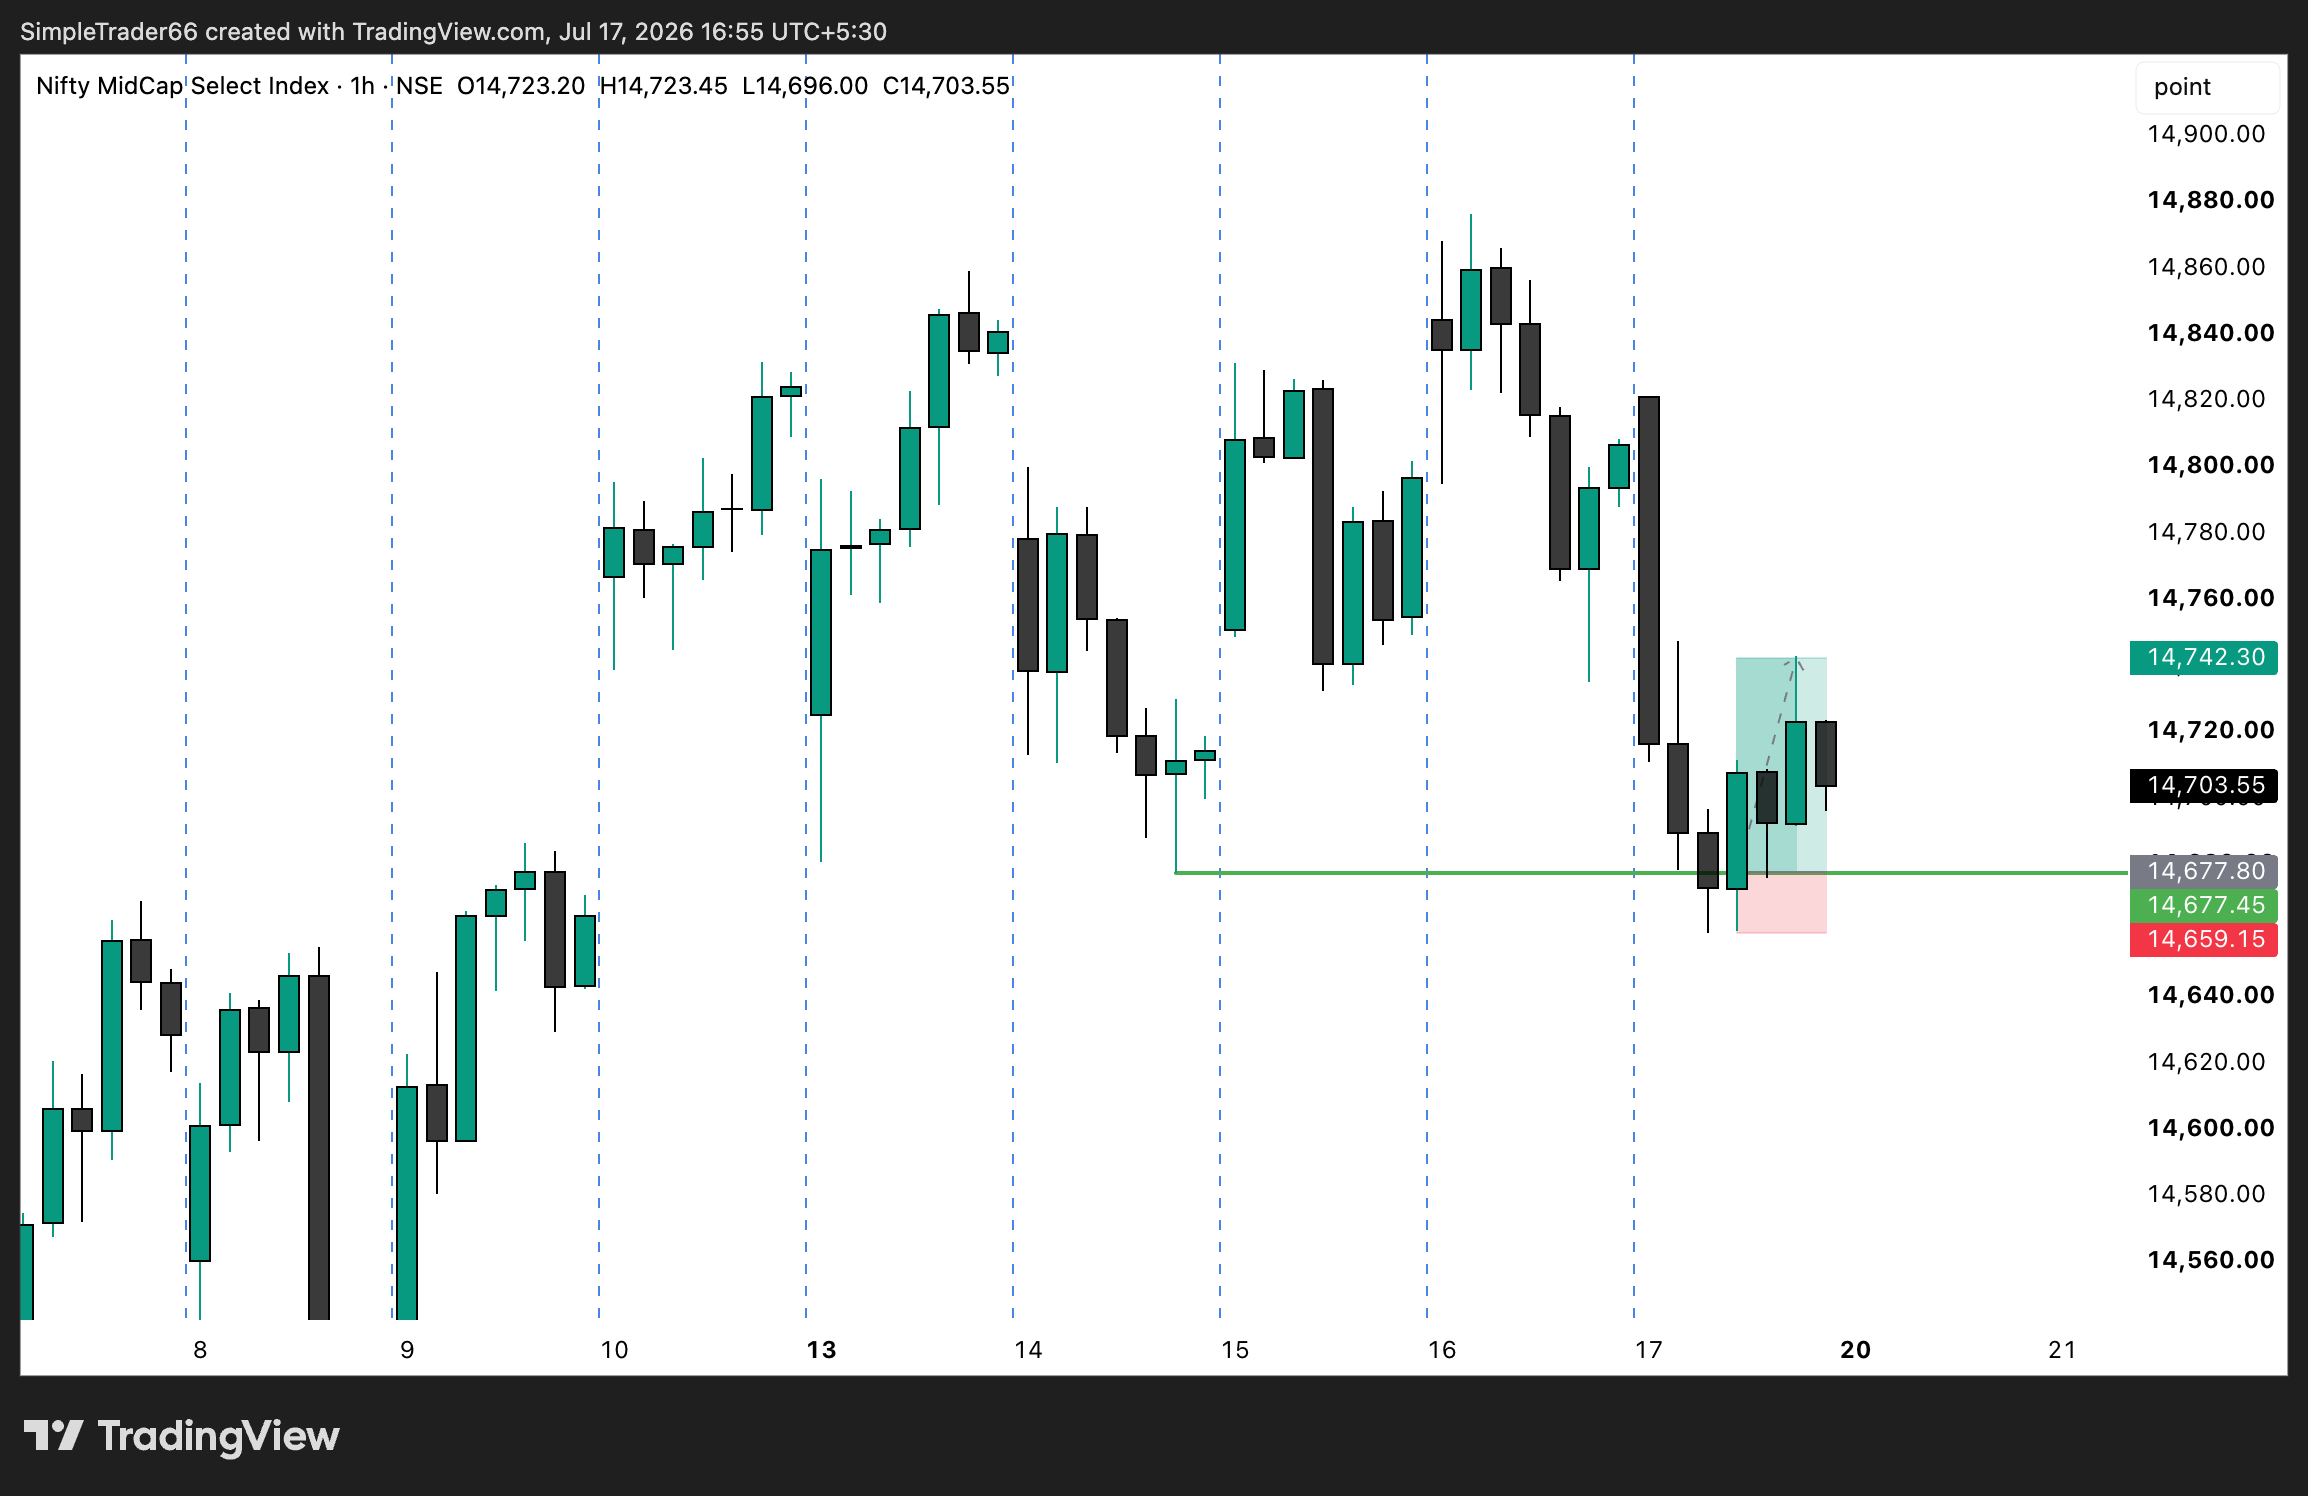
The chart below highlights one such setup on the Nifty Midcap Select Index, where a BOF (Breakout Failure) signal generated a 1:3 Risk-to-Reward (RR) swing trading opportunity.
The index had been under selling pressure for several hours, pushing prices lower toward a previously identified VRZ Low (Volume Rejection Zone).
Rather than continuing the downtrend, price briefly moved below this important support level before quickly reclaiming it.
This false breakdown indicated that selling pressure was losing strength and buyers were stepping in.
Instead of confirming a bearish continuation, the market created a classic Breakout Failure (BOF) setup.
The trade followed a straightforward structure:
This provided a clearly defined trade with limited downside and a favorable reward potential.
Several factors increased the probability of success:
These characteristics are common in many successful BOF setups.
One reason BOF setups are attractive is their natural risk structure.
Because the invalidation point is clearly defined below the failed breakout, traders can:
Even if not every BOF trade succeeds, maintaining positive risk-to-reward can help improve long-term trading performance.
This example reinforces several important principles:
BOF Scanner simplifies the process of identifying these opportunities by:
This 1:3 swing trade on the Nifty Midcap Select Index demonstrates why traders should not assume every breakout or breakdown will continue.
Markets frequently trap participants before making the real move. Recognizing these failed breakouts can provide well-defined entries with attractive risk-to-reward profiles.
The objective is not to predict every market move but to consistently identify situations where the potential reward outweighs the risk. When combined with disciplined execution and sound risk management, BOF setups can become a valuable component of a swing trading strategy.
Reading Time: 4–6 Minutes
One of the biggest misconceptions among new traders is that a good trading setup should work every time.
It doesn't.
Whether you trade breakouts, moving averages, price action, or BOF (Breakout Failure), no trading strategy has a 100% success rate.
This often surprises beginners. They take one losing trade and immediately conclude:
In reality, losing trades are not evidence of a bad system—they're a natural part of trading.
The real objective isn't to eliminate losses. It's to ensure that your winning trades are large enough to outweigh them.
Imagine flipping a coin that lands on heads 60% of the time.
Even with this statistical advantage, you'll still experience sequences like:
Does that mean the coin stopped working?
Of course not.
Trading works the same way.
A profitable edge plays out over dozens or even hundreds of trades, not over a single trade.
BOF identifies areas where a breakout is likely to fail.
But markets are influenced by many factors beyond technical structure.
Sometimes, price simply has enough momentum to continue instead of reversing.
Here are the most common reasons.
Sometimes institutions aggressively accumulate or distribute shares.
Even if a BOF setup appears technically valid, overwhelming buying or selling pressure can invalidate the reversal.
Momentum wins.
Structure loses.
Unexpected events can instantly change market direction.
Examples include:
These events often override technical patterns.
Not every trading session is designed for reversals.
On strong trending days, breakouts frequently continue instead of failing.
Trying to fade every breakout during these sessions often leads to losses.
Stocks with poor liquidity behave differently.
Small orders can move prices sharply, creating false signals that don't reflect genuine institutional participation.
This is one reason many professional traders prefer liquid stocks.
Financial markets are probabilistic.
Even perfect-looking setups can fail simply because uncertainty is part of every market.
This randomness cannot be eliminated.
It can only be managed.
This is an important distinction.
Many traders judge their analysis based solely on the outcome.
Professional traders judge their analysis based on whether they followed their trading plan.
Consider two traders:
This is still a good trade.
This is still a bad trade.
Good decisions sometimes produce losing trades.
Bad decisions sometimes produce winning trades.
Over time, disciplined decisions outperform lucky ones.
The purpose of BOF Scanner is not to predict every market move perfectly.
Its purpose is to help traders consistently identify high-probability opportunities.
What makes a trading system profitable isn't avoiding losses—it's controlling them.
For example:
Overall result:
+4R
You can lose more often than you win and still be profitable if your winners are larger than your losers.
One of the biggest mindset shifts in trading is moving from certainty to probability.
Instead of asking:
"Will this BOF definitely work?"
Ask:
"Does this trade offer a positive probability with acceptable risk?"
This small change transforms emotional trading into professional trading.
BOF Scanner doesn't eliminate losing trades.
Instead, it helps traders by:
Used alongside sound risk management and market context, BOF Scanner becomes a decision-support tool—not a promise of certainty.
Many beginners chase a strategy with a 100% win rate.
Experienced traders know that such a strategy doesn't exist.
The goal is to build a process that:
Trading is a game of probabilities, not perfection.
Every successful trading strategy experiences losing trades—including BOF.
A failed BOF signal doesn't mean the strategy is broken. It simply reflects the uncertain nature of financial markets.
The traders who succeed are not those who avoid losses—they are the ones who accept losses as a business expense, manage risk consistently, and continue executing their edge without emotion.
When you stop expecting every BOF signal to win, you'll begin thinking like a professional trader. Ironically, that's often when your overall trading performance starts to improve.

Sector: Index
Instrument: NIFTY 50
Timeframe: 5 Minutes
Date: July 17, 2026
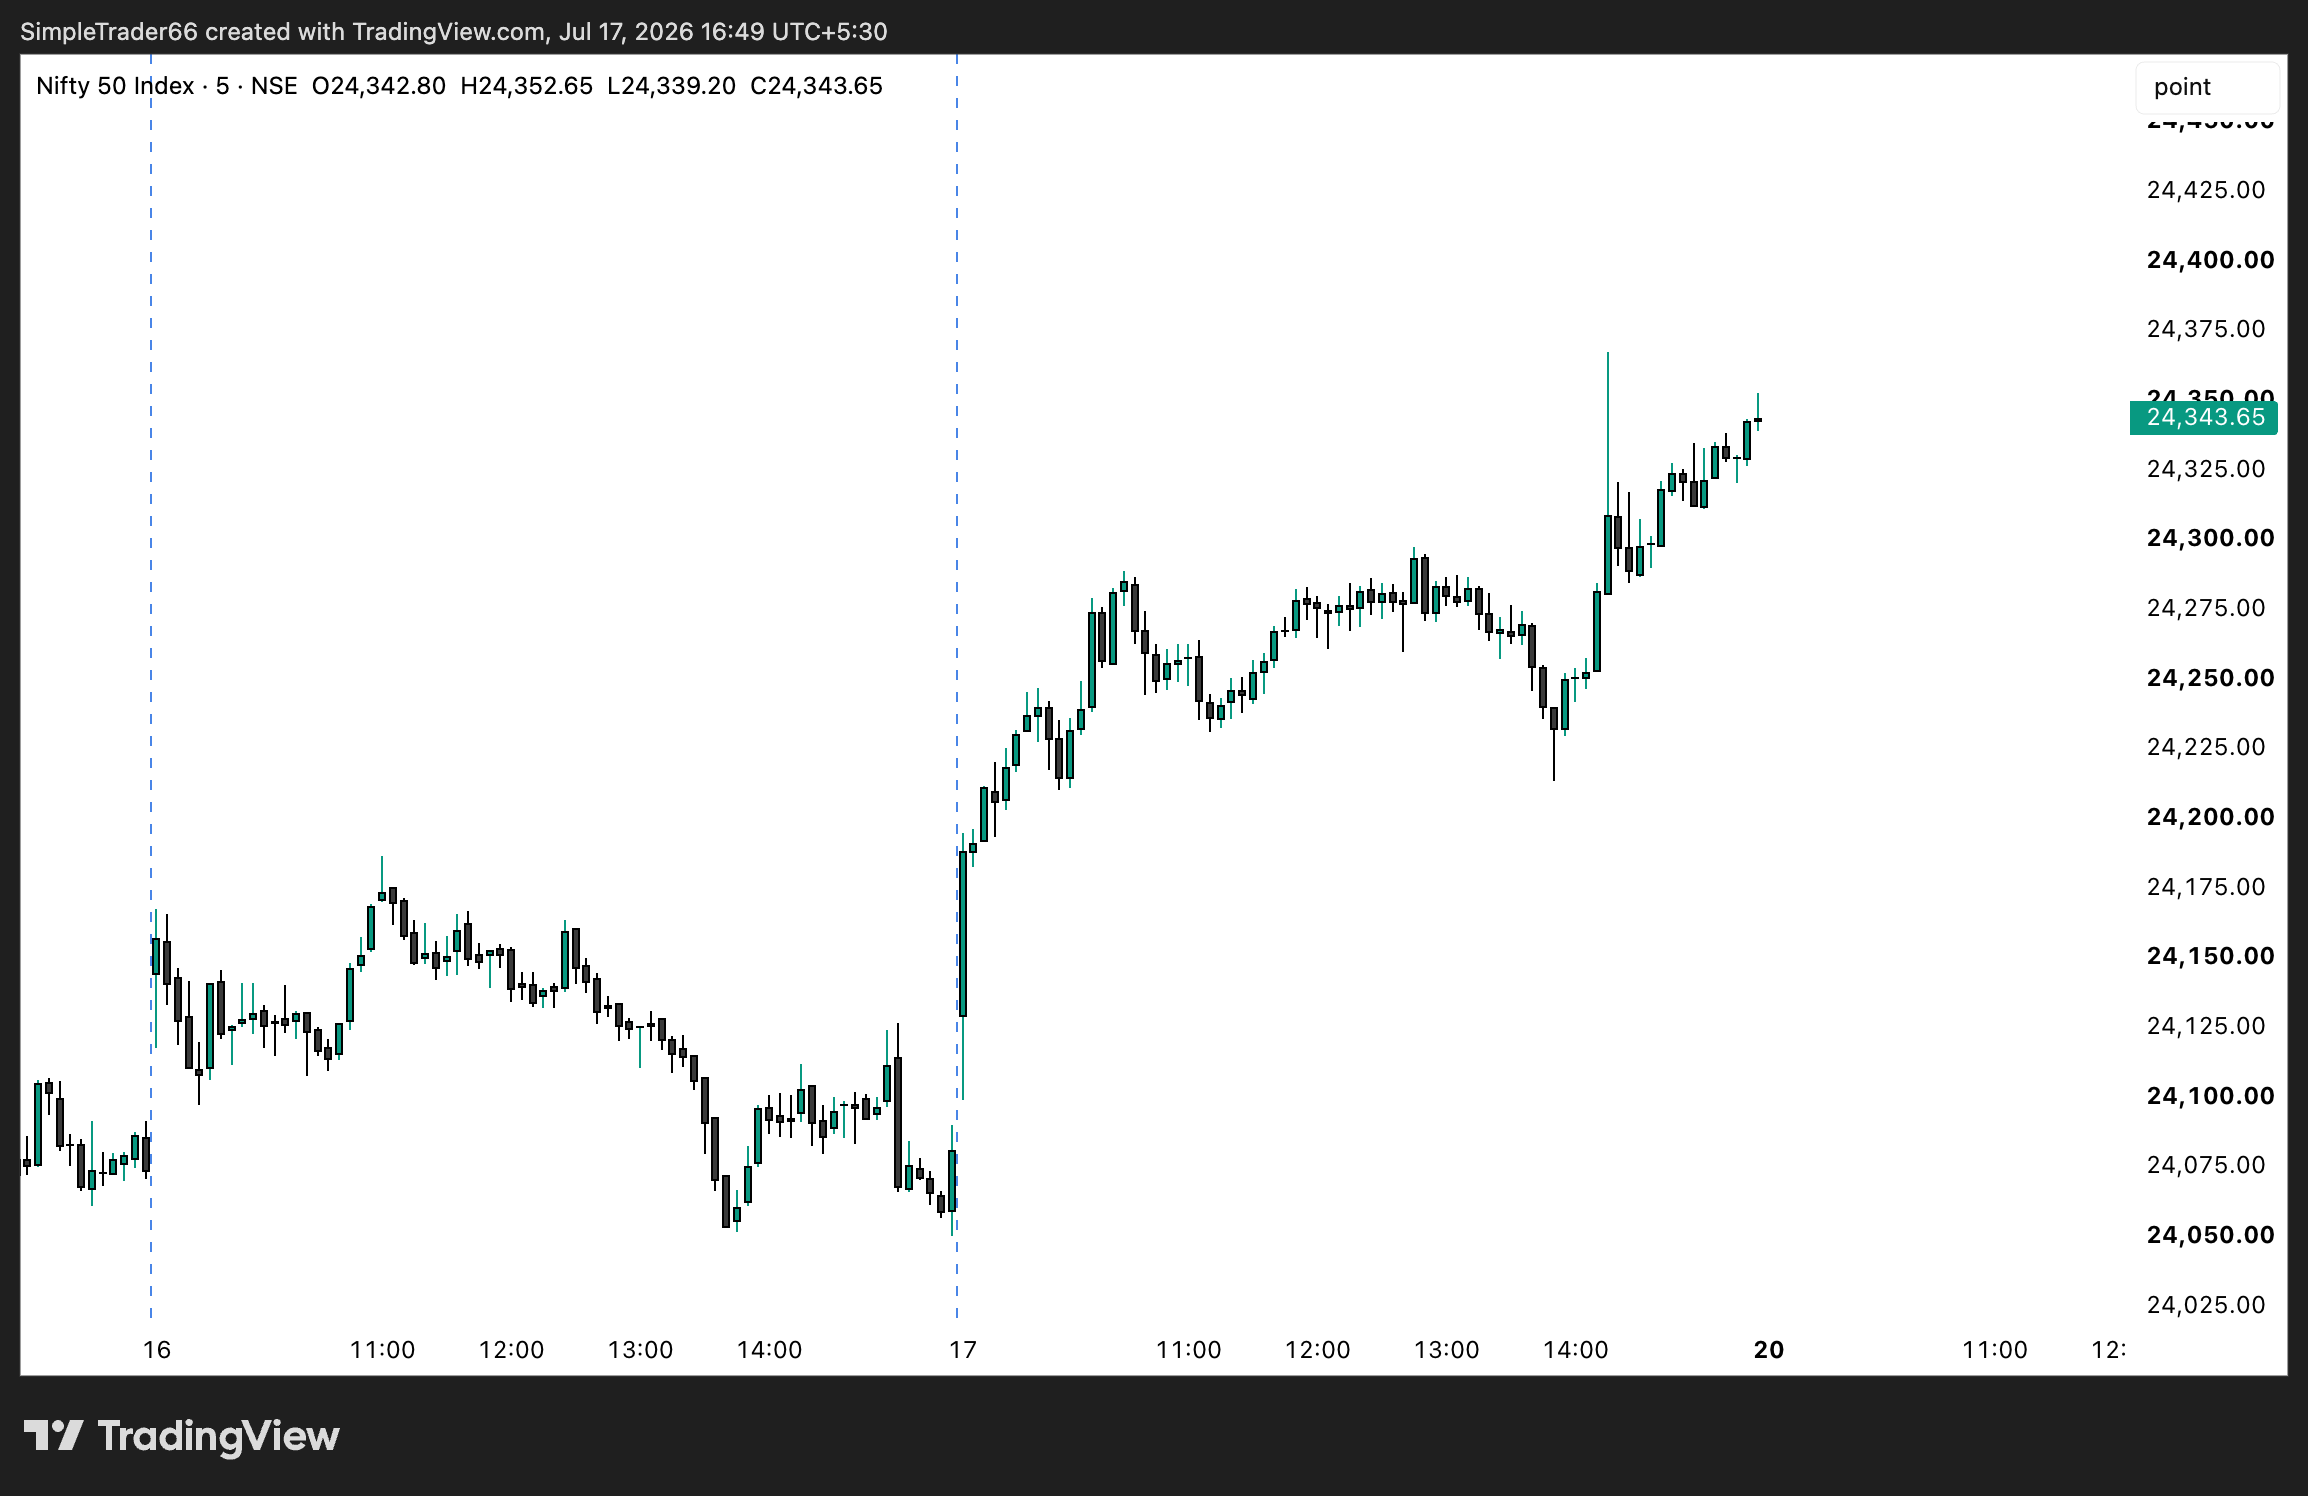
On 17 July 2026, the BOF Scanner provided an early indication that the market had a strong bullish bias.
The dashboard showed:
This created a clear imbalance in market participation.
Unlike waiting for price to confirm direction, the VRZ Count itself suggested buyers were dominating across multiple stocks, increasing the probability of an upward trending session.
The result?
Nifty rallied nearly 260 points during the day.
Every BOF Count is classified into either:
Rather than focusing on one stock, BOF Scanner measures how these signals are distributed across the entire market.
Think of it as a market breadth indicator based on Breakout Failure activity.
When one side significantly outnumbers the other, it often reveals where institutional participation is concentrated.
Total BOF: 21
VRZ Low: 16
VRZ High: 5
Nearly 76% of all BOF signals were generated from VRZ Low.
This means most stocks were showing bullish BOF structures instead of bearish ones.
That kind of imbalance usually leads to directional movement rather than a sideways session.
When BOF signals appear simultaneously across many stocks, they often represent broader market participation.
Today's data suggested:
Instead of trading individual charts, traders could simply observe the VRZ distribution to understand the day's likely market direction.
A simple framework:
Example:
This matched today's market behaviour.
When:
Example:
This often suggests stronger selling pressure across the market and increases the probability of a bearish trend.
When both counts remain close to each other:
Example:
or
Neither buyers nor sellers dominate, so the market is more likely to remain range-bound with lower directional conviction.
Many traders wait for Nifty itself to break important levels before forming a market view.
The BOF Scanner approaches the market differently.
Instead of watching only the index, it observes what hundreds of individual stocks are doing first.
When most stocks begin generating bullish BOF signals simultaneously, the index often follows.
This allows traders to understand market sentiment before large moves become obvious on the index chart.
Price tells you what has already happened.
Market breadth tells you what is developing beneath the surface.
The VRZ Count in BOF Scanner is designed to capture that underlying participation. Rather than relying solely on the Nifty chart, traders can monitor the balance between VRZ High and VRZ Low signals to gain an objective view of market sentiment.
While no indicator guarantees outcomes, combining VRZ Count with disciplined risk management and price action can provide valuable context for identifying higher-probability trading sessions.