
Select a trading day to view all Scanner results, chart evidence, and market explanations.
4 Scanners Available
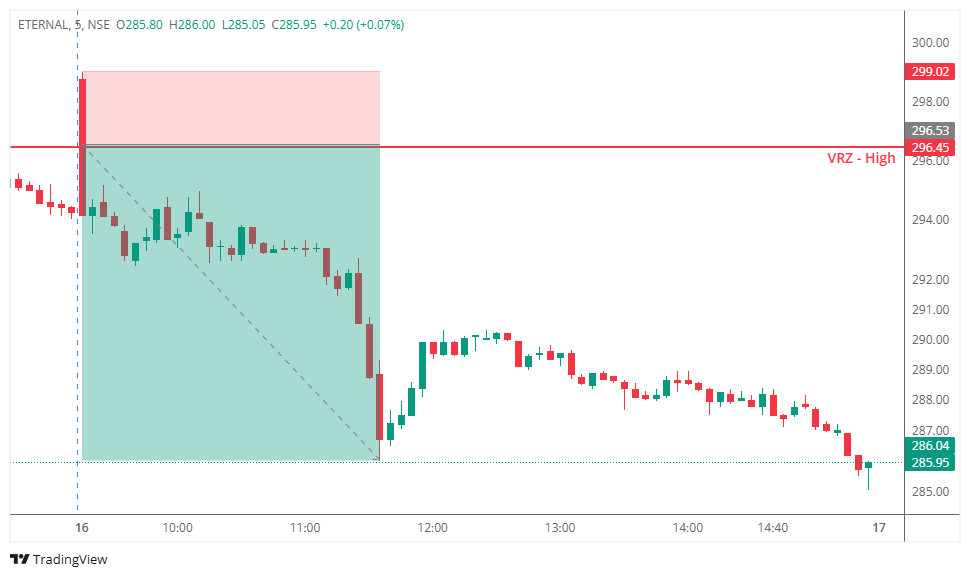

📍 ETERNAL briefly traded above the VRZ High, hinting at a potential bullish breakout.
⚠️ The breakout quickly lost momentum as price slipped back below the resistance level, invalidating the bullish move.
📉 This rejection confirmed a classic Breakout Failure (BOF), trapping breakout buyers and shifting control to the sellers.
💥 Consistent bearish momentum pushed the stock lower throughout the session with very few recovery attempts.
🎯 The BOF setup generated a strong 3.85% downside move while delivering an efficient 1:4 Risk-Reward.
Many traders initially expected:
🔹 A sustained breakout above the VRZ High.
🔹 Buyers to maintain control above resistance.
🔹 Continued bullish momentum toward higher intraday levels.
📍 The market had other plans.
🔸 Breakout buyers became trapped.
🔸 Selling pressure strengthened after the failed breakout.
🔸 Bulls failed to reclaim the resistance zone.
🔸 Bears gradually dominated the session.
🔸 The failed breakout evolved into a high-probability BOF bearish reversal.
💠 Failed Breakouts Can Reverse Quickly
When price cannot sustain above resistance, trapped buyers often accelerate the bearish move while exiting.
🎯 Confirmation Filters False Signals
The short opportunity became valid only after price accepted back below the VRZ High, reducing the risk of false breakouts.
🛡️ Smart Risk Management Pays Off
Using the VRZ High as the invalidation level created a clearly defined stop-loss while capturing an excellent 1:4 Risk-Reward.
📈 Trade with Confirmation, Not Assumptions
Waiting for BOF confirmation allowed traders to align with the actual market direction instead of anticipating a reversal.
📊 ETERNAL showcased a textbook Breakout Failure (BOF) where a failed move above resistance turned into a strong bearish trend.
⭐ Traders who waited for confirmation avoided the false breakout and capitalized on the sustained downside momentum.
📉 The clean market structure reinforced the importance of patience, confirmation, and disciplined execution.
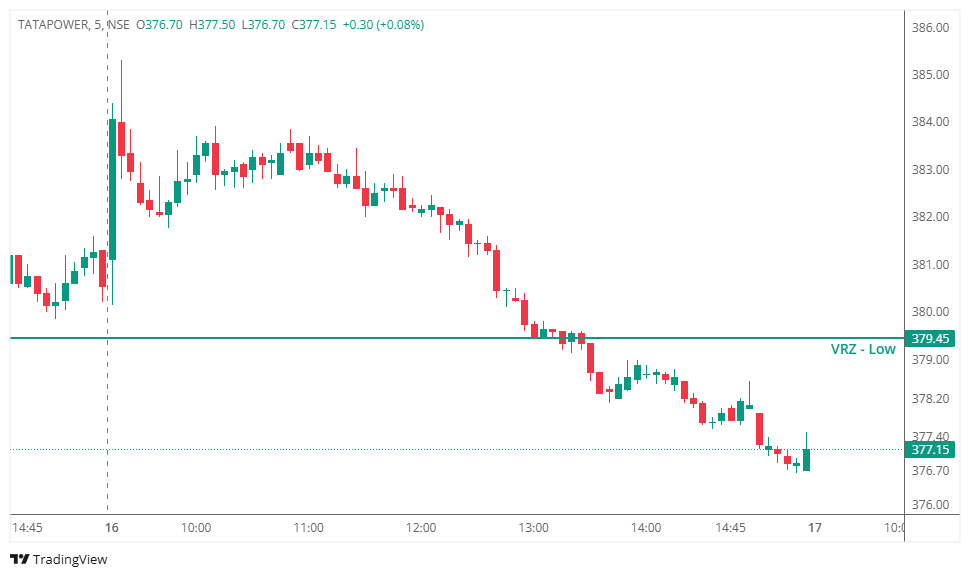

Price initially broke below the VRZ Low level of ₹379.45, creating the appearance of a classic Breakout Failure (BOF) buying opportunity. The setup triggered as price briefly moved back above the VRZ Low, suggesting that sellers had failed to sustain the breakdown.
However, buyers failed to build momentum after the trigger. Instead of continuing higher, selling pressure quickly returned and overwhelmed the buying interest.
The stock slipped back below the VRZ Low, turning the reclaimed support back into resistance. Sellers maintained control throughout the session, eventually triggering the stop loss on the BOF long setup.
The failed reclaim confirmed that bears remained dominant and that the bullish reversal thesis had become invalid.
A BOF Long setup becomes vulnerable when:
❌ Price fails to hold above the reclaimed VRZ Low.
❌ Buying momentum disappears immediately after entry.
❌ Lower highs begin forming near the trigger area.
❌ Sellers aggressively defend the VRZ zone.
❌ Downtrend momentum continues without strong buyer participation.
✅ Every trading setup has a probability of failure.
✅ Strict risk management protects capital during losing trades.
✅ A failed BOF often results in a strong continuation of the original trend.
✅ Long-term success comes from executing the strategy consistently—not from winning every trade.
This was a rule-based BOF setup executed according to the Logical Trading System (LTS). Although the trade ended in a controlled loss, the execution remained valid because it followed the predefined trading plan.
Professional traders focus on discipline over prediction. Accepting small losses, respecting stop losses, and staying committed to the trading process are what create consistency over hundreds of trades—not the outcome of any single position.
A failed setup is simply part of the statistical edge of a well-tested trading system.
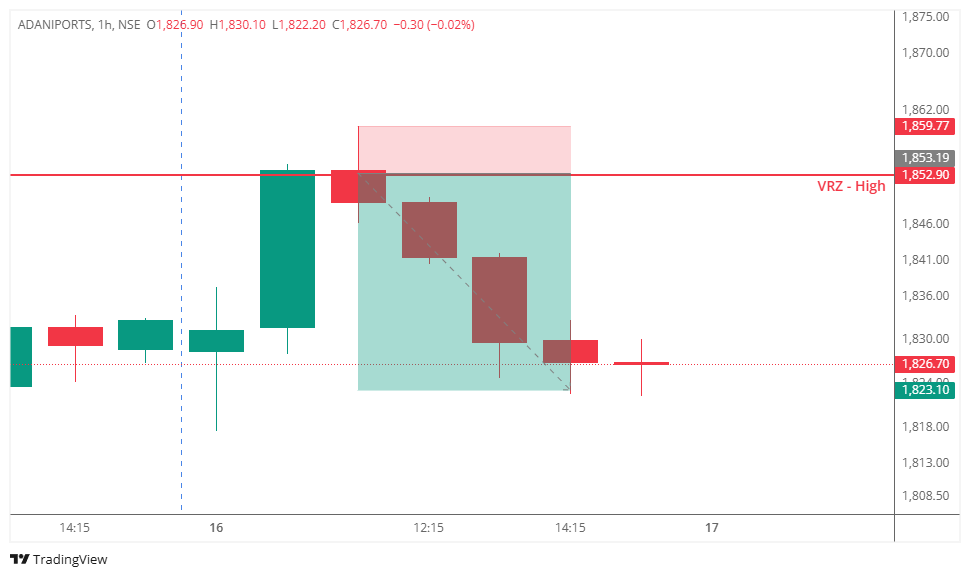

🎯 Adani Ports tested the previously identified VRZ High at ₹1,852.90 and briefly traded above the resistance zone, creating the impression that a bullish breakout had been confirmed.
📈 The initial breakout attracted fresh buyers expecting the stock to continue its upward momentum as resistance appeared to give way.
⚠️ However, the breakout quickly lost strength.
🔻 Sellers stepped in aggressively and pushed the stock back below ₹1,852.90. The following hourly candles confirmed acceptance beneath the VRZ High, indicating that the breakout lacked conviction and buyers had lost control.
✅ This price action confirmed a textbook Breakout Failure (BOF) setup.
💥 As the failed breakout became evident, trapped buyers exited their positions while fresh sellers joined the trend. The combination of long unwinding and aggressive selling resulted in a 3.54% downside move, successfully achieving the planned 1:4 risk-reward target.
Many traders believed:
🚀 The breakout above resistance would continue.
📊 Buyers had taken complete control.
📈 The stock was ready for a fresh rally.
The market reacted differently.
🔻 Price quickly slipped back below ₹1,852.90.
😮 Breakout buyers became trapped.
🛡️ Sellers regained control near the resistance zone.
📉 Bearish momentum strengthened as long positions were unwound.
This transition from bullish optimism to bearish dominance fueled the successful downside move.
🔹 A Breakout Is Valid Only with Sustained Acceptance
Temporary moves above the VRZ High are not enough to confirm a genuine breakout.
🔹 Quick Rejection Reflects Strong Seller Conviction
The swift move back below ₹1,852.90 highlighted aggressive selling pressure and weak buyer commitment.
🔹 Failed Breakouts Often Lead to Strong Bearish Moves
Trapped breakout buyers and fresh sellers frequently combine to create high-probability short opportunities.
🔹 Confirmation Improves Trade Quality
Waiting for price to sustain below the VRZ High after the rejection provided a disciplined BOF short setup with clearly defined risk.

The market doesn't always trend.
Some days, it spends hours moving within a range, trapping both buyers and sellers. Recognizing these conditions early can save traders from unnecessary losses and help them adjust their expectations.
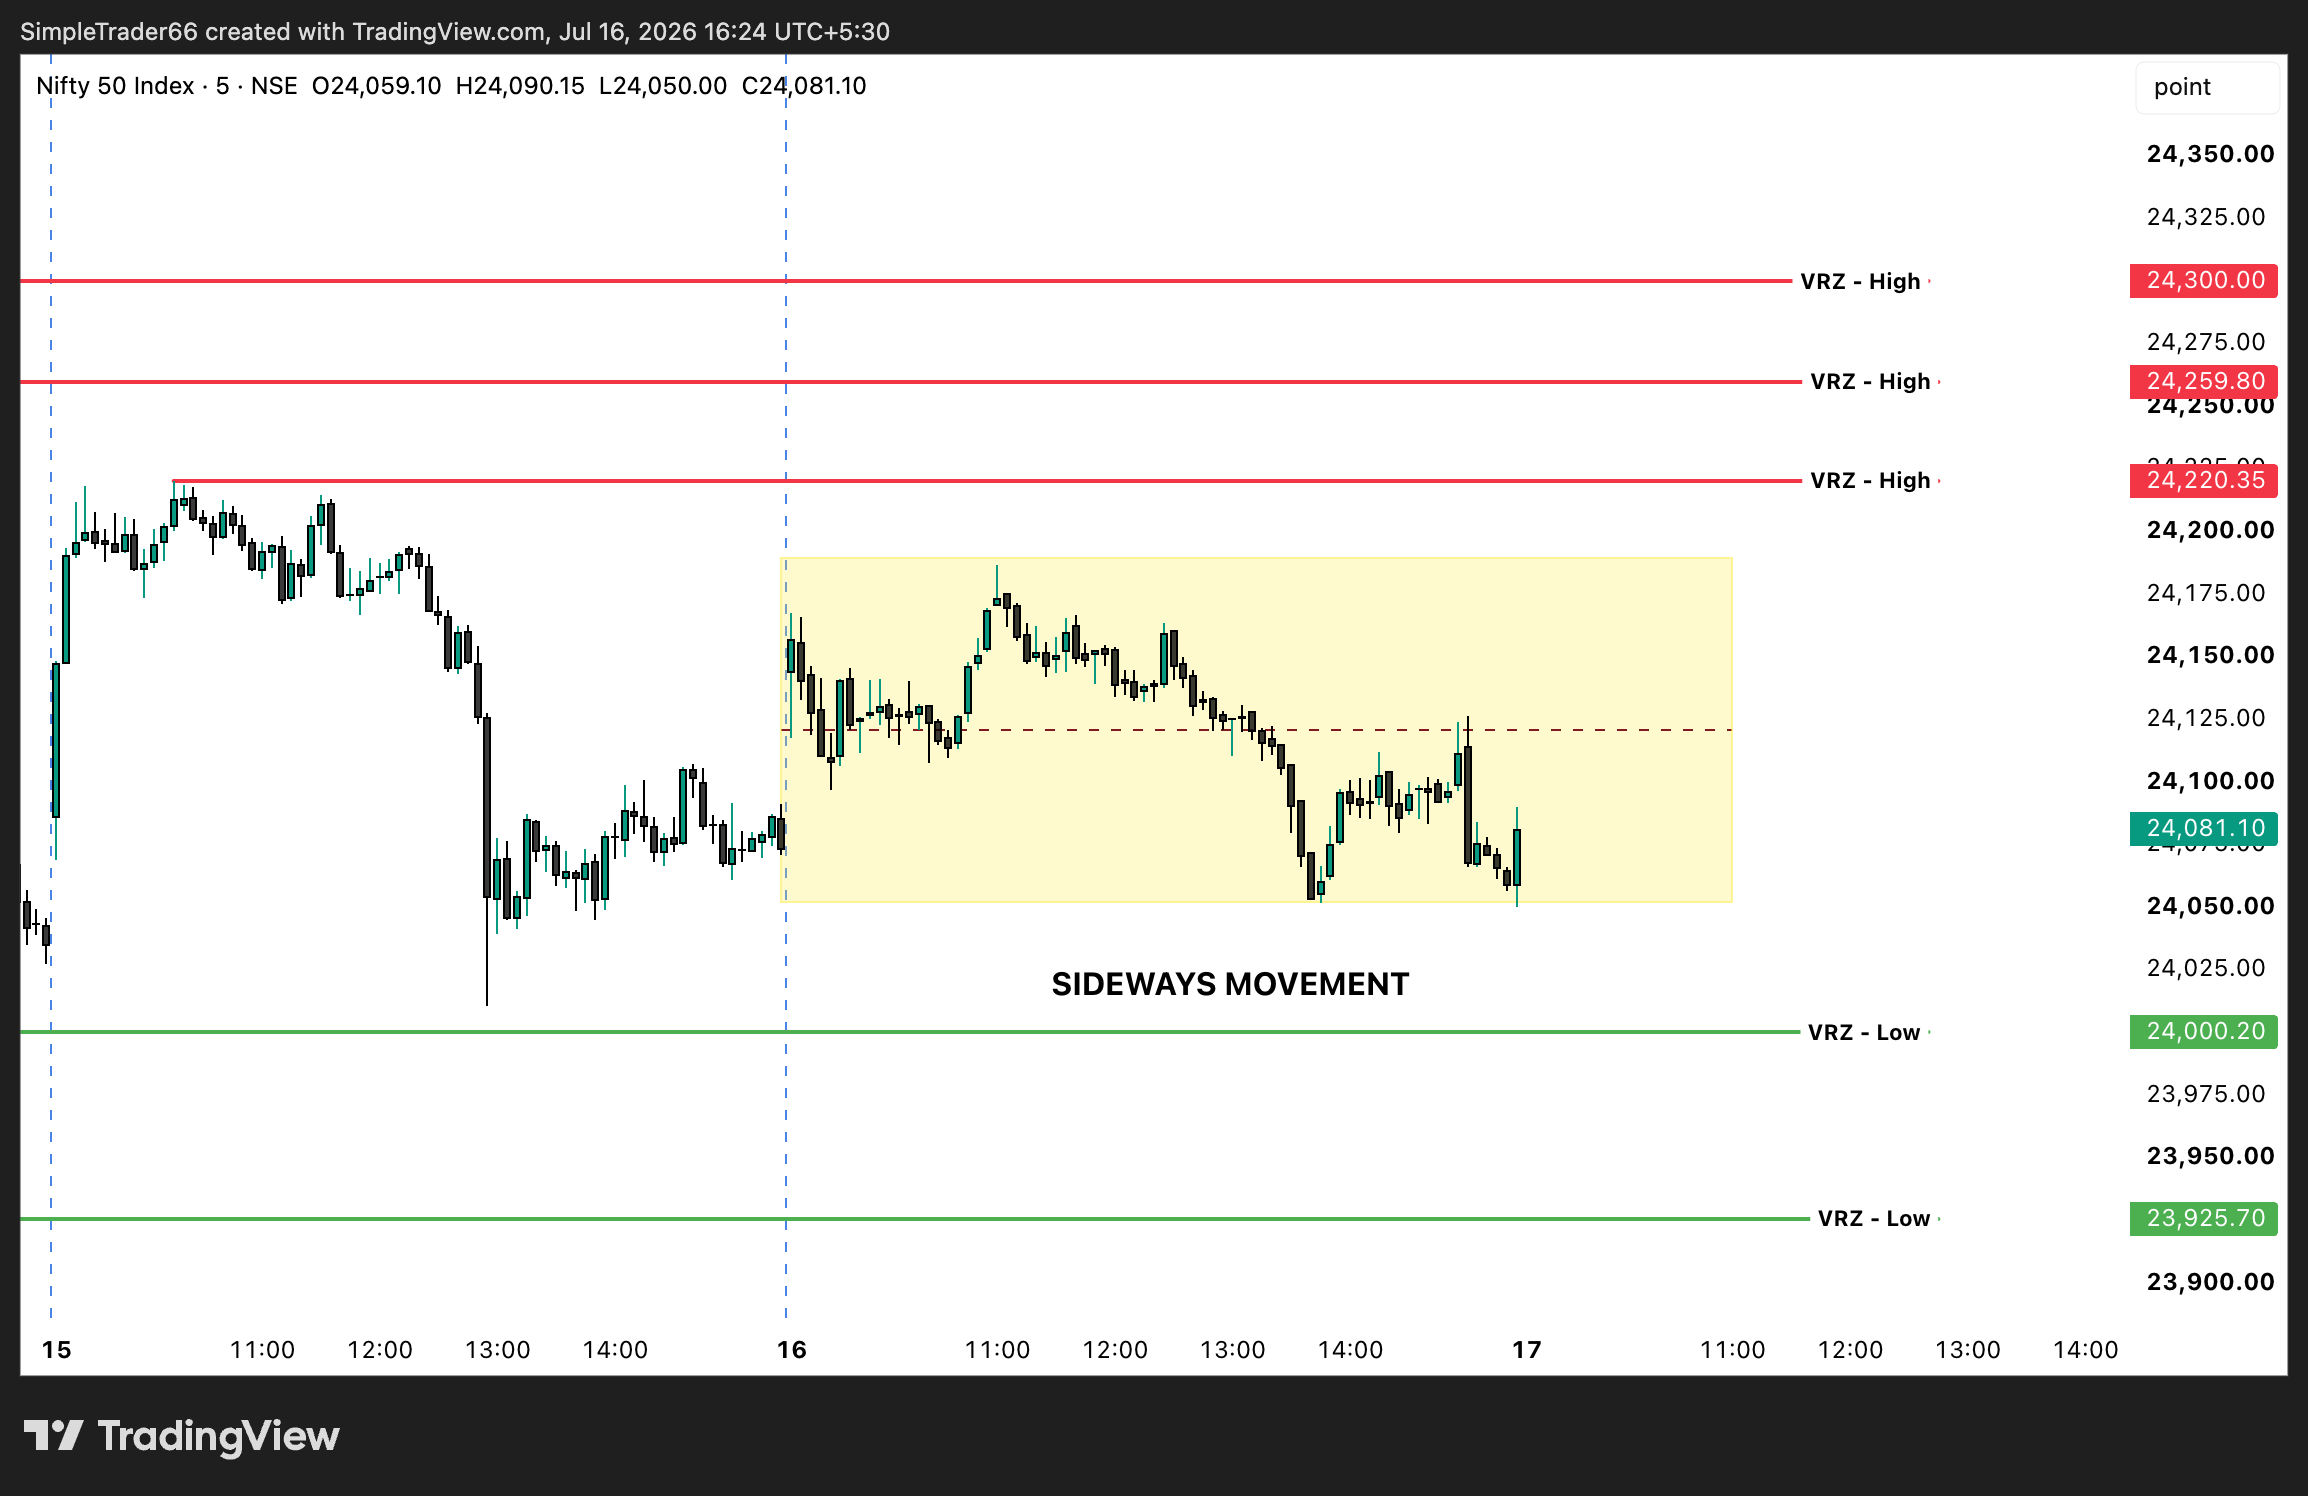
On 16 July 2026, the BOF Scanner provided an early clue that the market was unlikely to produce a strong directional move.
Index: Nifty 50
Timeframe: 5 Minutes
At first glance, the numbers appear slightly bearish because there are more VRZ High signals than VRZ Low. However, the difference is relatively small.
This balance between bullish and bearish breakout failures suggested that neither side had a significant advantage.
As a result, the market remained inside a range for most of the session.
The BOF Scanner classifies every breakout failure into two categories.
A breakout fails near an important resistance zone.
This usually indicates selling pressure entering the market.
More VRZ High signals generally suggest increasing bearish sentiment.
A breakout fails near an important support zone.
This usually indicates buyers stepping in after sellers fail to continue lower.
More VRZ Low signals generally suggest increasing bullish sentiment.
Today's BOF distribution was:
The difference was only 3 signals.
Although sellers had a slight advantage, buyers were also actively defending lower levels.
Neither side generated enough conviction to establish a sustained trend.
This balance created continuous back-and-forth price action instead of a directional move.
The Nifty chart clearly reflected this behavior, with price oscillating inside a defined range throughout the trading session.
One interesting behavior we've repeatedly observed is the relationship between the number of BOF signals.
Example:
Possible outcome:
Example:
Possible outcome:
Example:
Possible outcome:
An interesting pattern is when one side significantly outweighs the other.
For example:
This isn't a guaranteed prediction, but it can be a valuable way to gauge overall market sentiment before focusing on individual trade setups.
Many traders enter every session expecting a trend.
However, markets spend a considerable amount of time consolidating.
Recognizing this early allows traders to:
Sometimes, the best trade is simply knowing what kind of market you're trading.
Instead of relying only on price action, the BOF Scanner provides a broader view of market participation by showing:
This additional layer of information helps traders understand the market context before making trading decisions.
On 16 July 2026, the BOF Scanner reported:
The relatively balanced distribution indicated that buyers and sellers were evenly matched, resulting in a sideways trading session rather than a strong trend.
While BOF statistics should not be used in isolation, combining them with price action, support and resistance, and sound risk management can provide valuable insight into overall market conditions.
Understanding whether the market is likely to trend or consolidate is often just as important as identifying the next trade.
If this sounds logic with you, please feel free to share this article with your network. Let's bring back the reading habit again!