
Select a trading day to view all Scanner results, chart evidence, and market explanations.
3 Scanners Available
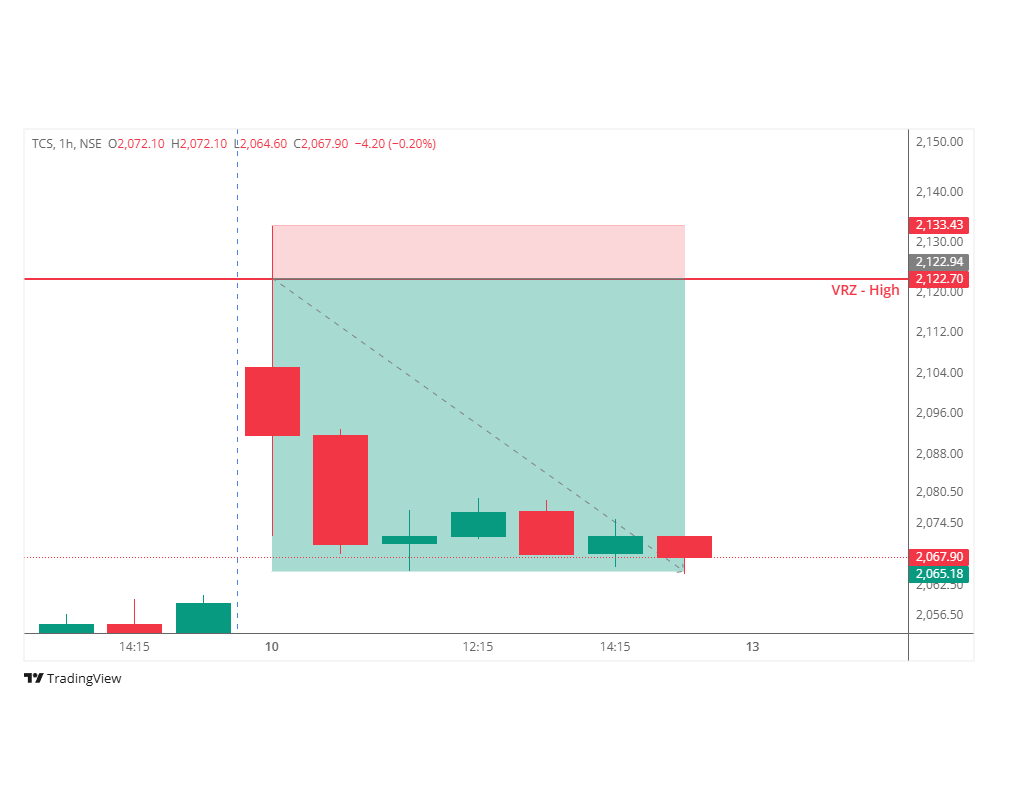

🎯 TCS tested the previously identified VRZ High at ₹2,122.70 and briefly traded into the resistance zone, giving the impression that a bullish breakout was developing.
📈 The initial move attracted breakout buyers who anticipated continued upside momentum as price challenged the key resistance.
⚡ However, the breakout lacked follow-through.
🔻 Selling pressure emerged immediately after the rejection, pushing the stock back below the VRZ High. From that point onward, price never revisited the resistance zone, highlighting strong seller dominance and the absence of any meaningful bullish recovery.
✅ The rejection confirmed a textbook Breakout Failure (BOF) setup.
💥 As trapped buyers exited their positions and fresh sellers entered the market, bearish momentum accelerated. The uninterrupted decline produced a 2.72% downside move, successfully achieving the planned 1:5 risk-reward target.
Many traders believed:
🚀 The breakout above resistance would continue.
📊 Buyers had gained full control of the trend.
🌟 Higher prices were only a matter of time.
The market reacted differently.
🔻 Price immediately slipped back below ₹2,122.70.
⛔ Buyers were trapped after the failed breakout.
🛡️ Sellers maintained complete control throughout the session.
📉 Price never returned to retest the VRZ High, confirming sustained bearish strength.
This transition from bullish confidence to aggressive selling fueled the successful downside move.
🔹 A Breakout Must Sustain Above Resistance
Temporary moves above the VRZ are not enough—continued acceptance is required to validate a genuine breakout.
🔹 Failure to Retest the VRZ Signals Strong Seller Control
Once price rejected the VRZ High, it never returned to the zone, reflecting persistent bearish conviction.
🔹 Trapped Buyers Can Accelerate Downside Momentum
As breakout traders exited losing positions, additional selling pressure strengthened the bearish move.
🔹 Patience Rewards Confirmation-Based Trading
Waiting for the BOF confirmation below the VRZ High provided a disciplined, high-probability short trade with clearly defined risk.
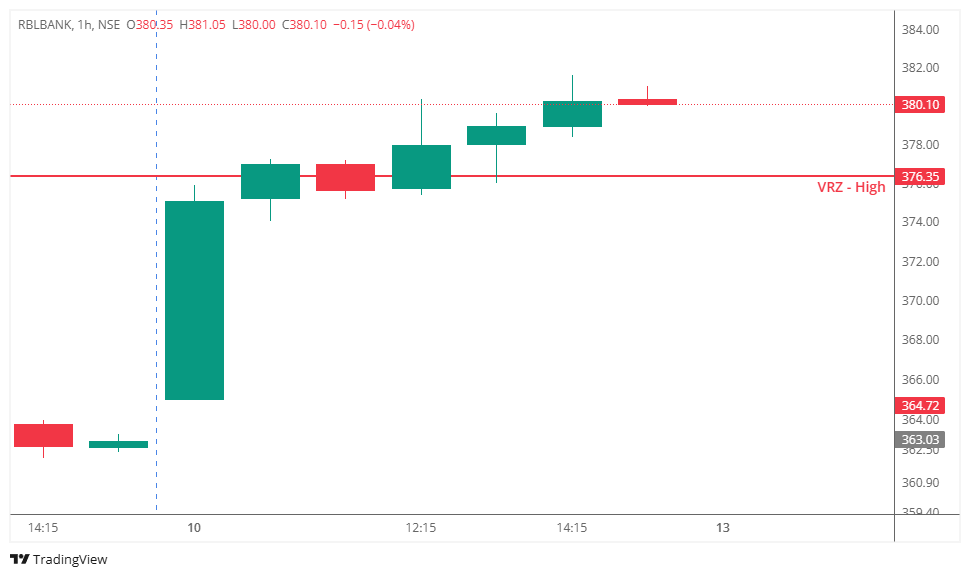

📈 RBLBANK moved above the VRZ High at ₹376.35, initially raising the possibility of a bearish Breakout Failure (BOF) if the price slipped back below the resistance.
👀 Traders closely watched for signs of rejection as the stock hovered around the breakout zone.
💪 Instead of reversing, buyers maintained strong control and price continued to hold firmly above the VRZ High.
✅ The sustained acceptance above the breakout level invalidated the BOF setup and confirmed genuine bullish strength.
🎯 This price action highlighted a successful breakout, rewarding traders who waited for confirmation instead of anticipating a reversal.
Many traders expected:
❌ The breakout above resistance would fail.
❌ Sellers would push the price back below the VRZ High.
❌ A bearish BOF would trigger a downside reversal.
The market behaved differently:
✅ Buyers defended the breakout level.
✅ Price consistently held above ₹376.35.
✅ Every minor dip attracted fresh buying.
✅ Bullish momentum remained intact, confirming the breakout.
🎯 Strong acceptance above the VRZ signaled that buyers were firmly in control.
✅ Strong Acceptance Validates the Trend
When price continues to hold above the VRZ, it confirms that buyers remain in control.
📈 Successful Breakouts Build Momentum
Sustained trading above resistance often attracts fresh buying and supports trend continuation.
🚫 Avoid Counter-Trend Assumptions
Expecting every breakout to fail can lead to low-probability trades. Let price action prove the reversal first.
🔍 Wait for Market Confirmation
Patience helps distinguish between a genuine breakout and a potential BOF, improving trade quality.
🎯 Trade What the Market Confirms
The strongest setups come from following confirmed price action rather than predicting what might happen.
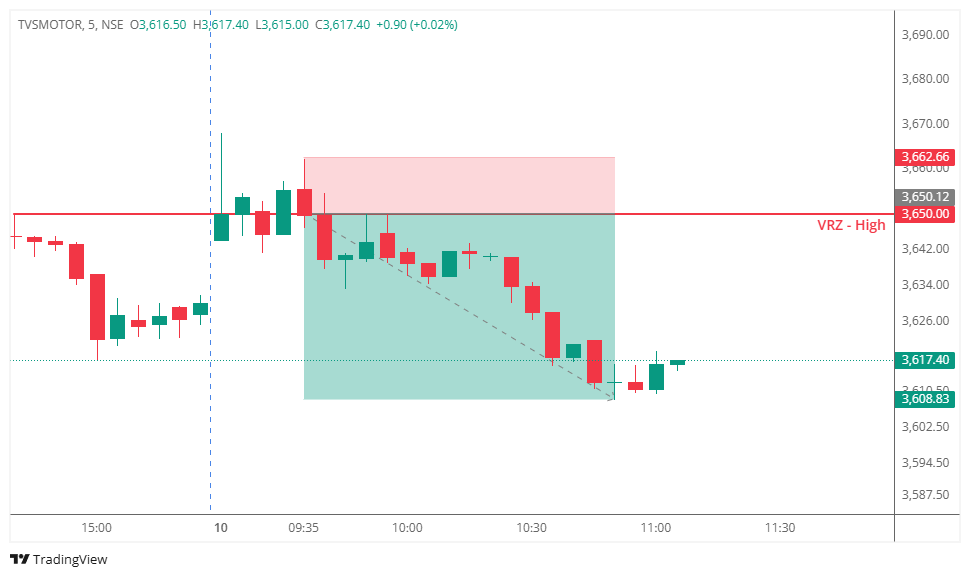

📍 TVSMOTOR approached the previously identified VRZ High during the morning session and briefly traded above the resistance zone, indicating a potential bullish breakout.
⚠️ However, the breakout failed to attract sustained buying participation.
📉 Instead of maintaining acceptance above the VRZ High, price quickly slipped back below the resistance level, confirming a classic Breakout Failure (BOF) setup. This rejection trapped aggressive breakout buyers and shifted short-term momentum toward the sellers.
📊 Following confirmation, selling pressure increased steadily as the stock respected the bearish structure throughout the session. The decline continued smoothly toward the predefined target, delivering a clean intraday reversal.
🎯 The setup generated a 1.13% downside move while achieving an impressive 1:3 Risk-Reward, showcasing the effectiveness of confirmation-based BOF trading.
Many traders initially expected:
🔹 The breakout above the VRZ High would continue higher.
🔹 Buyers would establish strong acceptance above resistance.
🔹 Bullish momentum would push the stock toward fresh intraday highs.
📌 The market had different plans.
After price moved back below the VRZ High:
🔸 Breakout buyers became trapped.
🔸 Selling pressure gradually intensified.
🔸 Bulls failed to reclaim the resistance zone.
🔸 Sellers gained control of the short-term trend.
🔸 The failed breakout evolved into a textbook BOF reversal.
🔶 Failed Breakouts Often Create Reversal Opportunities
When price cannot sustain above a key resistance level, trapped buyers frequently accelerate the downside move as they exit their positions.
🔷 Confirmation Filters False Signals
The short trade became valid only after price accepted back below the VRZ High, helping traders avoid premature entries.
🟣 Structured Risk Improves Consistency
Using the VRZ High as the invalidation level provided a logical stop-loss while allowing traders to capture a disciplined 1:3 Risk-Reward.
🟢 Follow Confirmed Market Structure
Successful BOF trades come from reacting to confirmed price action rather than predicting reversals.

📊 This TVSMOTOR session demonstrated why Breakout Failure (BOF) remains one of the most reliable price action strategies for intraday trading.
⭐ The initial breakout attracted bullish participation, but the inability to sustain above the VRZ High quickly shifted market control in favor of the sellers.
🚀 Traders who waited for confirmation instead of chasing the breakout were rewarded with a high-probability reversal backed by clearly defined risk.
📉 The bearish structure remained intact from entry to target, reinforcing the importance of patience, confirmation, and disciplined execution.