
Select a trading day to view all Scanner results, chart evidence, and market explanations.
5 Scanners Available
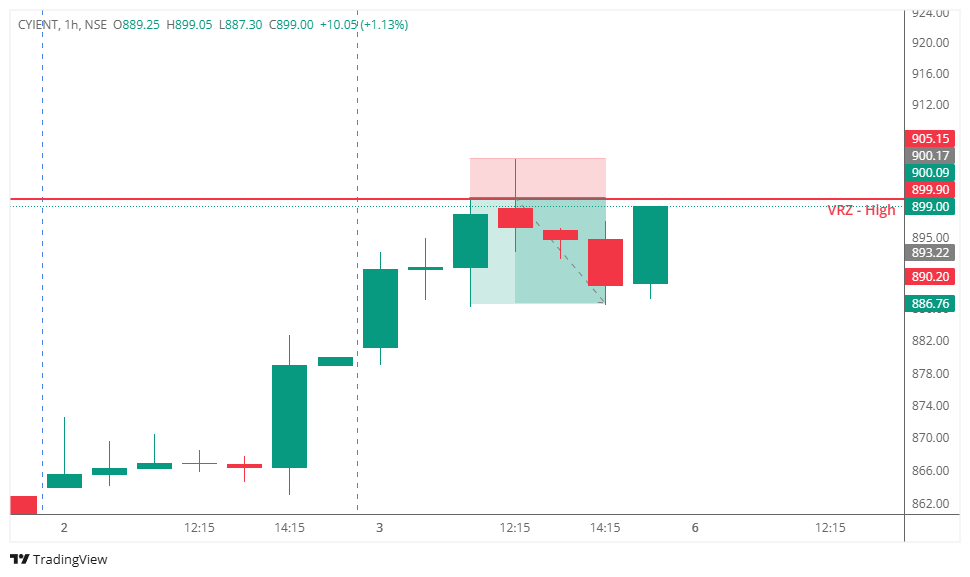
🎯 Cyient tested the previously identified VRZ High at ₹899.00 and briefly traded above the resistance zone, giving the impression that a bullish breakout had been confirmed.
📈 Initially, the move encouraged fresh buyers to enter, expecting the stock to continue its upward momentum. Meanwhile, bearish traders became cautious as price appeared to overcome the key resistance.
⚠️ However, the breakout failed to sustain.
🔄 Instead of extending higher, sellers stepped in aggressively and pushed the stock back below ₹899.00. The subsequent hourly candles established acceptance beneath the VRZ High, confirming that buying momentum had weakened considerably.
✅ This price action validated a classic Breakout Failure (BOF) setup.
💥 As the failed breakout became evident, breakout buyers started exiting their positions while fresh sellers initiated new short trades. The combination of long unwinding and increased selling pressure drove a 1.49% downside move, successfully achieving the planned 1:2 risk-reward target.
Many traders believed:
🚀 The breakout above resistance was genuine.
📈 Buyers would continue pushing prices higher.
🌟 The stock had entered a fresh bullish trend.
However, the market told a different story.
🔻 Price quickly slipped back below ₹899.00.
😮 Breakout buyers found themselves trapped.
🛡️ Sellers regained control near the resistance zone.
⚡ Bearish momentum accelerated as long positions were unwound.
📉 This shift from bullish confidence to bearish control fueled the successful downside move.
🔹 Sustained Acceptance Above Resistance Confirms a Breakout
A breakout is only considered valid when price continues to trade above the resistance zone.
🔹 Rapid Rejection Reflects Weak Buyer Strength
The swift move back below ₹899.00 highlighted aggressive selling pressure and the inability of buyers to defend higher prices.
🔹 Failed Breakouts Can Create High-Probability Short Opportunities
Trapped breakout buyers often fuel stronger bearish momentum through long liquidation.
🔹 Patience Leads to Better Trade Quality
Waiting for price to confirm acceptance below the VRZ High provided a disciplined, high-probability BOF short setup with clearly defined risk.

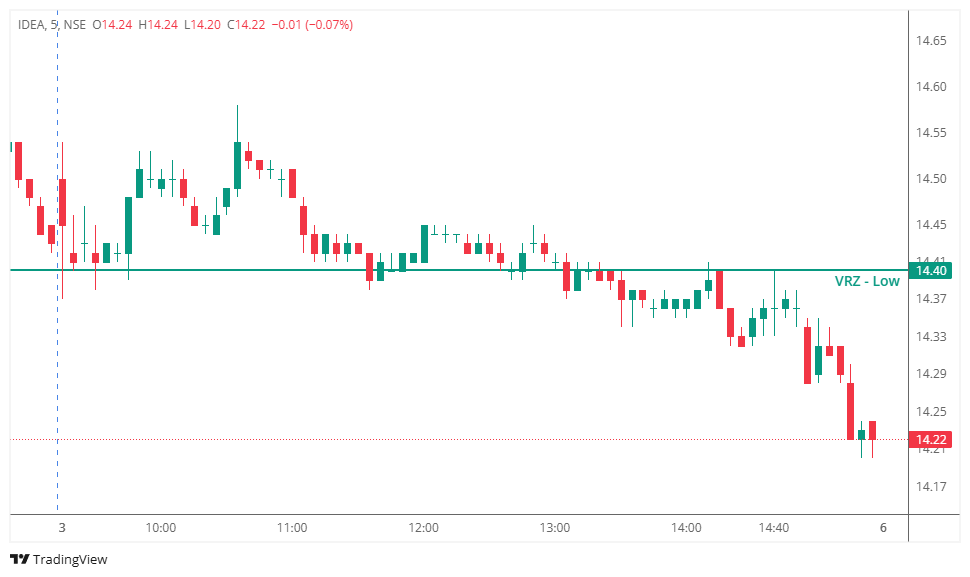
IDEA approached the VRZ Low at ₹14.40, creating the possibility of a bullish Breakout Failure (BOF) as traders watched for a quick reclaim above support.
However, buyers failed to regain the VRZ Low, and selling pressure strengthened instead. Price remained below ₹14.40, confirming bearish acceptance and continued downside momentum.
Without a successful reclaim above the VRZ, the bullish BOF setup never confirmed, resulting in no valid LTS trade opportunity.
Many traders expected:
🔹 The VRZ Low would act as strong support.
🔹 Sellers below the breakdown would become trapped.
🔹 A failed breakdown would trigger a bullish intraday reversal.
🔹 Buyers would reclaim the VRZ and regain control.
✔️ Sellers firmly defended prices below ₹14.40.
✔️ Buying pressure remained weak throughout the session.
✔️ Price continued to accept lower levels instead of recovering.
✔️ Every pullback attracted fresh selling pressure.
✔️ The anticipated bullish BOF confirmation never developed.
⚠️ Instead of reversing higher, the breakdown strengthened as bearish momentum continued to dominate.
A valid bullish BOF requires price to break below support and then quickly reclaim it. Since IDEA remained below ₹14.40, the BOF setup never qualified for execution.
When sellers maintain control below an important support level, the probability of continued downside movement increases significantly.
If buyers cannot regain the breakdown level, the previous support frequently becomes new resistance, allowing the bearish trend to continue.
Patience is critical in BOF trading. Waiting for a confirmed reclaim above the VRZ helps traders avoid entering low-probability reversal trades.
💡 Key Lesson: Under the Logical Trading System (LTS), trade only confirmed price action—not expectations.

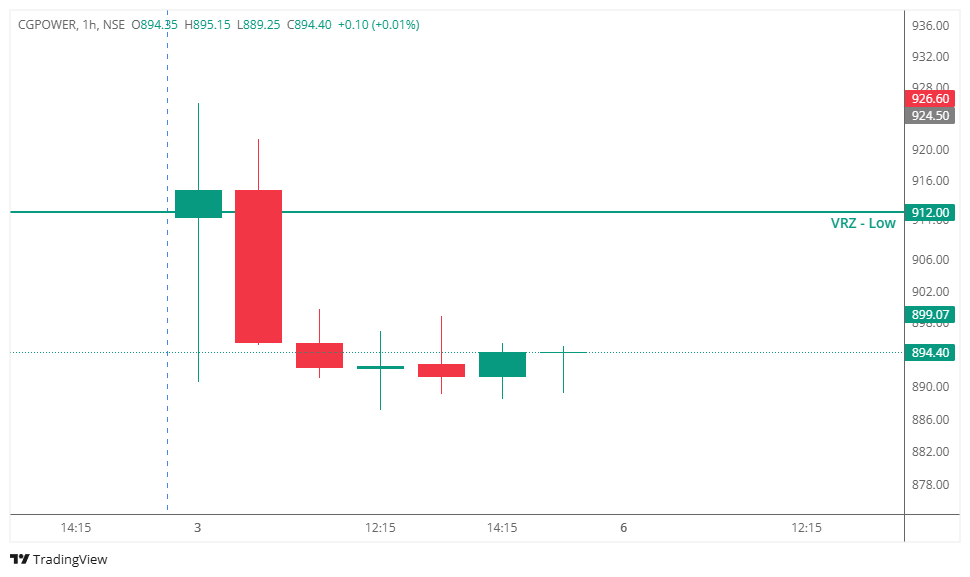
CGPOWER briefly traded below the VRZ Low at ₹912.00, suggesting a possible bearish breakdown. Buyers attempted to reclaim the level, creating expectations of a bullish Breakout Failure (BOF).
However, the recovery lacked strength, and price failed to sustain above the VRZ. Without a confirmed reclaim, the BOF setup remained invalid, resulting in no high-probability long trade.
Many traders expected:
❌ A strong bullish reclaim above the VRZ Low.
❌ Short sellers to get trapped, triggering a sharp upside reversal.
❌ Buyers to regain control after the initial rejection.
However, the market behaved differently:
⚠️ Buyers failed to sustain momentum near the VRZ.
📍 Price remained below ₹912.00, keeping resistance intact.
🔄 Selling pressure prevented a confirmed BOF reversal.
🚫 No bullish confirmation candle developed above the VRZ.
🎯 Without confirmation, the setup remained invalid and offered no quality long entry.
✅ Confirmation Is More Important Than Anticipation
A BOF becomes tradable only after price reclaims and sustains above the VRZ.
📍 Testing the VRZ Doesn't Confirm a Reversal
Price must establish acceptance above the level before bullish conviction returns.
⚠️ Avoid Trading Incomplete BOF Setups
Entering before confirmation increases the risk of getting trapped in weak price action.
🛡️ Patience Helps Preserve Capital
Skipping unconfirmed trades is often the better decision than forcing an early entry.
📈 Strong BOFs Need Follow-Through Buying
Without sustained buying pressure, a recovery attempt remains only a possibility—not a valid setup.
🎯 High-Probability Trades Come After Confirmation
Waiting for a decisive reclaim above the VRZ significantly improves trade quality.

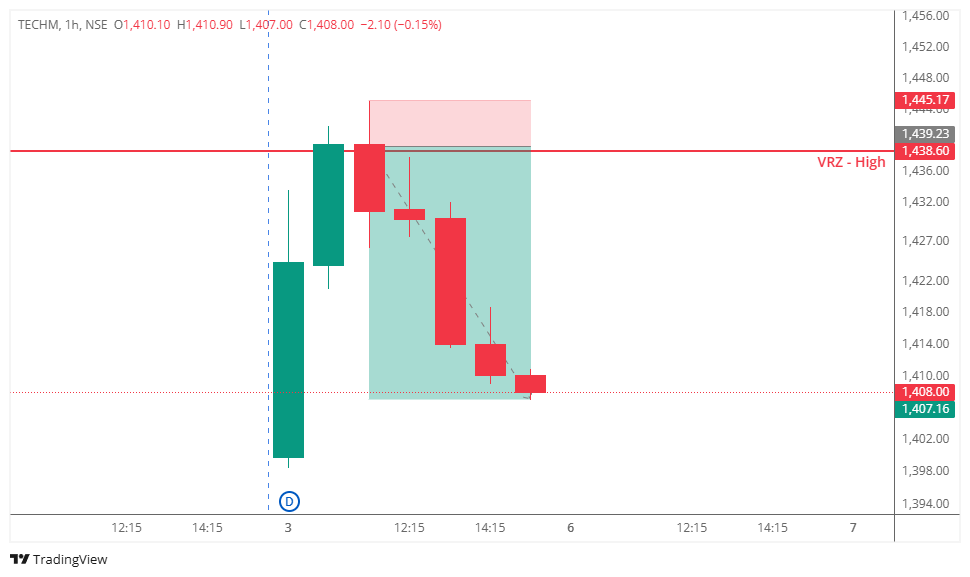
🔼 Tech Mahindra approached the previously identified VRZ High at ₹1,438.60 and briefly traded above the resistance zone, creating the impression that a bullish breakout had been confirmed.
📈 Initially, the move attracted fresh buyers expecting the stock to continue higher, while short sellers became cautious as price pushed above the key resistance level.
⚠️ However, the market failed to sustain above the VRZ.
🔻 Instead of extending the breakout, selling pressure quickly emerged and forced the stock back below ₹1,438.60. The following hourly candles confirmed acceptance below the resistance zone, signaling that buyers had lost control and the breakout lacked genuine strength.
✅ This price action confirmed a classic Breakout Failure (BOF) setup.
💥 As the failed breakout became evident, trapped buyers started exiting their positions while fresh sellers entered the market. The combination of long unwinding and new selling pressure triggered a strong downside move, resulting in a 2.23% decline while successfully achieving the planned 1:5 risk-reward target.
Many traders assumed:
❌ The breakout above resistance was genuine.
❌ Buyers had taken complete control of the trend.
❌ Higher prices were likely to follow.
The market responded differently.
✅ Price quickly fell back below ₹1,438.60.
✅ Breakout buyers lost conviction.
✅ Sellers recognized the rejection from resistance.
✅ Bearish momentum strengthened as long positions were unwound.
This shift from bullish optimism to aggressive selling fueled the sharp downside move.
✅ Acceptance Above Resistance Determines Direction
A breakout is only valid when price sustains above the resistance zone.
✅ Rejection of the VRZ Signals Seller Strength
The swift move back below ₹1,438.60 highlighted aggressive selling interest and weakening buying momentum.
✅ Failed Breakouts Often Lead to Sharp Declines
Trapped buyers exiting their positions, combined with fresh short selling, can accelerate bearish momentum.
✅ Confirmation Improves Trade Quality
Waiting for BOF confirmation below the VRZ High provided a higher-probability short setup with clearly defined risk.

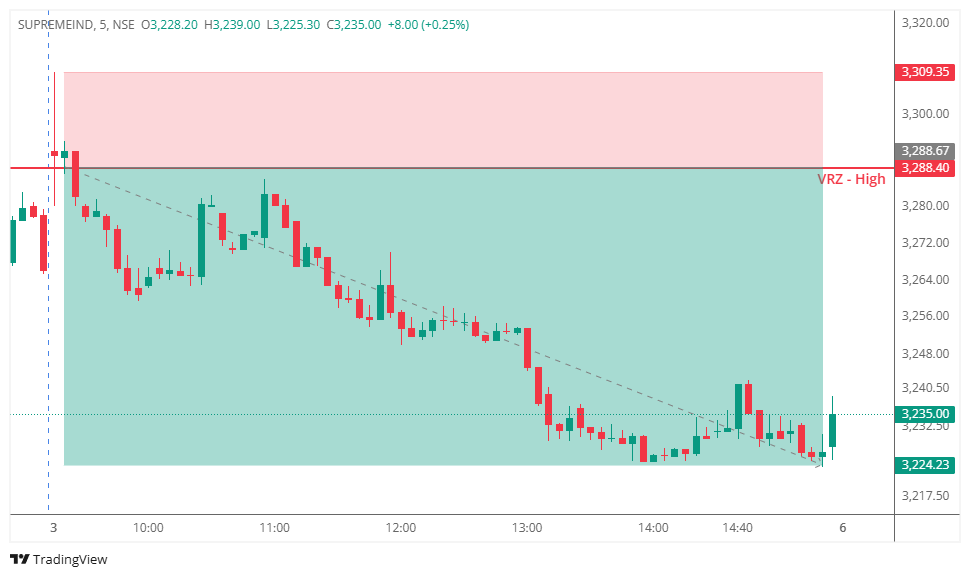
📍 SUPREMEIND approached the previously identified VRZ High during the opening phase of the session and briefly traded above the resistance zone, indicating a potential bullish breakout.
⚠️ However, the breakout failed to attract sustained buying interest.
📉 Instead of holding above the VRZ High, price quickly moved back below the resistance level, confirming a classic Breakout Failure (BOF) setup. This rejection trapped aggressive breakout buyers and shifted short-term market control in favor of the sellers.
🔻 Following confirmation, selling pressure steadily increased as the stock respected the bearish structure throughout the session. The decline continued smoothly toward the predefined target, delivering a clean intraday reversal.
🎯 The setup generated an impressive 1.96% move while achieving a disciplined 1:3 Risk-Reward, highlighting the effectiveness of confirmation-based BOF trading.
Many traders initially expected:
➡️ The breakout above the VRZ High would extend higher.
➡️ Buyers would establish acceptance above the resistance zone.
➡️ Fresh bullish momentum would drive the stock to new intraday highs.
The market had different intentions.
After price slipped back below the VRZ High:
➡️ Breakout buyers became trapped.
➡️ Selling pressure steadily intensified.
➡️ Bulls failed to reclaim the resistance level.
➡️ Sellers gained control of the short-term trend.
➡️ The failed breakout developed into a textbook BOF reversal.
🔴 Failed Breakouts Can Offer High-Probability Reversals
🟠 Confirmation Improves Trade Quality
🟢 Structured Risk Creates Better Opportunities
🔵 Let Price Action Confirm Market Direction
📊 This SUPREMEIND session demonstrated why Breakout Failure (BOF) remains one of the most reliable price action strategies for intraday trading. The initial breakout attracted momentum buyers, but the inability to sustain above the VRZ High quickly shifted control to the sellers.
✅ By waiting for confirmation instead of chasing the breakout, disciplined traders entered a high-probability reversal with clearly defined risk and favorable reward.
📉 The setup respected the bearish structure from entry to target, reinforcing the importance of patience, confirmation, and disciplined execution for consistent BOF trading success.
