
Select a trading day to view all Scanner results, chart evidence, and market explanations.
4 Scanners Available
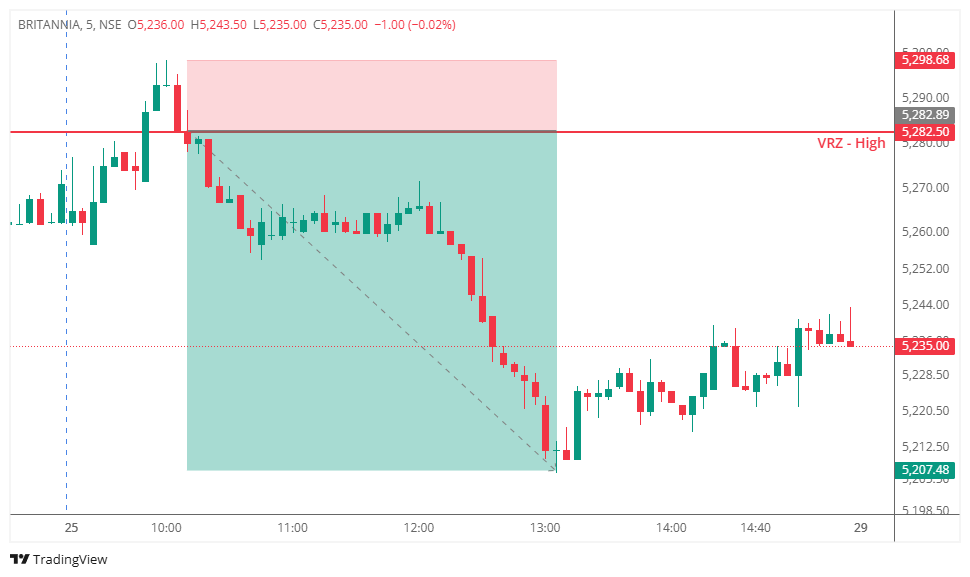
BRITANNIA approached the previously identified VRZ High at ₹5,282.50 and initially traded above the resistance zone, creating the appearance of a bullish breakout.
The move attracted buyers expecting continued upside momentum and a fresh expansion above resistance. Price briefly sustained above the VRZ, encouraging breakout participants to enter long positions.
However, the breakout failed to gain acceptance.
Selling pressure emerged near the highs, forcing price back below ₹5,282.50. This rejection signaled that buyers were unable to maintain control above resistance and that the breakout lacked the conviction required for continuation.
As price continued trading below the VRZ High, the failed breakout evolved into a confirmed bearish BOF setup.
The combination of trapped breakout buyers exiting positions and fresh sellers entering the market generated sustained downside momentum throughout the session.
Many traders assumed:
❌ The breakout above ₹5,282.50 would trigger a sustained rally.
❌ Buyers would establish acceptance above resistance.
❌ Momentum would remain in favor of the bulls.
The market disagreed.
When price moved back below the VRZ High:
✅ Breakout buyers began losing confidence.
✅ Long positions started unwinding.
✅ Sellers recognized the failed breakout opportunity.
✅ Bearish momentum steadily increased.
This shift in sentiment transformed bullish expectations into a strong intraday bearish move.
✅ A failed breakout becomes meaningful only when price returns below the resistance zone.
✅ The inability to sustain above ₹5,282.50 revealed weakening buyer conviction and increasing seller participation.
✅ Waiting for acceptance below the VRZ High reduced risk and improved trade probability.

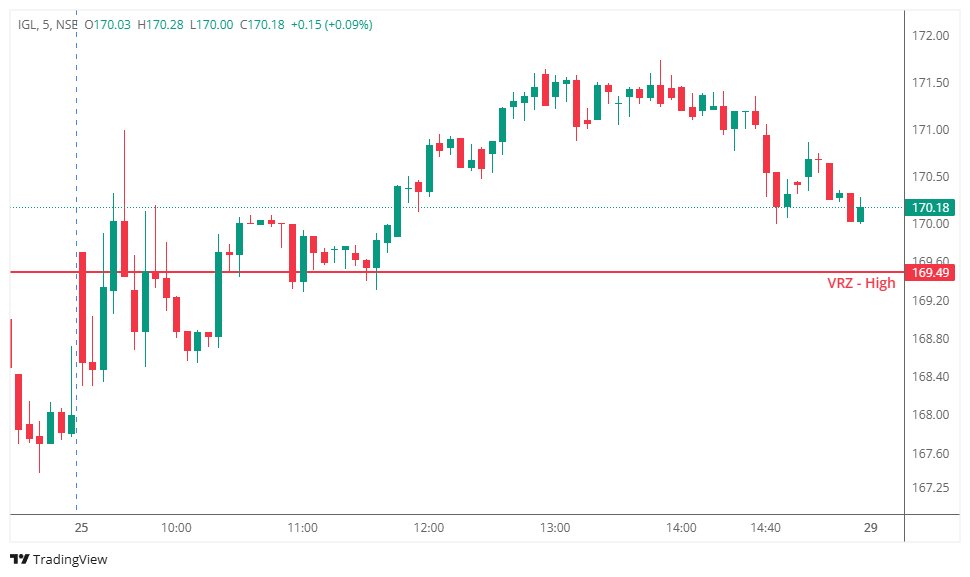
IGL approached the previously identified VRZ High at ₹169.49 and initially traded above the resistance zone, creating the possibility of a bearish Breakout Failure (BOF) setup.
At first glance, the move suggested that buyers might struggle to maintain control above resistance and that a rejection could trigger a downside reversal. The breakout attracted attention from traders anticipating a potential BOF short opportunity.
However, the market failed to provide the confirmation required for a valid BOF.
Instead of rejecting the breakout and moving back below the VRZ High, price established acceptance above ₹169.49 and continued trading comfortably above the resistance zone. Buyers remained active, and the stock maintained a structure of higher highs and higher lows throughout much of the session.
Although minor pullbacks appeared later in the day, price never produced the decisive rejection required to confirm a bearish BOF.
As a result, the potential BOF setup remained invalidated, and no high-probability short trade was triggered.
Many traders assumed:
The market disagreed.
When price sustained above ₹169.49:
This shift from expected rejection to continued acceptance prevented the BOF setup from becoming a valid trading opportunity.
1. A Breakout Must Fail to Become a BOF
Trading above resistance alone does not create a BOF. Rejection and acceptance back below the level are essential.
2. Acceptance Reveals Market Strength
The market's ability to sustain above ₹169.49 indicated genuine buying interest rather than a temporary breakout.
3. Confirmation Matters More Than Assumptions
Expecting a reversal without confirmation can lead to unnecessary risk.
4. No Trade Is Better Than a Forced Trade
Avoiding incomplete BOF setups helps preserve capital and trading discipline.
This IGL setup highlighted the importance of waiting for complete BOF confirmation before taking action. While the initial breakout created the appearance of a potential failure, the market never delivered the rejection necessary to validate the setup.
By respecting confirmation rules and avoiding premature entries, traders remained aligned with the principles of disciplined price-action trading.

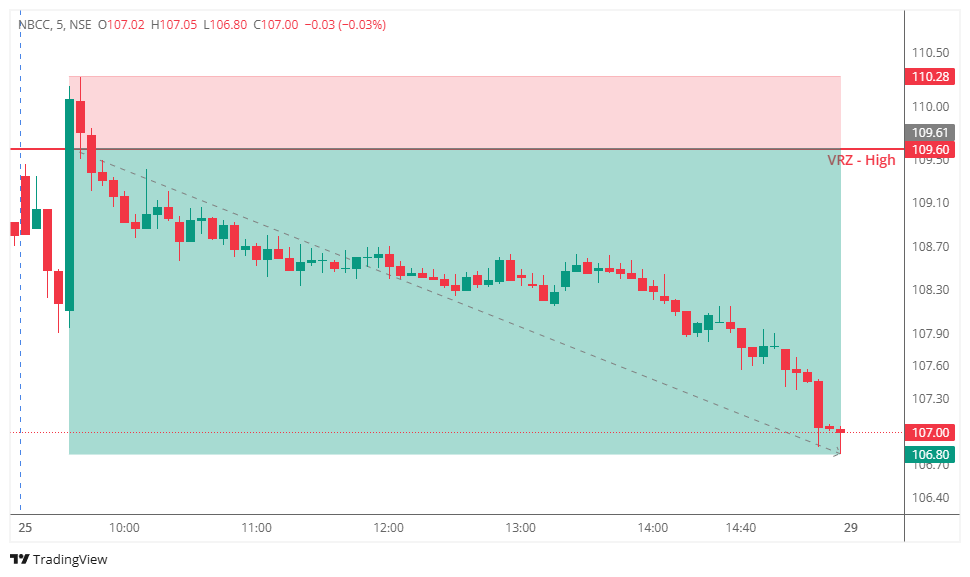
NBCC approached the previously identified VRZ High at ₹109.60 and attempted to break above the resistance zone during the early part of the session.
The breakout initially attracted buyers who anticipated a continuation toward higher levels. Price briefly traded above the VRZ High, creating the impression that bullish momentum was building and a sustained breakout was underway.
However, the breakout failed to gain acceptance.
Selling pressure quickly emerged near the highs, forcing price back below ₹109.60. This rejection indicated that buyers lacked the conviction required to sustain above resistance and that the breakout lacked institutional support.
As price continued to trade below the VRZ High, the failed breakout evolved into a confirmed bearish BOF setup.
The combination of trapped breakout buyers exiting their positions and fresh sellers entering the market generated sustained downside momentum throughout the session.
Many traders assumed:
The market disagreed.
When price moved back below the VRZ High:
This transition from bullish optimism to bearish control created the foundation for a strong downside move.
1. A Breakout Requires Acceptance
Trading above resistance is not enough. The market must sustain above the level to validate a genuine breakout.
2. Failed Breakouts Often Create Powerful Reversals
When buyers become trapped above resistance, their exits can accelerate the downside move.
3. Confirmation Improves Probability
Waiting for price to reclaim the area below the VRZ High provided a cleaner and higher-probability entry.
4. Market Structure Reveals Intent
The inability to hold above ₹109.60 highlighted weakening bullish participation and growing seller dominance.
This NBCC setup demonstrated how a failed breakout at a key resistance zone can transform into a high-conviction intraday trading opportunity. Rather than chasing the initial breakout, waiting for BOF confirmation allowed traders to align with actual market direction and capitalize on the ensuing bearish momentum.

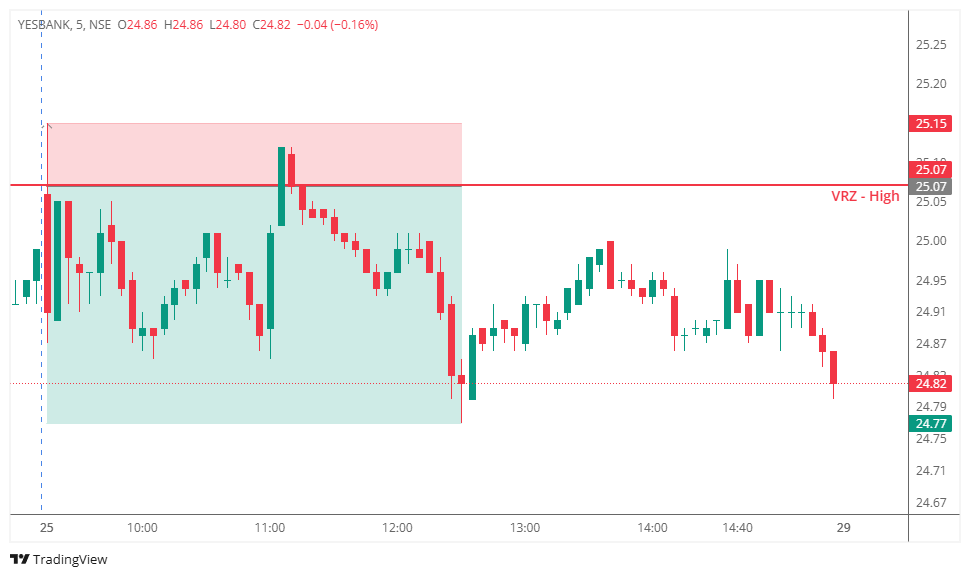
YESBANK approached the previously identified VRZ High at ₹25.07 and attempted to break above the resistance zone during the session.
Initially, the breakout attracted buyers who anticipated a continuation move above resistance. The stock briefly traded beyond the VRZ High, creating the impression that bullish momentum was strengthening.
However, the breakout failed to gain acceptance.
Selling pressure emerged near the highs, and price quickly moved back below ₹25.07. This rejection signaled that buyers were unable to sustain control above resistance and that the breakout lacked genuine participation.
As price continued trading below the VRZ High, the failed breakout evolved into a confirmed bearish BOF setup.
The rejection attracted fresh sellers while breakout buyers were forced to exit losing positions, accelerating the downside move.
Many traders assumed:
The market disagreed.
When price slipped back below the VRZ High:
This shift in market sentiment transformed bullish expectations into a bearish intraday move.
1. Resistance Requires Acceptance for Continuation
Trading above resistance alone is insufficient. Sustained acceptance is required to validate a breakout.
2. Failed Breakouts Often Create Reversal Opportunities
When buyers become trapped above resistance, the resulting exit activity can fuel strong directional moves.
3. Confirmation Improves Trade Quality
Waiting for price to move back below the VRZ High provided higher-probability trade confirmation.
4. Market Behaviour Reveals Intent
The inability to sustain above ₹25.07 revealed weakening bullish conviction and growing seller participation.
