
Select a trading day to view all Scanner results, chart evidence, and market explanations.
4 Scanners Available
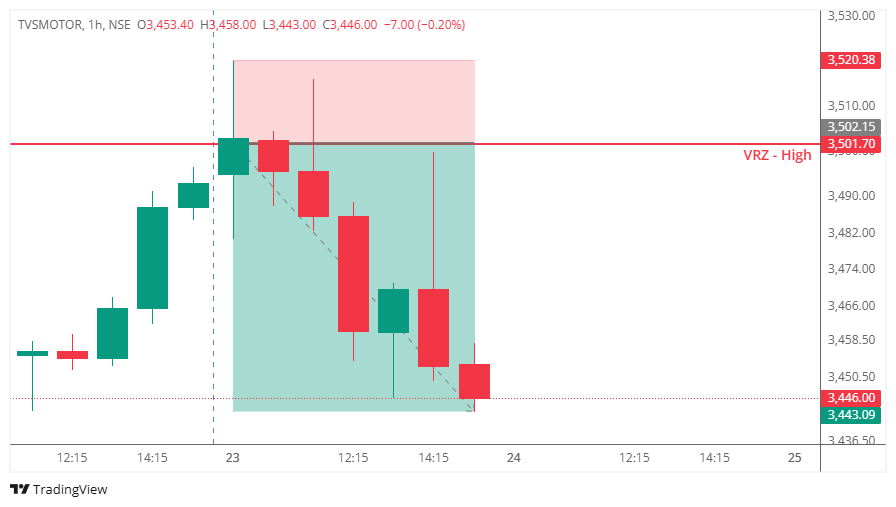
TVSMOTOR approached the previously identified Daily VRZ High at ₹3,501.70 and briefly traded above the resistance zone, creating the appearance of a bullish breakout.
At first glance, the move suggested that buyers had gained control and a continuation toward higher levels was likely. The breakout attracted fresh buying interest and encouraged traders to anticipate further upside momentum.
However, the market failed to sustain above the VRZ.
Instead of establishing acceptance above ₹3,501.70, selling pressure emerged near the resistance zone. Price quickly moved back below the VRZ High and began forming lower highs on the 1-hour chart.
This transition confirmed a classic bearish Breakout Failure (BOF).
Once the breakout failed, trapped buyers started exiting their positions while fresh sellers entered the market. The combination of long unwinding and new selling participation accelerated the downside move.
The setup eventually delivered a 1.69% decline with a favorable 1:3 risk-reward outcome.
Many traders assumed:
The market responded differently:
This shift from anticipated reversal to continued weakness prevented the setup from becoming a high-probability trade.
1. Every Breakdown Does Not Become a BOF
Price must reclaim and sustain above the VRZ for a valid bullish BOF to emerge.
2. Acceptance Determines Confirmation
Without acceptance above ₹439.25, the reversal premise remained incomplete.
3. Consolidation Below Support Signals Weakness
Sideways trading beneath the VRZ often reflects a lack of buying conviction.
4. Patience Preserves Capital
Avoiding incomplete setups is a key component of professional trading discipline.
This was a textbook swing trading example of a bearish BOF setup at a major Daily VRZ High. The failed breakout trapped aggressive buyers and created a favorable risk-to-reward short opportunity.
The trade followed the principles of the Logical Trading System (LTS), demonstrating how patience, confirmation, and disciplined execution can help traders capitalize on failed breakout scenarios.

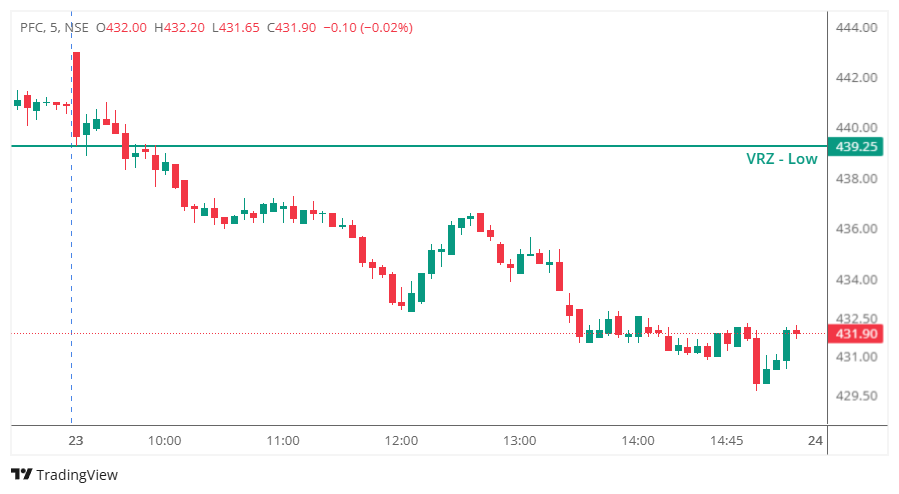
PFC approached the previously identified VRZ Low at ₹439.25 and traded below the support zone, indicating bearish control in the early stages of the session.
At first glance, the weakness created the possibility of a bullish Breakout Failure (BOF) setup, where a failed breakdown could potentially attract buyers and trigger an intraday recovery.
However, the market never reclaimed the VRZ Low or established acceptance above ₹439.25.
Instead of developing into a textbook BOF structure, the stock remained below the support zone and traded in a narrow consolidation range. The expected buying momentum failed to emerge, and the reversal setup never matured into a tradable opportunity.
As a result, the potential BOF was invalidated before confirmation.
Many traders assumed:
❌ The sharp decline below support was overextended.
❌ A failed breakdown would trigger a meaningful recovery.
❌ Buyers would reclaim the VRZ and regain control.
The market responded differently:
❌ Sellers maintained dominance below ₹439.25.
❌ Buying interest remained limited.
❌ Price failed to establish acceptance above the VRZ.
❌ The expected BOF structure never developed.
This shift from anticipated reversal to continued weakness prevented the setup from becoming a high-probability trade.
✅ Every Breakdown Does Not Become a BOF
Price must reclaim and sustain above the VRZ for a valid bullish BOF to emerge.
✅ Acceptance Determines Confirmation
Without acceptance above ₹439.25, the reversal premise remained incomplete.
✅ Consolidation Below Support Signals Weakness
Sideways trading beneath the VRZ often reflects a lack of buying conviction.
✅ Patience Preserves Capital
Avoiding incomplete setups is a key component of professional trading discipline.
This session highlighted an important principle of price action trading: a potential BOF setup is not the same as a confirmed BOF setup. Although PFC briefly hinted at a possible failed breakdown scenario, the absence of price reclaim and follow-through buying prevented the trade from meeting the criteria of the Logical Trading System (LTS).
Remaining patient and avoiding a forced entry preserved both capital and discipline.

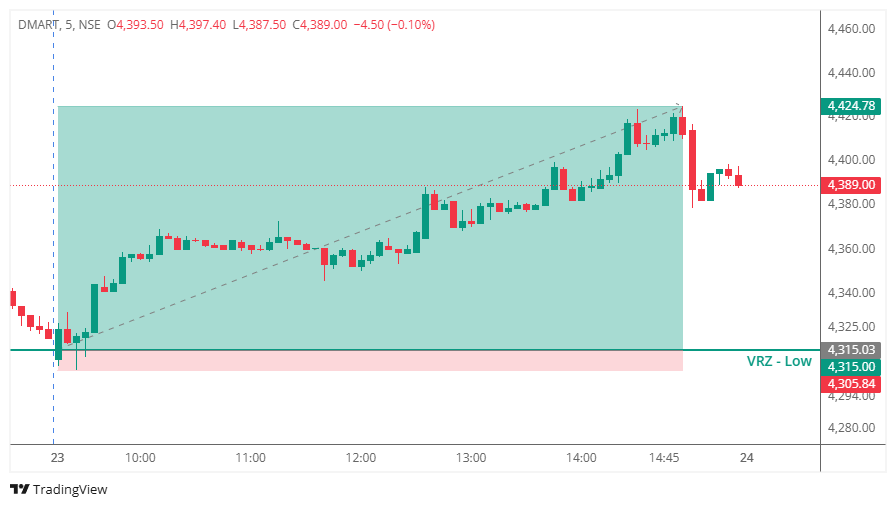
DMART approached the previously identified VRZ Low at ₹4,315.00 and briefly traded below the support zone, creating the appearance of a bearish breakdown.
At first glance, the move suggested that sellers had gained control and lower prices were likely. The breakdown attracted fresh short sellers anticipating downside continuation and caused existing longs to become cautious.
However, the market failed to accept prices below the VRZ.
Instead of extending lower, buyers quickly absorbed the selling pressure and pushed the stock back above ₹4,315.00. Within a few candles, price reclaimed the VRZ Low and started building acceptance above the support zone.
This transition confirmed a classic Breakout Failure (BOF).
Once the breakdown failed, trapped sellers began covering their positions while fresh buyers entered the market. The combination of short covering and new buying participation generated a strong intraday recovery.
The bullish reversal eventually delivered a 2.54% upside move with an exceptional 1:12 risk-reward outcome.
Many traders assumed:
The market disagreed.
When price reclaimed ₹4,315.00:
This change from bearish confidence to uncertainty became the fuel for the upside move.
1. A Breakdown Requires Acceptance
Trading below support is not enough. The market must sustain below that level.
2. Reclaiming the VRZ Reveals Strength
The quick recovery above ₹4,315.00 highlighted aggressive buying interest.
3. Failed Breakdowns Often Reverse Sharply
Trapped sellers and fresh buyers frequently create powerful recovery moves.
4. Confirmation Beats Prediction
Waiting for BOF confirmation provided a significantly higher-probability long setup.

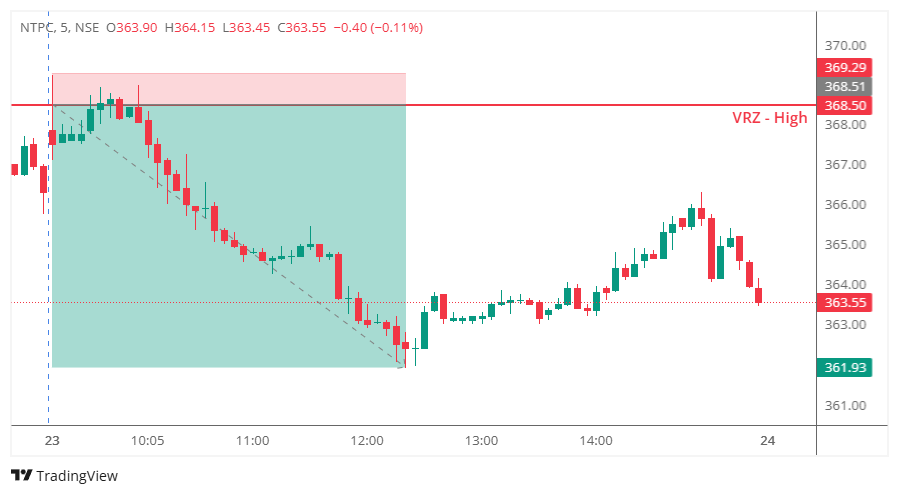
NTPC approached the previously identified VRZ High at ₹368.50 and briefly traded above the resistance zone, creating the appearance of a bullish breakout.
At first glance, the move suggested that buyers had gained control and higher prices were likely. The breakout attracted fresh long positions expecting upside continuation.
However, the market failed to sustain above the VRZ.
Instead of building acceptance above ₹368.50, selling pressure emerged and quickly pushed the stock back below the resistance zone. Within a few candles, price reclaimed the breakout area from above and began establishing acceptance below the VRZ High.
This transition confirmed a classic bearish Breakout Failure (BOF).
Once the breakout failed, trapped buyers started exiting their positions while fresh sellers entered the market. The combination of long unwinding and new selling participation generated a steady intraday decline.
The setup eventually delivered a 1.79% downside move with an exceptional 1:8 risk-reward outcome.
Many traders assumed:
The market disagreed.
When price slipped back below ₹368.50:
This change from bullish confidence to uncertainty became the fuel for the downside move.
1. A Breakout Requires Acceptance
Trading above resistance is not enough. The market must sustain above that level.
2. Rejection Above the VRZ Is Valuable Information
The quick failure above ₹368.50 revealed aggressive supply and lack of buying commitment.
3. Failed Breakouts Often Reverse Sharply
Trapped buyers and fresh sellers frequently create powerful downside moves.
4. Confirmation Beats Prediction
Waiting for BOF confirmation provided a significantly higher-probability short setup.
