
Select a trading day to view all Scanner results, chart evidence, and market explanations.
3 Scanners Available
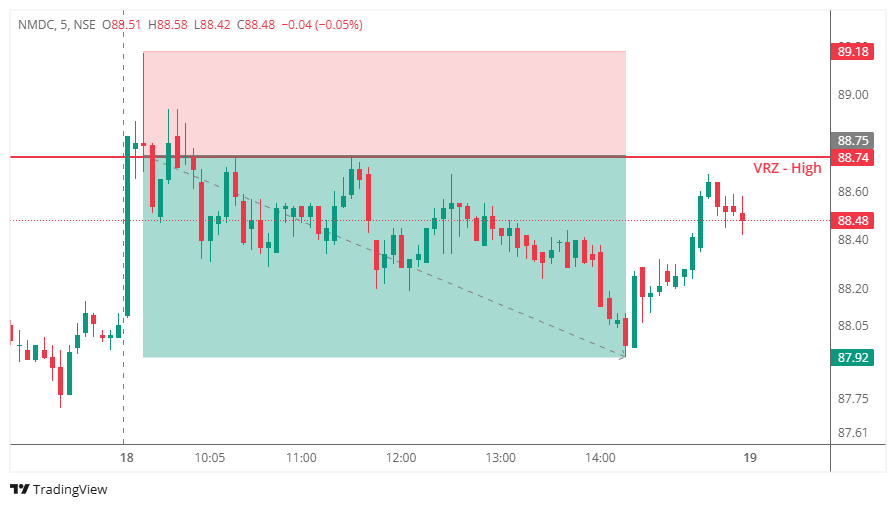
NMDC approached the previously identified VRZ High at ₹88.75 and initially traded above the resistance zone, creating the appearance of a genuine bullish breakout.
At first glance, the move suggested that buyers had gained control and that the stock was preparing for further upside. The breakout attracted momentum traders and encouraged participants to anticipate a continuation rally above the resistance zone.
However, the market failed to accept prices above the VRZ.
Instead of sustaining at higher levels, selling pressure emerged almost immediately near the breakout area. Price gradually slipped back below ₹88.75 and started establishing acceptance beneath the VRZ High.
This transition confirmed a classic Breakout Failure (BOF).
As the breakout failed, breakout buyers started losing conviction and began exiting their positions. At the same time, fresh sellers recognized the rejection of higher prices and initiated short positions. The combination of long unwinding and new selling participation created a steady intraday decline.
The price action once again demonstrated an important BOF principle: when the market rejects higher prices after a breakout, trapped buyers often become the fuel for the downside move.
Many traders assumed:
The market disagreed.
When price moved back below ₹88.75:
This transition from optimism to uncertainty became the fuel for the downside move.
Trading above resistance is not enough. The market must sustain above that level.
The quick move back below ₹88.75 revealed aggressive selling interest and lack of buyer commitment.
Trapped buyers and fresh sellers frequently create sharp downside moves.
Waiting for BOF confirmation provided a significantly higher-probability short setup.

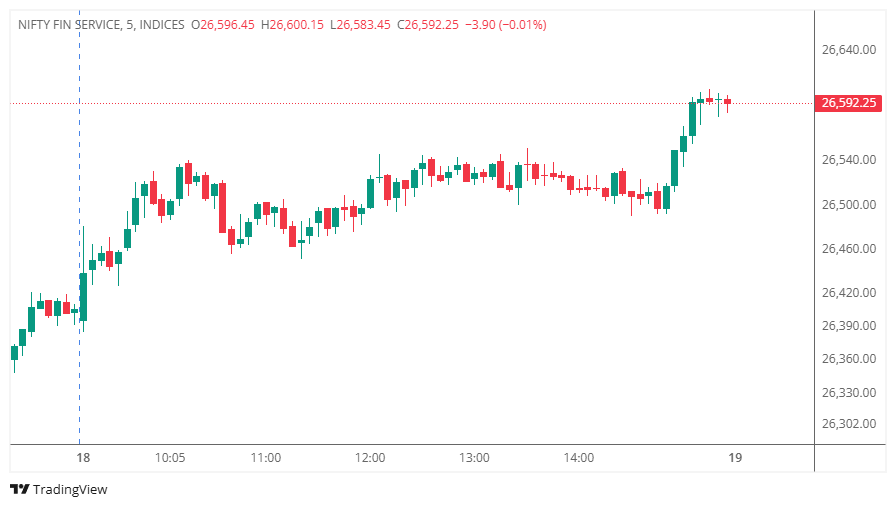
FINNIFTY initially approached the VRZ High and briefly showed signs of hesitation near the resistance zone. At first glance, the price action suggested the possibility of a Breakout Failure (BOF), where buyers could become trapped and trigger a downside reversal.
However, the expected rejection never developed.
Instead of slipping below the VRZ and confirming weakness, buyers continued defending higher prices. The index maintained acceptance above the resistance area and gradually resumed its upward momentum.
As a result, the potential BOF setup was invalidated before confirmation, and no short trade was triggered.
Many traders anticipated:
The market had different intentions.
As price sustained above the VRZ:
The absence of rejection was itself valuable information.
Price must show acceptance back below the VRZ before a BOF can be confirmed.
When the market comfortably holds above resistance, the bearish thesis loses validity.
Avoiding unconfirmed setups is often more valuable than forcing trades.
Sometimes the best trade is recognizing that conditions are not favorable and staying out.
This session highlighted an important principle of BOF trading: potential is not confirmation. FINNIFTY briefly hinted at a failed breakout scenario but never developed the structure required for execution.
Professional traders wait for confirmation, avoid assumptions, and preserve capital when the market refuses to validate the setup.

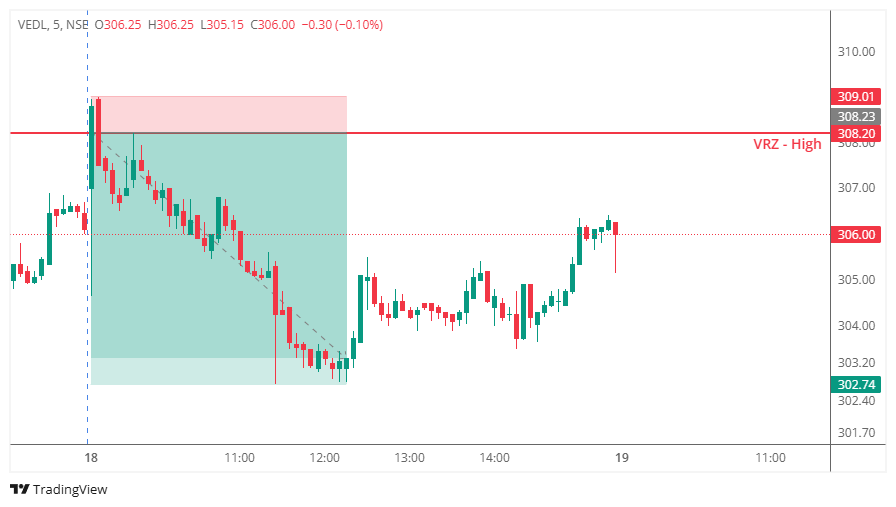
VEDL approached the previously identified VRZ High at ₹308.20 and briefly traded above the resistance zone, creating the appearance of a bullish breakout.
At first glance, the move suggested that buyers had gained control and higher prices were likely. The breakout attracted momentum traders expecting further upside continuation.
However, the market failed to accept prices above the VRZ.
Instead of extending higher, sellers quickly absorbed the buying pressure and pushed the stock back below ₹308.20. Within a few candles, price slipped beneath the VRZ High and started establishing acceptance below the resistance zone.
This transition confirmed a classic Breakout Failure (BOF).
As the breakout failed, trapped buyers began exiting their positions while fresh sellers recognized the rejection of higher prices and entered the market. The combination of long unwinding and new selling participation generated a sharp intraday decline.
Many traders assumed:
The market disagreed.
When price moved back below ₹308.20:
This transition from bullish confidence to uncertainty became the fuel for the downside move.
Trading above resistance is not enough. The market must sustain above that level.
The quick move back below ₹308.20 revealed aggressive selling interest.
Trapped buyers and fresh sellers frequently create sharp downside moves.
Waiting for BOF confirmation provided a significantly higher-probability short setup.
