
Select a trading day to view all Scanner results, chart evidence, and market explanations.
2 Scanners Available
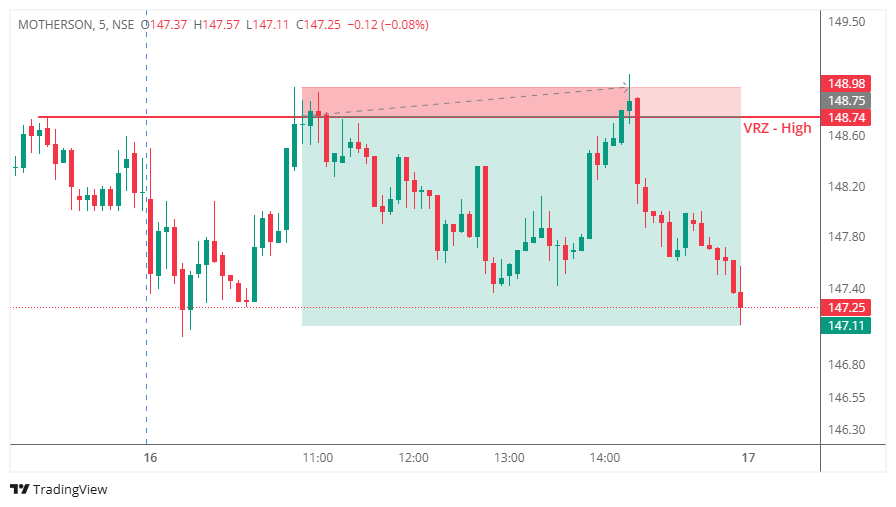
MOTHERSON approached the VRZ High at ₹148.74 and initially displayed strong bullish intent. Price briefly moved above the resistance zone, creating the appearance of a genuine breakout and attracting momentum buyers expecting further upside.
However, the breakout lacked acceptance.
Instead of sustaining above ₹148.74, sellers quickly emerged and pushed the stock back below the VRZ High. The inability to hold higher prices confirmed a classic Breakout Failure (BOF) setup.
Once the breakout failed, trapped buyers started exiting their positions while fresh sellers entered the market. This combination created sustained downside momentum, resulting in a sharp intraday decline from the breakout area.
Many traders assumed:
The market had a different plan.
When price failed to sustain above ₹148.74:
The market rewarded patience and confirmation rather than chasing the initial breakout.
A breakout is only valid when the market sustains above the resistance zone.
The inability to hold above ₹148.74 revealed aggressive seller participation.
Trapped buyers and fresh selling often create powerful downside moves.
Waiting for the BOF confirmation provided a significantly higher-probability trade.

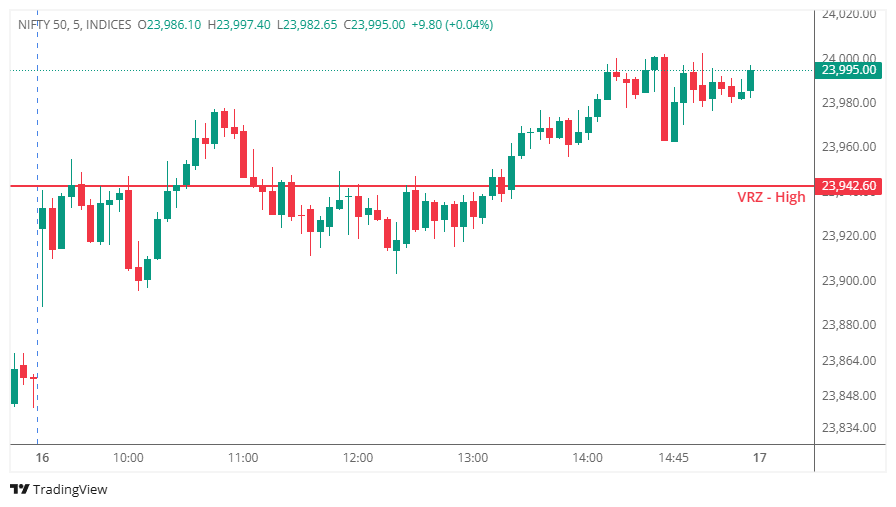
NIFTY 50 approached the VRZ High at ₹23,942.60 and initially showed signs of a potential Breakout Failure (BOF). The index briefly moved around the resistance zone, creating the impression that buyers might lose momentum and trigger a reversal.
However, the expected selling pressure never materialized.
Instead, buyers absorbed the supply near the VRZ and gradually established acceptance above the resistance level. As the session progressed, the index continued trading above ₹23,942.60 and extended its gains.
This confirmed a BOF Failure, where the anticipated reversal failed and the breakout remained valid.
Many traders expected:
The market had different plans.
When NIFTY sustained above ₹23,942.60:
The psychology shifted from expected trapped buyers to actual trapped sellers, fueling the upside move.
A valid BOF setup can still fail. Trading is about probabilities, not certainty.
Once price accepted levels above ₹23,942.60, the bearish thesis weakened significantly.
Without sustained selling pressure, a BOF loses its edge.
When the market invalidates a setup, discipline and risk management become more important than being right.
This was a textbook example of a BOF setup that failed due to sustained buying above the VRZ High. The trade adhered to the rules of the Logical Trading System (LTS), making it a valid execution despite the unfavorable outcome.
Professional trading is not about winning every trade. It is about executing the process consistently, respecting stop losses, and preserving capital for future high-probability opportunities.
The loss remained controlled, while the trading process remained intact.
