
Select a trading day to view all Scanner results, chart evidence, and market explanations.
3 Scanners Available
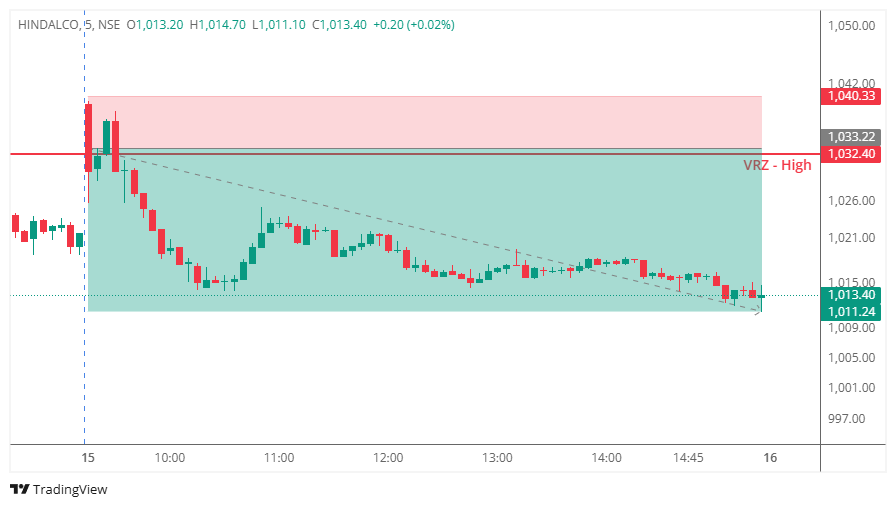
HINDALCO approached the VRZ High at ₹1,032.40 shortly after the market opened and initially attempted to break above the resistance zone.
The move attracted breakout traders expecting further upside momentum. However, the breakout lacked acceptance as sellers quickly emerged near the resistance area and pushed the stock back below the VRZ.
The inability to sustain above ₹1,032.40 confirmed a classic Breakout Failure (BOF) setup.
Following the rejection, selling pressure remained consistent throughout the session. The stock continued making lower highs and lower lows, leading to a steady intraday decline and a strong downside move away from the resistance zone.
As HINDALCO moved above the VRZ High, many traders assumed:
The market had a different plan.
When price failed to hold above ₹1,032.40:
This shift from optimism to uncertainty fueled the downside move.
Crossing resistance is only the beginning.
A breakout becomes valid only when the market accepts higher prices and continues building value above the level.
HINDALCO failed this test.
The inability to sustain above ₹1,032.40 revealed strong seller participation.
The rejection itself became the trading signal.
Successful breakouts require continuous buying.
Failed breakouts are powered by:
This combination frequently produces fast and sustained moves.
Predicting the breakout would have resulted in a losing trade idea.
Waiting for BOF confirmation provided a significantly higher-probability short opportunity.
Several factors aligned to make this a high-quality BOF setup:
✔ Immediate rejection after breakout.
✔ Failure to build acceptance above VRZ.
✔ Trapped breakout buyers.
✔ Consistent bearish follow-through.
✔ Clear intraday downtrend after confirmation.
When these elements combine, the probability of a successful BOF increases substantially.

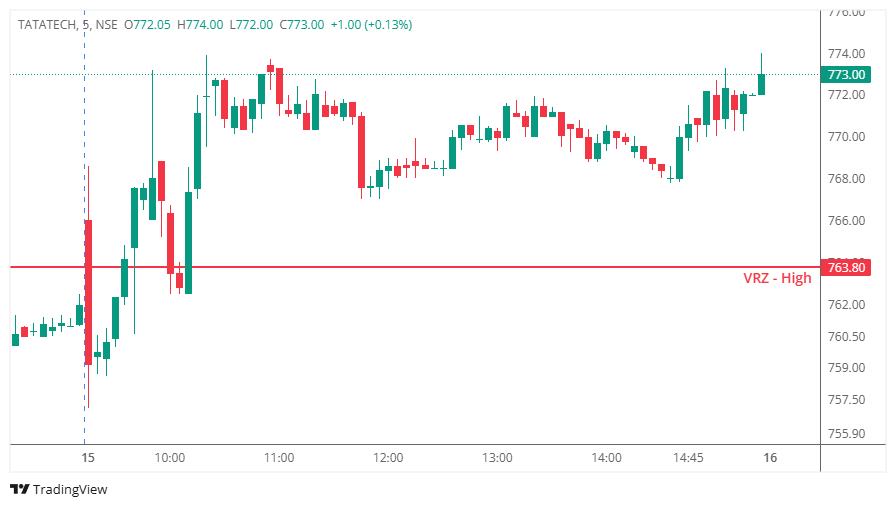
TATATECH moved above the VRZ High at ₹763.80 and briefly showed signs of a potential Breakout Failure (BOF). The initial rejection attracted traders looking for a short opportunity below resistance.
However, the expected selling pressure never developed.
Instead, buyers absorbed the supply, defended the breakout level, and maintained acceptance above the VRZ. As the session progressed, the stock continued moving higher, invalidating the BOF setup.
The result was a BOF Failure, where the breakout remained successful and bearish expectations were negated.
Many traders assumed the rejection would lead to a downside move.
When price failed to continue lower:
The psychology shifted from trapped buyers to trapped sellers, fueling further upside momentum.
A valid setup can still fail. Trading is about managing risk, not predicting outcomes.
Without sustained selling pressure, a BOF loses its edge.
Once TATATECH held above ₹763.80, the bearish thesis weakened significantly.
A failed setup becomes manageable when risk is predefined.

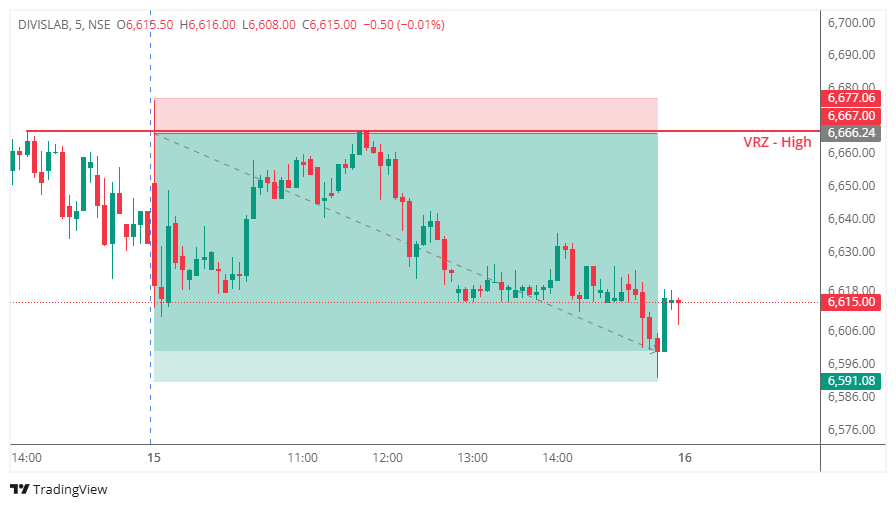
DIVISLAB approached the VRZ High at ₹6,666.04 during the session and initially showed signs of bullish strength as price tested the resistance zone multiple times.
The stock briefly moved above the VRZ High, creating the appearance of a potential breakout. This attracted breakout traders expecting continuation toward higher levels and a possible expansion beyond the resistance area.
However, the breakout lacked follow-through.
Instead of sustaining above ₹6,666.04, sellers emerged near the resistance zone and quickly pushed the stock back below the VRZ. The inability to maintain higher prices signaled that the breakout was not being accepted by the market.
This rejection confirmed a classic Breakout Failure (BOF) setup.
Following the failed breakout, selling pressure gradually increased throughout the session. Price continued making lower highs and lower lows, eventually accelerating toward the downside and delivering a strong intraday move away from the resistance zone.
Many traders are conditioned to believe:
Resistance Breaks = Buy Opportunity
As DIVISLAB moved above ₹6,666.04, market participants likely expected:
The market had a different plan.
When price failed to sustain above the VRZ:
Started questioning the strength of the move.
Exited positions to protect capital.
Found themselves trapped near resistance.
Recognized the weakness and increased selling pressure.
The shift from optimism to uncertainty created the fuel for the subsequent decline.
The market rewarded traders who waited for confirmation and punished traders who chased the breakout.
A breakout is not validated simply because price trades above resistance.
The market must demonstrate acceptance above the level through sustained trading.
The failure to hold above ₹6,666.04 revealed aggressive seller participation near the VRZ High.
The rejection itself became the trading signal.
When breakout traders become trapped, their exits can amplify downside momentum.
This often creates cleaner and faster moves than successful breakouts.
Buying the breakout would have resulted in a losing trade.
Waiting for the BOF confirmation provided a significantly higher-probability setup.
