
Select a trading day to view all Scanner results, chart evidence, and market explanations.
4 Scanners Available
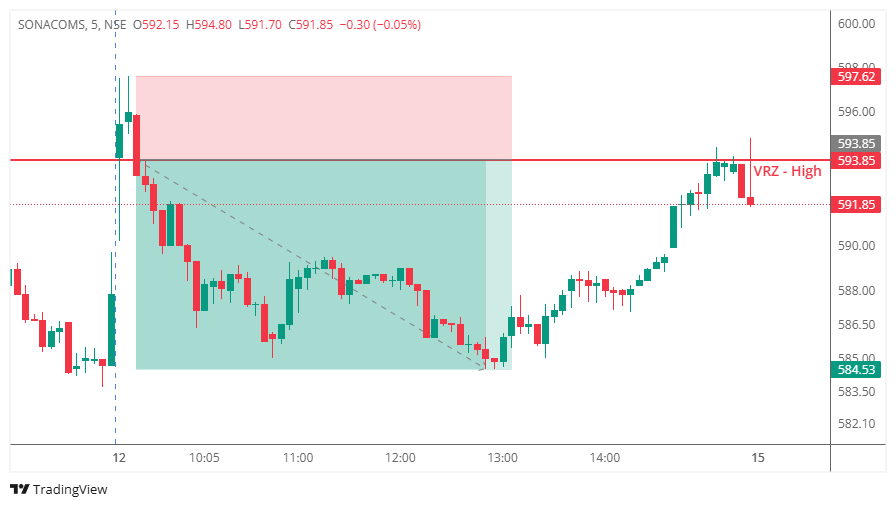
SONACOMS approached a previously identified VRZ High at ₹593.85 during the opening phase of the session and initially displayed strong bullish intent.
Price surged above the resistance zone shortly after the market opened, creating the appearance of a genuine breakout. The move attracted breakout traders expecting continuation toward higher levels and fresh intraday highs.
However, the breakout lacked acceptance.
Instead of sustaining above ₹593.85, sellers emerged aggressively near the breakout area. The stock quickly slipped back below the VRZ High, invalidating the bullish breakout and trapping traders who entered based on the initial strength.
This rejection confirmed a classic Breakout Failure (BOF) setup.
Once the breakout failed, selling pressure intensified. The stock witnessed a steady intraday decline throughout the first half of the session, eventually moving toward the ₹584 zone before finding support.
The inability to hold above resistance transformed what initially appeared to be a bullish breakout into a high-probability short opportunity.
One of the biggest traps in intraday trading is believing that every breakout will continue.
As SONACOMS moved above ₹593.85, many traders assumed:
The market disagreed.
When price quickly moved back below the VRZ:
Started questioning the strength of the move.
Exited positions to avoid larger losses.
Found themselves trapped near the highs.
Recognized the rejection and became increasingly aggressive.
The psychology shifted rapidly from optimism to regret.
This transition created the downside momentum that powered the intraday decline.
The market rewarded patience and punished assumptions.
Crossing resistance is only the first step.
The real confirmation comes when the market can sustain and build value above the breakout zone.
SONACOMS failed that test.
The sharp rejection from ₹593.85 indicated that sellers were actively defending higher prices.
The reaction itself provided valuable information about market intent.
When breakout buyers become trapped, their exits contribute to additional selling pressure.
This often creates faster and cleaner moves than successful breakouts.
Buying the breakout would have resulted in a losing trade.
Waiting for the BOF confirmation provided the higher-probability setup.
The SONACOMS setup on 12 Jun 2026 provided a textbook VRZ High Breakout Failure (BOF). Although the stock initially appeared strong by moving above ₹593.85, it failed to establish acceptance above the resistance zone.
Once the breakout was rejected, sellers gained control and the stock moved lower, delivering a clean 1:2 Risk-Reward opportunity.
This setup highlights a key market principle: price crossing resistance is not enough. Sustained acceptance above the level is what validates a breakout. When acceptance fails, the BOF often becomes the best trading opportunity.

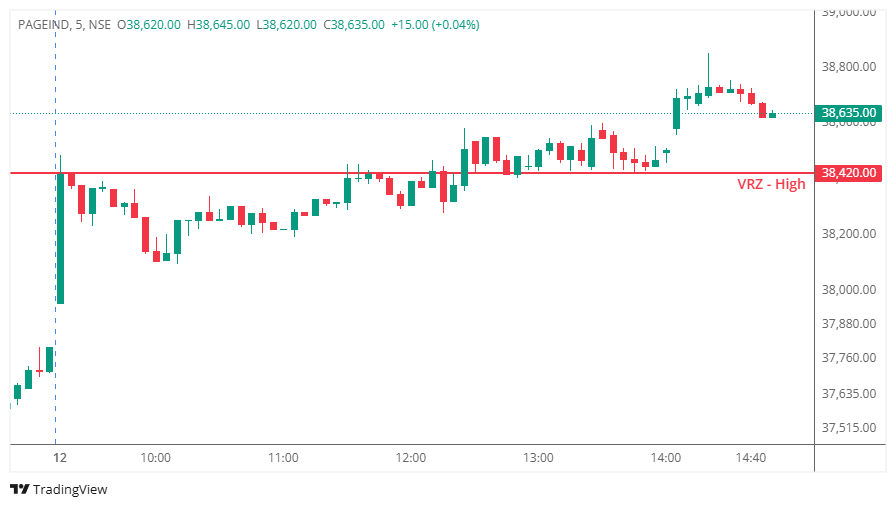
Price initially moved above the VRZ High level of ₹38,420, creating the appearance of a breakout failure opportunity. The setup triggered as price briefly hesitated around the zone and showed signs of rejection.
However, sellers failed to gain control after the trigger. Instead of breaking down below the zone, buyers absorbed the selling pressure and continued accumulating positions.
The stock reclaimed strength above the VRZ level, converting resistance into support. Momentum gradually increased throughout the session, resulting in a sustained bullish move and eventually hitting the stop loss of the BOF short setup.
The failure of the breakdown attempt confirmed that market participants were willing to buy higher prices, invalidating the bearish thesis.
A BOF setup becomes vulnerable when:
This trade highlights that:
This was a textbook example of a BOF setup that failed due to strong buyer participation. The trade followed the rules of the Logical Trading System (LTS), making it a valid execution despite the loss.
Professional trading is not about being right on every trade. It is about maintaining discipline, respecting stop losses, and preserving capital for the next high-probability opportunity.
The loss remained controlled, while the trading process remained intact.

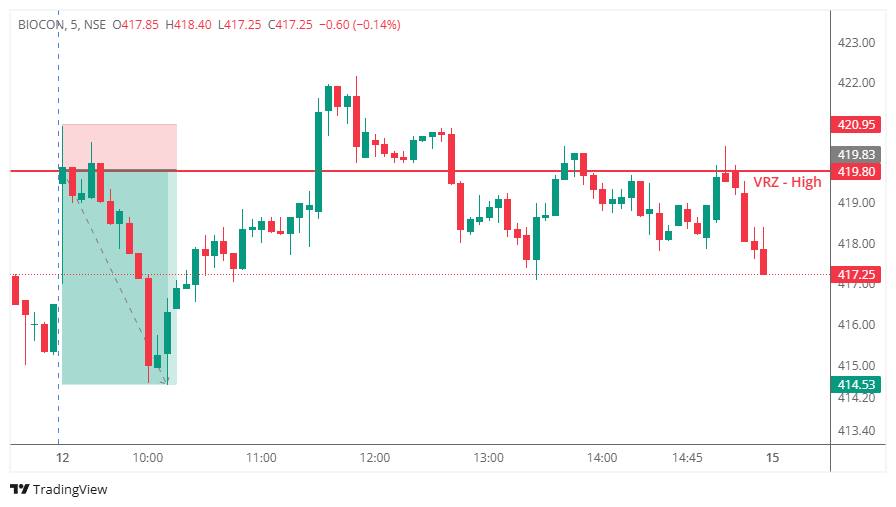
BIOCON attempted multiple moves above the VRZ High zone and repeatedly tested resistance, encouraging traders to anticipate a bullish breakout.
However, buyers failed to establish acceptance above the resistance level.
Price quickly slipped back below the VRZ High, confirming a BOF short setup. Once the rejection was confirmed, selling pressure increased and the stock began a steady intraday decline.
The inability of buyers to reclaim the VRZ zone strengthened bearish conviction and allowed sellers to maintain control throughout the session.
As the trade progressed, the stock continued making lower highs and lower lows, providing a clean downside structure for traders following the BOF framework.
Repeated testing of resistance does not guarantee a breakout.
In many cases, repeated failures reveal hidden weakness rather than strength.
When the market repeatedly attracts breakout buyers but cannot hold above resistance, the resulting exits can create powerful moves in the opposite direction.
This BIOCON setup demonstrates how patience and confirmation often outperform prediction.
The setup offered a clearly defined risk above the BOF high while providing a favorable downside opportunity.
Once the rejection was confirmed, the stock gradually trended lower and rewarded traders who remained patient with the position.
The move highlighted one of the core BOF principles:
The best opportunities often emerge when the market fails to do what the majority expects.

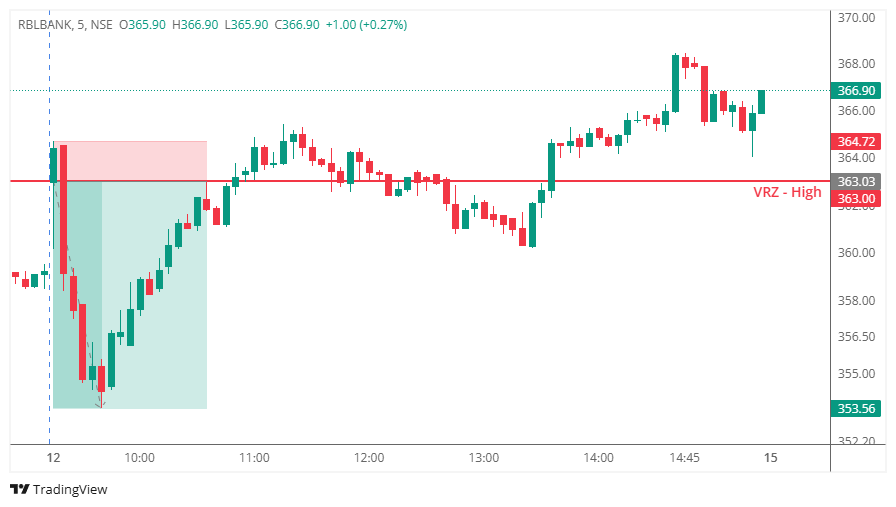
RBLBANK opened near a key resistance area and briefly traded above the VRZ High at ₹363.00, creating the impression that buyers were gaining control.
The breakout initially looked convincing. Strong bullish participation near the resistance zone attracted traders looking for an upside continuation move.
However, the market failed to build value above the breakout level.
Instead of attracting fresh buying interest, the stock encountered immediate resistance. The breakout lacked conviction, and price quickly returned below the VRZ.
This rejection revealed that the move above resistance was not genuine demand but rather a temporary price expansion.
As the stock remained below the VRZ, sellers gradually increased pressure and the bearish structure became more evident.
The failed breakout eventually transformed into a high-probability BOF setup, leading to a sustained intraday decline.
Financial markets often move against the expectations of the majority.
When RBLBANK traded above resistance, many market participants believed:
But professional traders look for something different.
They look for acceptance.
Price crossed resistance, but the market never accepted those higher levels.
Once the breakout lost momentum:
Found themselves holding weak positions.
Entered near the highs expecting continuation.
Recognized the lack of follow-through.
Used the breakout liquidity to offload positions.
As confidence disappeared, selling pressure increased and the downside move accelerated.
The VRZ High acted exactly as intended.
Despite the breakout attempt, sellers defended the zone aggressively and prevented acceptance above resistance.
Successful breakouts require continuous buying pressure.
RBLBANK failed to attract enough buyers after crossing resistance, making the breakout vulnerable.
Once the breakout failed, traders who bought above resistance became potential sellers.
Their exits helped accelerate the bearish move.
The transition from breakout to rejection occurred rapidly.
This quick shift provided clear evidence that market control had moved from buyers to sellers.
A breakout candle alone is not enough.
The market must demonstrate its willingness to sustain above resistance.
When the market rejects higher prices, it reveals where professional money is willing to participate.
Ignoring that information can be costly.
Many traders enter during the breakout.
Experienced traders often wait to see whether the breakout succeeds or fails.
The BOF setup emerges from that patience.
Even the highest-quality setups require disciplined risk management.
The objective is not to avoid losses completely but to ensure that winning trades outweigh losing trades over time.
RBLBANK provided a classic example of how failed breakouts can offer some of the best intraday trading opportunities.
The market briefly moved above a significant resistance level, attracted breakout participation, and then quickly reversed course.
This rejection trapped bullish traders, shifted sentiment, and created the conditions for a strong downside move.
The setup highlights one of the most important principles in price action trading:
The best opportunities often appear not when a breakout succeeds, but when a breakout fails.
